August 4, 2026
When Commodity Cycles Align: The Rare Conditions That Produce Market-Defining Years
Resource markets rarely deliver clean, synchronised rallies. More commonly, they produce winners and losers across commodity classes, as price strength in one mineral offsets weakness in another. FY26 was different. A confluence of macroeconomic pressures, energy transition tailwinds, and renewed institutional appetite for hard assets created conditions where multiple commodity categories moved upward simultaneously, compressing what would normally be a decade of incremental market cap growth into a single financial year.
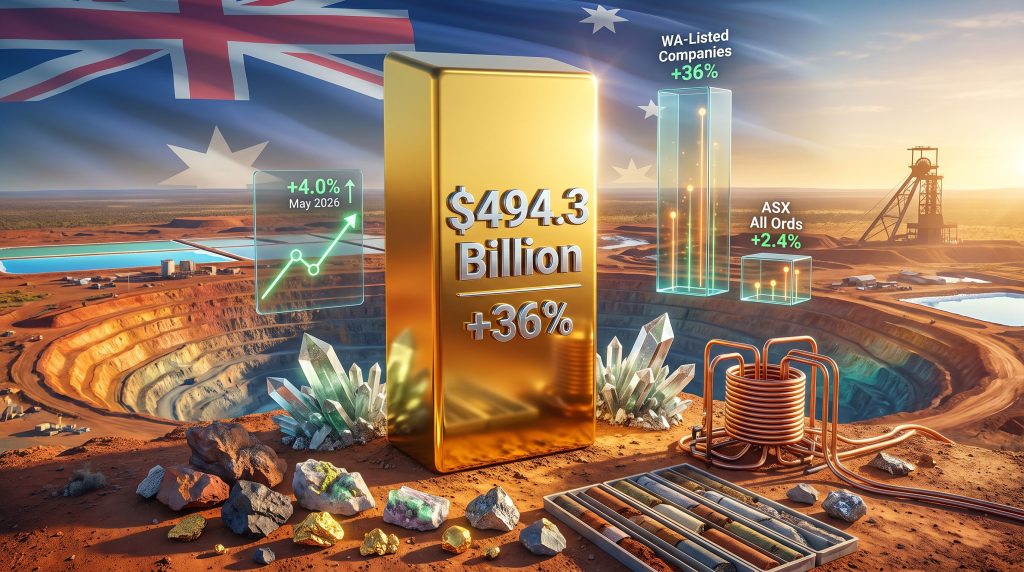
WA listed companies surge to record market capitalisation is the defining story of FY26. Collectively, these companies reached a combined market cap of $494.3 billion by year end, according to the Deloitte WA Index Diggers and Dealers special edition. That figure represents a 36% increase year-on-year and stands in stark contrast to the 2.4% return recorded by the broader ASX All Ordinaries Index over the same period. The performance gap of more than 33 percentage points reflects a fundamental repricing of resource equities in response to structural forces that extend well beyond a single year's commodity cycle.
When big ASX news breaks, our subscribers know first
The Structural Case for WA's Market Dominance
Why Western Australia Remains the Engine Room of Australian Equity Markets
Western Australia accounts for a relatively modest share of Australia's total population, yet its listed company universe punches far above its demographic weight on the ASX. This apparent paradox resolves quickly when you examine the state's geological endowment: WA hosts some of the world's most significant hard-rock lithium deposits, a substantial proportion of global operating gold mines, and extensive iron ore, copper, and nickel resources.
This resource concentration creates a distinctive investment characteristic. WA-listed entities carry amplified sensitivity to global commodity cycles, meaning that when multiple resource classes strengthen simultaneously, the state's listed companies experience compounding valuation uplift that diversified industrial-sector indices simply cannot replicate. Furthermore, the WA resources sector contribution to the broader economy reinforces why the $494.3 billion milestone is not an anomaly — it is the predictable output of structural forces building across multiple commodity cycles.
How WA-Listed Companies Compared Against the Broader ASX
The performance differential in FY26 was extraordinary by any historical measure:
| Index or Cohort | FY26 Return | Market Cap Outcome |
|---|---|---|
| WA-Listed Companies (Deloitte WA Index) | +36% | $494.3 billion (record high) |
| ASX All Ordinaries Index | +2.4% | Broad market benchmark |
| WA Index Monthly (May 2026) | +4.0% | Interim leading indicator |
The monthly gain of approximately 4.0% recorded in May 2026 alone served as an early signal of the full-year outcome, suggesting that the momentum driving WA equities was accelerating rather than plateauing as the financial year concluded. For investors monitoring sector rotation dynamics, this kind of persistent monthly outperformance is typically associated with sustained institutional reallocation rather than speculative short-term positioning.
What Drove the 36% Surge: A Commodity-by-Commodity Breakdown
Gold's Enduring Role as a Safe-Haven Asset in Volatile Markets
Gold's performance throughout FY26 was underpinned by a familiar but intensifying set of macroeconomic conditions: geopolitical conflict in multiple regions, persistent inflationary pressures in major economies, and currency volatility that eroded confidence in traditional fiat-denominated assets. When these forces converge, institutional capital has historically rotated toward gold as a store of value, and FY26 followed this pattern with notable conviction.
What distinguishes WA's gold sector within this context is its operational scale and production diversity. The state is home to some of Australia's largest and most cost-efficient gold operations, meaning that gold producers listed on the ASX with WA-based assets were positioned to translate elevated spot prices directly into earnings growth and market capitalisation expansion. In addition, gold safe-haven demand provided a stable, high-performing foundation across the WA Index throughout the year.
It is worth noting that gold's safe-haven premium tends to be self-reinforcing during periods of sustained geopolitical instability. As prices rise, exploration spending increases, resource upgrades follow, and the market re-rates exploration-stage companies alongside producers. This creates a cascading valuation effect that amplifies returns across the entire gold-exposed segment of the WA Index, not just among established producers.
The Lithium Recovery Story: From Oversupply Trough to FY26 Standout
Lithium's trajectory entering FY26 was deeply unfavourable. The lithium oversupply downturn saw spodumene concentrate prices fall sharply from their 2022 peak, as expanded production capacity outpaced demand growth and destocking cycles rippled through battery supply chains. Several WA-listed lithium producers suspended operations or deferred capital expenditure during this period, and investor sentiment toward the sector deteriorated significantly.
The FY26 recovery therefore carried particular significance. It was not simply a price rebound from temporarily depressed levels; it reflected a broader reassessment of battery mineral fundamentals by institutional investors who had previously reduced exposure to the sector.
Key Insight: Lithium's recovery in FY26 was driven by a combination of supply rationalisation, accelerating global EV adoption, and battery supply chain restocking. Together, these forces signalled renewed institutional conviction in battery minerals as a structural growth category tied to the energy transition rather than a cyclical commodity trade.
WA's position within the global lithium supply chain is structurally unique. The Pilbara region and associated geological terrains host several of the world's largest hard-rock lithium deposits, extracting spodumene ore that is processed into lithium hydroxide for battery cathode manufacturing. Unlike brine-based lithium production in South America, hard-rock operations offer shorter development timelines and more predictable grade consistency, which matters considerably when supply chain managers are seeking reliable volume commitments from battery manufacturers.
This geological advantage meant that when sentiment toward lithium turned, WA-listed producers were among the first to benefit from renewed institutional capital allocation. The standout performance of lithium-exposed companies within the WA Index Top 20 was a direct expression of this dynamic.
Copper and Base Metals: Broad-Based Gains Beneath the Headlines
While gold and lithium commanded the most attention, copper and diversified base metals contributed meaningfully to the WA Index's overall performance. Copper's role in the energy transition narrative is well established: the metal is a critical input for electrical grid infrastructure, renewable energy systems, and electric vehicle drivetrains. As decarbonisation investment accelerated globally during FY26, forward demand projections for copper tightened, supporting price strength throughout the year.
This broad-based commodity strength created what analysts sometimes describe as a rising tide effect within the WA-listed resources universe. Companies with diversified commodity exposure benefited across multiple revenue streams simultaneously, reducing the earnings volatility that typically characterises single-commodity miners and attracting a wider pool of institutional investors seeking resource exposure with lower concentration risk.
Top Performers Inside the WA Index: Separating the Leaders from the Pack
The Lithium-Exposed Cohort That Dominated FY26 Returns
The Deloitte WA Index Top 20 was dominated by companies with significant lithium exposure, reflecting how comprehensively the sector's recovery reshaped performance rankings:
| Company | Market Cap Growth (FY26) | Primary Commodity Exposure |
|---|---|---|
| PLS Group | +277% | Lithium |
| Liontown Resources | +215% | Lithium |
| Mineral Resources (MIN) | +190% | Lithium and Iron Ore |
Note: Mineral Resources (MIN) is an ASX Top 200 constituent referenced here in that capacity.
The concentration of lithium names at the top of the performance table reveals something important about investor psychology during recovery cycles. When a commodity sector that has been deeply out of favour begins to turn, the most leveraged operators tend to experience the most dramatic re-ratings, as low valuations established during the downturn provide an amplified base for percentage gains. This leverage effect is particularly pronounced in hard-rock lithium, where production cost structures mean that relatively modest price improvements translate into substantial margin expansion.
The Breakout Stories: Small-Cap WA Companies Delivering Extraordinary Returns
Beyond the Top 20, the broader WA Index Top 100 produced a cohort of small-cap performers whose returns were genuinely extraordinary. Notably, Forrestania Resources led the charge among standout small-cap performers during the FY26 surge:
| Company | Market Cap Growth (FY26) | Index Tier |
|---|---|---|
| Forrestania Resources | +2,118% | WA Index Top 100 |
| Solstice Minerals | +1,494% | WA Index Top 100 |
| Lindian Resources | +1,406% | WA Index Top 100 |
Returns of this magnitude in small-cap resource equities are almost always attributable to a combination of low base valuations, high speculative positioning, and a specific catalytic event: an exploration discovery, a significant resource upgrade, or credible merger and acquisition speculation. The asymmetric return profile of small-cap resource stocks means that a single positive drilling result or a resource estimate upgrade can trigger a repricing event that is orders of magnitude larger than what would occur in a company with a more established production and earnings history.
⚠️ Investor Caution: Extreme percentage gains in small-cap resource equities frequently reflect very low starting valuations and elevated speculative positioning rather than fundamental earnings growth. These returns are not representative of the broader WA market and carry significantly elevated risk profiles. Past performance in this segment provides no reliable guide to future outcomes.
The $100 Billion Milestone: What Wesfarmers' Valuation Signals
Corporate Sophistication Beyond Pure-Play Mining
One of the more instructive data points embedded within the FY26 results was Wesfarmers becoming the first WA-headquartered company to achieve an individual market capitalisation of $100 billion. While Wesfarmers is not a mining company in the traditional sense, this milestone carries strategic significance for how WA's listed company landscape is understood by investors and analysts.
The emergence of a diversified industrial and retail conglomerate as WA's largest listed entity by market cap demonstrates that the state's corporate sector has developed sufficient scale and institutional sophistication to support world-class companies across multiple sectors. It also serves as a reminder that WA's economic base, while heavily influenced by resource sector performance, is not monolithic. The presence of companies like Wesfarmers at the pinnacle of the WA Index introduces a diversification element that partially insulates the state's aggregate market cap from commodity price cycles, even as resource equities continue to dominate the index's composition and growth dynamics.
M&A as a Value Creation Engine in WA's Resources Sector
Why Strategic Transactions Accelerated in FY26
Mergers and acquisitions activity was identified by Deloitte as a parallel value driver alongside commodity price appreciation in FY26. The trend towards mining industry consolidation accelerated during this period for several interconnected reasons:
-
Scale building – Elevated commodity prices gave well-capitalised operators the financial strength to pursue acquisitions that would have been unaffordable during the prior downturn cycle.
-
Portfolio diversification – Companies with single-commodity or single-asset exposure sought to reduce concentration risk by acquiring complementary assets in different commodity classes or geographies.
-
Advanced-stage asset access – Acquirers targeted development-stage projects that had reached bankable feasibility but lacked the capital to proceed independently, creating attractive value capture opportunities.
-
Defensive consolidation – Some transactions were motivated by the desire to build operational resilience ahead of anticipated cost inflation in labour, energy, and consumables.
The signalling dimension of M&A activity is also worth examining. Companies that make strategic acquisitions during rising markets are expressing long-term commodity conviction rather than opportunistic short-termism. This signals to institutional investors that management teams believe the commodity cycle has durability, which itself can attract additional capital into the sector.
The next major ASX story will hit our subscribers first
What the $494 Billion Milestone Means for WA's Economic Footprint
The Multiplier Effect Through WA's Broader Economy
A record-high resource sector market capitalisation does not exist in isolation from the real economy. The connection between listed company valuations and actual economic activity flows through several channels:
- Royalty revenues generated from production activity flow directly to the WA state government, funding public services and infrastructure programmes.
- Employment across mining operations, processing facilities, and the broader mining services sector supports tens of thousands of direct and indirect jobs in regional and metropolitan WA.
- Capital deployment into new projects and expansion programmes generates construction activity, equipment procurement, and demand for specialist engineering and technical services.
- Superannuation fund performance for everyday Australians is materially influenced by resource sector equity returns, given the significant weighting of mining companies within Australian equity allocations held by major super funds.
The WA resources sector has been operating in what industry observers have described as a decade-high investment environment, with new project commitments and expansion capital expenditure reaching levels not seen since the previous iron ore supercycle. Record market capitalisations and strong corporate balance sheets provide the financial foundation for continued capital deployment in the period ahead.
The Next Phase: What Will Sustain or Disrupt WA's Market Leadership
Four Strategic Imperatives Shaping WA's Resource Companies Beyond FY26
Industry analysis from Deloitte identified four structural priorities that will determine which WA-listed resource companies sustain their competitive positioning as market conditions evolve:
-
Decarbonisation and Emissions Reduction – Transitioning operations toward lower-emissions models is no longer purely a regulatory compliance exercise. Institutional investors with ESG mandates are increasingly excluding high-emissions operators from portfolio eligibility, making mining electrification and decarbonisation a direct driver of valuation and capital access.
-
Digital Technology and AI Integration – Deploying automation, advanced data analytics, and artificial intelligence across exploration, operations, and logistics functions is becoming a source of competitive differentiation. Companies that achieve cost reductions and safety improvements through technology will carry structural margin advantages over peers that lag in adoption.
-
Workforce Capability Development – Skills shortages in technical mining disciplines remain a persistent constraint on growth ambitions. The shift toward increasingly automated and data-driven operations creates demand for workers with different competencies than traditional mining roles required, making capability development a genuine strategic priority.
-
Operational Discipline and Diversification – Maintaining rigorous cost control through commodity price cycles while strategically diversifying exposure across assets and mineral types reduces the vulnerability to single-commodity downturns that has historically destabilised WA-listed miners.
Scenario Analysis: Three Possible Trajectories for WA's Market Cap in FY27
| Scenario | Key Assumption | Implied Outlook |
|---|---|---|
| Bull Case | Lithium prices continue recovering; gold holds above $3,000/oz; copper demand accelerates with grid investment | WA Index extends gains; potential to test $550-$600 billion range |
| Base Case | Commodity prices stabilise; M&A activity continues; EV demand grows steadily | WA Index consolidates near record levels; moderate single-digit growth |
| Bear Case | Geopolitical resolution reduces safe-haven demand; lithium oversupply returns; global recession risk intensifies | WA Index retreats from record highs; small-cap cohort most vulnerable |
Disclaimer: Scenario projections are illustrative only and do not constitute financial advice or a reliable forecast of future market outcomes. Resource equity markets are subject to significant volatility and unpredictable external variables.
Frequently Asked Questions: WA Listed Companies and the Record Market Capitalisation
What is the Deloitte WA Index and how is it calculated?
The Deloitte WA Index tracks the combined market capitalisation of companies primarily listed on the ASX with headquarters or primary operations in Western Australia. The special Diggers and Dealers edition, published annually to coincide with the Kalgoorlie mining conference, is the flagship edition of the index and provides a comprehensive full-year performance assessment of the WA-listed company universe.
Why did WA-listed companies outperform the broader ASX by such a wide margin in FY26?
The performance gap reflects five converging factors: the timing of the commodity price cycle, WA's structural concentration in resource equities, the recovery of lithium from prior-year lows, sustained gold safe-haven demand, and an acceleration in strategic M&A activity that added a structural value layer beyond price appreciation alone. Consequently, WA listed companies surge to record market capitalisation was the dominant investment story of the financial year.
Is the $494 billion figure a total for all WA-listed companies or just the top performers?
The $494.3 billion figure represents the combined market capitalisation of all WA-listed entities tracked within the Deloitte WA Index, not a subset of top performers. It is a whole-of-index measure that reflects aggregate valuation across the full cohort of qualifying companies.
How does WA's resource sector market cap growth affect everyday Australians?
The connection operates through several channels: superannuation fund returns are improved when resource equities perform strongly; state government royalty revenues increase, supporting public services; regional employment and infrastructure spending rise with project investment; and the broader supply chain for mining services, from equipment manufacturers to specialist contractors, experiences increased activity and revenue.
Key Takeaways: The Strategic Significance of WA's $494 Billion Record
- WA listed companies surge to record market capitalisation defined FY26, with a combined figure of $494.3 billion driven by multi-commodity strength.
- The 36% year-on-year gain outpaced the ASX All Ordinaries' 2.4% return by a factor of 15, reflecting a structural repricing of resource equities.
- Lithium was the standout commodity driver, recovering from multi-year price lows on the back of rising EV demand and battery supply chain restocking.
- Gold delivered sustained performance as a safe-haven asset during a period of elevated geopolitical and macroeconomic uncertainty.
- M&A activity added a structural value dimension beyond commodity price appreciation, signalling long-term sector confidence.
- The WA Index Top 100 produced extraordinary small-cap returns, with Forrestania Resources gaining over 2,000%, though these returns carry elevated risk profiles.
- Wesfarmers became the first WA-headquartered company to cross the $100 billion individual market capitalisation threshold, signalling the growing corporate sophistication of WA's listed company landscape.
- Future leadership will depend on companies successfully navigating decarbonisation, digital transformation, workforce development, and operational diversification.
For further context on Western Australia's resource sector performance and market data, readers can explore related reporting and analysis published by Australian Mining at australianmining.com.au.
Want to Position Yourself Ahead of the Next Major ASX Resource Discovery?
When commodity cycles align as they did in FY26, the investors who capture the most significant returns are often those who act on discovery intelligence the moment it enters the market. Discovery Alert's proprietary Discovery IQ model delivers real-time alerts on significant ASX mineral discoveries — instantly translating complex geological data into actionable insights for both short-term traders and long-term investors — and with a 14-day free trial now available, there has never been a better time to explore why historic mineral discoveries have generated some of the market's most extraordinary returns.