July 30, 2026
Shell Second-Quarter Profit Beats Expectations by More Than $1 Billion
The global energy market has always operated in cycles, but few forces reshape those cycles as abruptly as geopolitical conflict. When military tensions escalate in oil-producing regions, integrated energy majors with diversified global portfolios tend to benefit disproportionately. Supply uncertainty feeds into futures markets, risk premiums embed themselves into forward price curves, and the downstream refining margins that underpin profitability for companies like Shell widen alongside benchmark crude prices. Understanding geopolitical oil price dynamics is essential context for interpreting what Shell has just delivered to the market.
When big ASX news breaks, our subscribers know first
A Quarter That Redefined Expectations
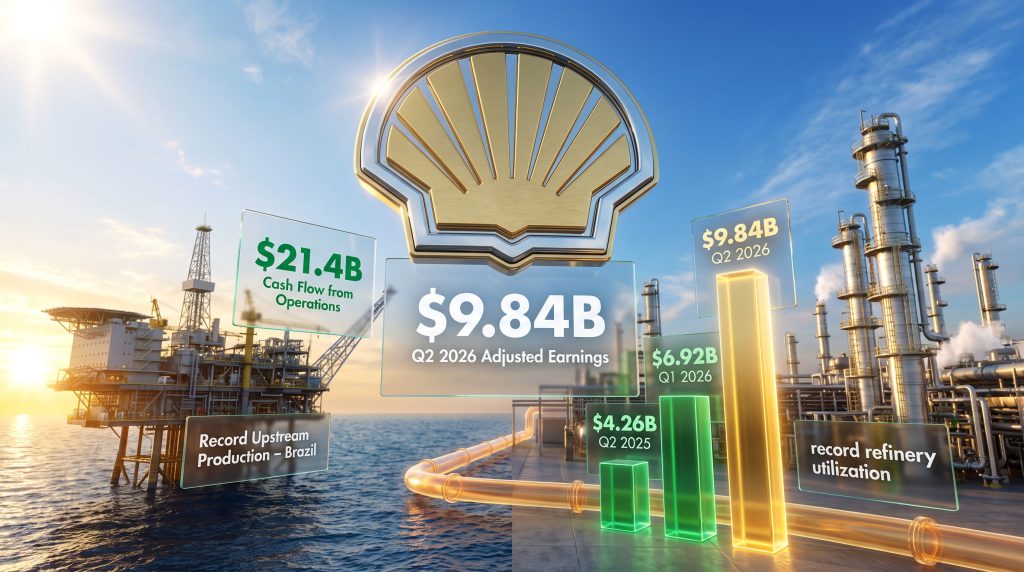
Shell's financial results for the April to June 2026 period landed well above what the market had anticipated. The company reported adjusted earnings of $9.84 billion, a figure that cleared the LSEG analyst consensus of $8.79 billion by more than a billion dollars. Even Shell's own internally circulated analyst forecast of $8.92 billion proved conservative.
The year-over-year comparison is particularly striking. Shell's adjusted earnings for the equivalent period in 2025 came in at approximately $4.26 billion, meaning the company more than doubled its profit in a single year. Compared to the $6.92 billion posted in Q1 2026, the sequential improvement is also substantial, pointing to an accelerating earnings trajectory rather than a one-off spike.
Earnings Snapshot: Q2 2026 at a Glance
| Metric | Figure |
|---|---|
| Q2 2026 Adjusted Earnings (Reported) | $9.84 billion |
| LSEG Analyst Consensus Estimate | $8.79 billion |
| Company-Provided Internal Forecast | $8.92 billion |
| Beat vs. LSEG Consensus | +$1.05 billion (+11.9%) |
| Q2 2025 Adjusted Earnings (Prior Year) | ~$4.26 billion |
| Q1 2026 Adjusted Earnings (Prior Quarter) | $6.92 billion |
| Year-Over-Year Earnings Growth | ~131% |
| Q2 2026 Cash Flow from Operations | $21.4 billion |
The magnitude of the beat against expectations is not trivial. In energy markets, where analysts model price realisations, production volumes, and refining margins simultaneously, an 11.9% beat against external consensus reflects a confluence of factors that forecasters did not fully price in. Furthermore, Shell's quarterly results reporting confirmed the strength of this performance across multiple business segments.
The Geopolitical Engine: Iran, Oil Prices, and Structural Risk Premiums
No analysis of the Shell second-quarter profit beats expectations narrative is complete without addressing the Iran conflict as a central variable. The ongoing war has introduced what energy analysts describe as a sustained geopolitical risk premium into global oil and gas markets. This differs from short-lived supply shocks, such as brief pipeline disruptions or temporary sanctions, in a structurally important way: prolonged regional conflict can embed itself into forward price curves for months, or even years.
The mechanics work as follows. When physical supply from the Middle East faces disruption risk, buyers in Europe and Asia pay up for alternative crude streams. This elevates benchmark prices across the board. Simultaneously, uncertainty about future availability encourages inventory builds, which further supports near-term demand for barrels. For an integrated major like Shell, higher realised prices across both its upstream production assets and its downstream refining operations generate a compounding earnings effect.
U.S. Central Command confirmed fresh airstrikes in the region during the quarter, describing the military action as a response to attempted Iranian attacks on American forces. This escalation dynamic, where each round of conflict reinforces the risk premium rather than resolving it, is precisely the environment in which integrated oil majors historically record their strongest quarterly results. In addition, OPEC market influence has amplified these pricing pressures by constraining supply flexibility across member nations.
Geopolitical conflict in oil-producing regions does not merely raise crude prices. It simultaneously widens refining margins, as refiners rush to secure feedstock, and elevates gas prices, as LNG becomes a preferred alternative for energy-importing nations seeking supply security away from conflict-affected pipelines.
How Geopolitical Risk Translates Into Earnings
- Higher realised crude prices across upstream production portfolios
- Wider refining margins as downstream operations benefit from spread expansion
- Elevated LNG pricing for gas-heavy producers with exposure to spot markets
- Volume premium on production from geopolitically stable regions, like Brazil's deepwater basins
- Demand acceleration from European buyers diversifying away from conflict-proximate supply chains
Operational Excellence: Not Just a Price Story
What distinguishes Shell's Q2 2026 result from a purely price-driven windfall is the operational performance that ran in parallel. Two metrics stand out as particularly significant.
Record Upstream Production in Brazil
Shell achieved record upstream production levels from its Brazilian deepwater operations during the quarter. Brazil's pre-salt basins, located in ultra-deepwater formations off the Atlantic coast, are among the most cost-competitive and prolific hydrocarbon reservoirs in the world. The geology of these formations is distinctive: a thick salt layer overlies the reservoir rock, acting as a seal that has preserved enormous volumes of oil and gas over geological time.
Production from these assets carries relatively low lifting costs once infrastructure is in place, meaning higher realisations flow more directly to the bottom line than in higher-cost producing regions. Record output from Brazil is strategically meaningful because it demonstrates that Shell's production growth is not exclusively dependent on prices. Volume growth from low-cost assets amplifies the earnings impact of favourable pricing conditions.
Peak Refinery Utilisation
Shell also reported record refinery utilisation rates during Q2 2026. In refining economics, utilisation rate is a critical efficiency metric. Higher throughput spreads fixed costs across a greater volume of refined products, lowering the per-barrel processing cost and expanding margins. When this operational efficiency coincides with elevated product crack spreads driven by geopolitical supply anxiety, the earnings contribution from the downstream segment can be substantial.
Cash Flow as the True Measure of Strength
Beyond reported earnings, Shell generated $21.4 billion in cash flow from operations during Q2 2026. This figure is arguably more informative than headline adjusted earnings because it reflects the actual cash being produced by the business after working capital movements and operational expenditures. A company generating $21.4 billion in operating cash flow in a single quarter has significant optionality: it can return capital to shareholders via buybacks and dividends, reduce debt, or reinvest in growth assets, all simultaneously.
Investors often treat operating cash flow as a more reliable indicator of financial health than adjusted earnings, which can be influenced by non-cash items, impairments, and accounting adjustments. Shell's $21.4 billion operating cash flow figure reinforces that the Q2 2026 result reflects genuine economic value creation, not accounting construction.
Shell vs. Supermajor Peers: A Relative Performance Puzzle
Despite delivering one of the most impressive single-quarter earnings results in its recent history, Shell's equity market performance in 2026 tells a more nuanced story. London-listed shares of Shell have risen approximately 21% year-to-date, a respectable gain in absolute terms. However, the company continues to trail BP, TotalEnergies, Exxon Mobil, and Chevron on relative equity market performance.
Supermajor Peer Comparison: 2026 YTD Equity Performance
| Company | Listed Market | 2026 YTD Performance vs. Shell |
|---|---|---|
| Shell (SHEL) | London Stock Exchange | Benchmark (~21% YTD) |
| BP | United Kingdom | Outperforming Shell YTD |
| TotalEnergies | France (Euronext) | Outperforming Shell YTD |
| Exxon Mobil (XOM) | New York Stock Exchange | Outperforming Shell YTD |
| Chevron (CVX) | New York Stock Exchange | Outperforming Shell YTD |
This divergence is worth examining carefully. Several factors may contribute to Shell's relative underperformance despite strong absolute earnings:
- Energy transition positioning: Shell's publicly stated commitments to net-zero targets create uncertainty for some investor segments about the long-term trajectory of its fossil fuel assets
- Portfolio complexity: Shell operates across upstream, integrated gas, downstream, chemicals, and renewables, which can make valuation harder for investors to model cleanly compared to more focused peers
- Investor base composition: London-listed stocks sometimes attract a different institutional investor profile than U.S.-listed equivalents, potentially creating a structural valuation discount
- ESG fund flows: Institutional investors with strict ESG mandates may underweight Shell relative to peers, suppressing demand for the stock even when fundamentals are strong
The gap between Shell's fundamental performance and its relative equity market positioning represents one of the more interesting analytical tensions in the energy sector right now. Consequently, energy transition pressures continue to weigh on how markets price long-term value for integrated oil majors.
Sector Implications: What Shell's Result Signals for the Energy Landscape
Shell's result does not exist in isolation. The broader energy major earnings season for Q2 2026 is expected to reflect similar tailwinds, given that BP, TotalEnergies, Exxon Mobil, and Chevron all operate across the same commodity price environment. When one integrated major reports a 131% year-over-year earnings increase, investors should treat it as a sector-level signal rather than a company-specific story.
Several broader implications deserve attention:
1. Sustainability of current earnings levels. The Iran conflict has introduced a risk premium that may persist, but commodity cycles are inherently mean-reverting. If diplomatic developments ease tension or supply routes stabilise, the geopolitical premium embedded in prices could unwind faster than earnings forecasts currently assume.
2. Capital allocation decisions. Record cash generation gives energy majors genuine strategic flexibility. Whether companies prioritise shareholder returns, debt reduction, or reinvestment in new production will define their relative positioning through the next phase of the commodity cycle.
3. The energy transition narrative tension. Record profits generated during a geopolitically-driven fossil fuel price surge create a visible contradiction for companies publicly committed to decarbonisation timelines. This tension is not merely reputational. It influences how institutional capital is allocated, how regulatory frameworks develop, and how long-term investors model terminal value for fossil fuel assets.
4. LNG as a strategic asset. Shell's integrated gas division, which includes a substantial LNG portfolio, benefits disproportionately when geopolitical uncertainty drives European and Asian buyers toward long-term supply security contracts. The global LNG supply outlook suggests that pricing in this environment can significantly exceed oil-indexed benchmarks, and Shell's profit beat has drawn considerable attention from analysts focused on this segment.
Disclaimer: This article contains forward-looking statements and financial analysis based on publicly reported information. Past earnings performance is not indicative of future results. Readers should conduct their own due diligence before making investment decisions. Commodity prices are inherently volatile and subject to rapid change based on geopolitical, macroeconomic, and operational factors.
The next major ASX story will hit our subscribers first
Frequently Asked Questions: Shell Q2 2026 Earnings
What were Shell's adjusted earnings for Q2 2026?
Shell reported adjusted earnings of $9.84 billion for the second quarter of 2026, covering the April to June period. This exceeded the LSEG analyst consensus of $8.79 billion and the company's own internal forecast of $8.92 billion.
Why did Shell's profits more than double year-over-year?
Shell's Q2 2025 adjusted earnings were approximately $4.26 billion. The near-doubling to $9.84 billion in Q2 2026 reflects a combination of significantly elevated oil and gas prices driven by the Middle East conflict, record upstream production from Brazilian deepwater assets, and peak refinery utilisation rates.
How much operating cash flow did Shell generate in Q2 2026?
Shell generated $21.4 billion in cash flow from operations during the quarter, underscoring the genuine financial strength behind the headline earnings figure.
Why does Shell lag peers despite strong earnings?
Despite a roughly 21% year-to-date share price gain, Shell continues to underperform BP, TotalEnergies, Exxon Mobil, and Chevron on equity market performance. Analysts point to factors including portfolio complexity, energy transition uncertainty, and differences in institutional investor base composition as contributing to a relative valuation gap.
What role did the Iran conflict play in Shell's earnings beat?
The Iran war has sustained an elevated geopolitical risk premium in global energy markets, lifting both crude oil and natural gas prices. Shell second-quarter profit beats expectations in large part because higher realised prices flowed across its upstream and downstream operations simultaneously, which was a primary driver of the company's outperformance against analyst forecasts.
Want to Capitalise on the Next Major Resource Discovery Before the Market Moves?
While Shell's extraordinary Q2 earnings demonstrate how geopolitical forces can rapidly reshape commodity markets, Discovery Alert's proprietary Discovery IQ model delivers real-time alerts on significant ASX mineral discoveries, instantly empowering subscribers to identify actionable opportunities ahead of the broader market — explore historic discoveries and their returns to understand the transformative potential, then begin your 14-day free trial at Discovery Alert to position yourself at the forefront of the next major find.