July 30, 2026
The Supermajor Earnings Cycle: Why Integrated Oil Giants Thrive When Multiple Variables Align
Across the long history of supermajor oil company earnings cycles, the quarters that generate the most striking results are rarely those driven by a single favourable variable. Instead, the most powerful earnings inflections occur when commodity price strength, operational execution, and geographic diversification converge simultaneously. That precise combination defined Shell's second quarter of 2026, producing a Shell Q2 profit rises on higher oil prices and record Brazil production result that caught many analysts by surprise in both its scale and its quality.
When big ASX news breaks, our subscribers know first
Why Shell's Q2 2026 Earnings Surprised to the Upside
Shell Q2 profit rises on higher oil prices and record Brazil production is the headline, but the underlying story is considerably more layered. The quarter's outperformance was not purely a function of crude prices moving higher. It was the compounding effect of three distinct forces operating in parallel across Shell's integrated business model.
The Three Converging Forces That Drove Earnings Higher
First, realised upstream prices improved materially across both liquids and natural gas benchmarks during the quarter. Higher commodity prices flow directly into upstream adjusted earnings with significant leverage, because fixed operating costs remain largely constant regardless of the prevailing price environment. When prices rise, a disproportionate share of incremental revenue converts to profit.
Second, LNG trading conditions tightened considerably during Q2 2026. Shell's integrated gas division benefits structurally from LNG market implications, because the company operates across the entire LNG value chain from liquefaction to shipping to regasification and final sale. Tighter market conditions amplify the trading margin available at each step in that chain.
Third, refining and chemicals margins improved beyond upstream tailwinds, providing an additional layer of earnings support that is frequently underappreciated when analysts focus exclusively on upstream performance.
Q2 2026 vs. Q1 2026: The Financial Acceleration in Numbers
| Metric | Q1 2026 | Q2 2026 | Change |
|---|---|---|---|
| Adjusted Earnings | $6.9 billion | $9.84 billion | +42% |
| Cash Flow from Operations | Not disclosed | $21.4 billion | Record quarter |
| Free Cash Flow | Not disclosed | $17.5 billion | Strong conversion |
| Net Debt | $52.6 billion | $41.8 billion | -$10.8 billion |
| Upstream Adjusted Earnings | $2.4 billion | $3.5 billion | +46% |
| Upstream Production | Not disclosed | 1.824 MMboed | Stable volumes |
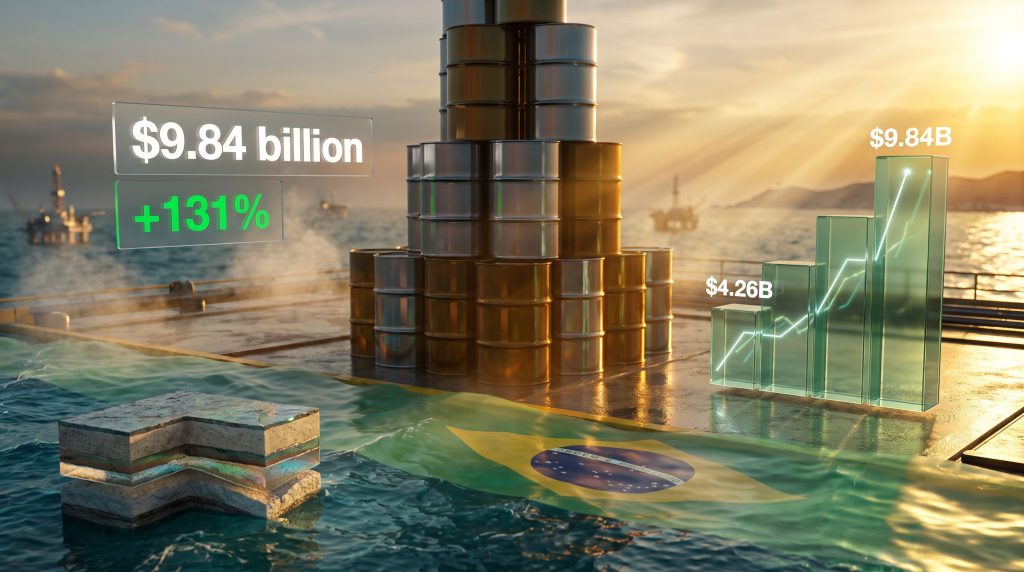
The year-over-year comparison is even more striking than the sequential improvement. Shell's Q2 2026 adjusted earnings of $9.84 billion represented more than double the $4.26 billion reported in Q2 2025, an outcome that exceeded analyst consensus forecasts and underscored the earnings leverage embedded within Shell's diversified business model.
Reuters reported that Shell's results beat expectations decisively, highlighting both the scale of the earnings surprise and the quality of underlying cash generation that supported it.
How Brazil Became the Operational Centrepiece of Shell's Q2 2026 Results
Understanding Brazil's Pre-Salt Structural Advantage
Shell's deepwater operations in Brazil achieved record upstream production volumes during Q2 2026. To understand why this matters beyond the headline, it is worth examining the geology that makes Brazil's pre-salt basin fundamentally different from most other deepwater provinces.
Brazil's pre-salt fields sit beneath a thick layer of evaporite salt, sometimes several kilometres deep, below the ocean floor of the Santos and Campos basins. This salt layer acts as an effective seal, trapping hydrocarbons in exceptionally high-quality carbonate reservoirs. The result is a set of reservoir characteristics that distinguish Brazilian pre-salt assets from most other global deepwater plays:
- High flow rates per well: Individual pre-salt wells frequently produce at rates that far exceed the average for deepwater projects elsewhere in the world, reducing the number of wells required to sustain high production volumes.
- Low water cut at maturity: Many pre-salt fields maintain relatively low proportions of produced water even as reservoirs mature, which preserves production efficiency and reduces processing costs.
- Strong reservoir energy: Natural reservoir pressure supports production without requiring as much artificial lift intervention as comparable assets in other basins.
- Low lifting costs: The combination of high per-well flow rates and reservoir quality translates into a lifting cost structure that sits at the more competitive end of Shell's global portfolio.
These structural geological advantages mean that during periods of elevated oil prices, Brazilian pre-salt barrels carry exceptional earnings leverage. More volume at lower unit cost, realised at higher prices, creates a compounding financial effect that is disproportionately powerful relative to the absolute volume numbers. Furthermore, understanding the broader crude oil price trends helps contextualise why Brazil's record output proved so impactful during this particular quarter.
The Strategic Significance of a Record Production Quarter
Record production in Brazil during Q2 2026 was not merely an operational milestone. It functioned as a partial offset to disruptions elsewhere in Shell's portfolio, particularly in the Middle East. This geographic earnings substitution is a feature of diversified supermajor business models that is rarely modelled explicitly by investors but becomes highly visible in quarters like Q2 2026.
When a single high-quality asset base achieves record output precisely during a quarter when other portfolio regions underperform, the earnings resilience of a geographically diversified production footprint becomes empirically observable rather than theoretically asserted.
The Middle East Disruption Factor: What Offset the Gains
Operational Outages and Their Earnings Footprint
Shell acknowledged that its Middle Eastern operations, including activities connected to its Qatar-linked LNG interests, experienced reduced output and sales volumes during Q2 2026. The company's own characterisation of Q2 2026 described it as a period of significant disruption across global energy markets, positioning the quarterly results as a demonstration of resilience rather than a benign windfall.
This framing is analytically meaningful. It suggests that without Middle East disruptions, Shell's already-exceptional quarterly numbers could have been even stronger. Consequently, any normalisation of Middle Eastern output in subsequent quarters represents a potential upside catalyst for Shell's production volumes.
Diversification as a Financial Hedge
Shell's production footprint spans the North Sea, Gulf of Mexico, deepwater Brazil, Southeast Asia, Australia, and the Middle East. This geographic spread is not accidental. It is the product of decades of portfolio construction designed to ensure that no single regional disruption can materially impair consolidated earnings. The Brazil-Middle East dynamic in Q2 2026 illustrated precisely this design principle in practice.
Shell's Cash Generation Quality: More Than Just Big Numbers
Breaking Down the $21.4 Billion Cash Flow Quarter
Large headline cash flow numbers from oil majors can sometimes mask underlying quality issues, such as temporary working capital movements or asset sales that inflate reported cash generation. Shell's Q2 2026 cash flow profile warrants closer examination on exactly this basis.
- Operating cash flow of $21.4 billion was supported by both higher commodity realisations and a $3.4 billion working capital inflow. The working capital contribution is a one-time tailwind that should be noted when assessing the sustainability of the cash generation rate.
- Free cash flow of $17.5 billion represents an approximately 82% conversion rate from operating cash flow, a figure that signals disciplined capital expenditure management and genuine operational cash generation.
- Net debt reduction of $10.8 billion in a single quarter, bringing total net debt from $52.6 billion to $41.8 billion, is a balance sheet improvement of a scale and pace that is exceptional even by supermajor standards.
A net debt reduction of nearly $11 billion within 90 days reflects not just earnings strength but the efficiency with which those earnings converted into actual cash on the balance sheet. This distinction matters: earnings can be influenced by accounting treatments, but cash is concrete.
What the Free Cash Flow Conversion Rate Tells Investors
An 82% free cash flow conversion rate is a high-quality signal for several reasons. It indicates that:
- Capital expenditure is being managed within disciplined parameters rather than expanding to consume earnings growth.
- Earnings are not being inflated by non-cash accounting items that reduce the conversion to actual cash.
- Working capital management is functioning effectively, even accounting for the $3.4 billion inflow that partially supported the operating cash flow figure.
Shell's 19-Quarter Buyback Streak: What It Signals About Management Confidence
The Mechanics of Sustained Capital Returns
Shell announced a new $3 billion share repurchase program alongside its Q2 2026 results, extending an unbroken commitment to shareholder capital returns to 19 consecutive quarters. Over the preceding 12-month period, Shell returned 44% of cash flow from operations to shareholders through the combined mechanism of buybacks and dividends.
| Return Metric | Value |
|---|---|
| Q2 2026 Buyback Announced | $3 billion |
| Consecutive Quarters of $3B+ Buybacks | 19 |
| Shareholder Return as % of CFFO (12 months) | 44% |
The significance of a 19-quarter streak is not simply its duration. It is the fact that this commitment has been maintained through varying commodity price environments, including periods of significantly lower oil prices than those prevailing in Q2 2026. This consistency reframes the buyback program as a structural feature of Shell's capital allocation policy rather than an opportunistic distribution of windfall profits.
From an investor psychology perspective, the sustained buyback commitment reduces share count progressively, creating an earnings-per-share accretion dynamic that compounds over time independently of commodity price movements. This mechanical EPS tailwind is frequently underweighted by investors who focus primarily on absolute earnings rather than per-share metrics. The Guardian noted that Shell's profits more than doubled as oil and gas prices surged, reinforcing the scale of the company's capital return capacity.
The next major ASX story will hit our subscribers first
ARC Resources: The Acquisition That Reshapes Shell's Production Growth Trajectory
Deal Status and What It Delivers
Shell's acquisition of ARC Resources received shareholder approval and is expected to formally close during the third quarter of 2026. The transaction is projected to lift Shell's compound annual production growth rate to approximately 4% through 2030, measured against 2025 baseline production levels.
To contextualise that growth rate: sustaining 4% compound annual growth on a production base of approximately 1.824 MMboed requires adding meaningful incremental volumes every year. For a company of Shell's scale, achieving this organically would be extraordinarily capital-intensive. The ARC Resources acquisition provides a defined, transactional pathway to the target.
What ARC Resources Specifically Adds
- Canadian natural gas production: Diversifies Shell's upstream mix beyond oil-weighted assets, adding gas volumes with direct linkage to LNG export opportunities.
- LNG feedstock optionality: Canadian natural gas production positions Shell to supply future LNG projects targeting Asian demand growth markets, where long-term contracted LNG demand continues to expand.
- Production growth visibility through 2030: The acquisition creates a credible, externally validated production growth pathway that investors can model with reasonable confidence, which typically attracts valuation premium relative to peers dependent on organic exploration for growth.
A 4% compound annual production growth rate through 2030 is a strategically significant commitment for a supermajor. It implies that Shell's management views current commodity conditions and balance sheet strength as sufficient to absorb acquisition integration costs while simultaneously sustaining its capital return program.
Benchmarking Shell's Q2 2026 Results Against the Supermajor Landscape
Key Performance Indicators in Context
| Indicator | Q2 2026 Value | Significance |
|---|---|---|
| Adjusted Earnings YoY Growth | +131% | Reflects price and volume leverage simultaneously |
| FCF Conversion Rate | ~82% | High earnings quality indicator |
| Net Debt Reduction (Single Quarter) | $10.8 billion | Exceptional balance sheet velocity |
| Shareholder Return Rate (12 months) | 44% of CFFO | Durable capital discipline across cycles |
| Upstream Production | 1.824 MMboed | Stable with record Brazil contribution |
Shell's adjusted earnings of $9.84 billion for Q2 2026 place the company's quarterly result among the strongest reported by any European-headquartered energy major in recent memory. The year-over-year earnings growth of approximately 131% reflects the simultaneous benefit of improved commodity prices and operational execution. In addition, monitoring WTI and Brent futures reveals how benchmark pricing dynamics directly fed into Shell's upstream realisation gains during the period.
FAQ: Shell Q2 2026 Earnings and Brazil Production
What were Shell's adjusted earnings for Q2 2026?
Shell reported adjusted earnings of $9.84 billion for the second quarter of 2026, more than doubling the $4.26 billion recorded in Q2 2025 and exceeding analyst expectations by a meaningful margin.
Why did Shell's profit rise so sharply in Q2 2026?
The primary drivers included higher realised crude and natural gas prices, stronger LNG and oil trading margins, improved chemicals performance, and record upstream production from Shell's Brazilian deepwater operations. Gains were partially offset by operational disruptions affecting Middle Eastern output.
What made Brazil's production record significant?
Brazil's pre-salt reservoirs combine high per-well flow rates, low lifting costs, and strong natural reservoir pressure. Achieving record production from this asset base during a quarter of elevated oil prices created a disproportionate earnings amplification effect relative to the volume increase itself.
How much cash did Shell generate in Q2 2026?
Shell generated $21.4 billion in cash flow from operations and $17.5 billion in free cash flow during Q2 2026. Net debt fell by approximately $10.8 billion over the quarter, reaching $41.8 billion at quarter end.
What will the ARC Resources acquisition deliver for Shell?
Following shareholder approval, the ARC Resources deal is expected to close in Q3 2026 and accelerate Shell's compound annual production growth rate to approximately 4% through 2030, anchored by Canadian natural gas and LNG-linked production capacity.
How long has Shell sustained its share buyback program?
Shell has committed to at least $3 billion in share repurchases for 19 consecutive quarters, returning 44% of cash flow from operations to shareholders over the past 12 months through a combination of buybacks and dividends.
Key Takeaways: What Shell's Q2 2026 Results Mean for Investors
Shell Q2 profit rises on higher oil prices and record Brazil production is, however, more than a single-quarter story. It reflects the structural design of an integrated supermajor built to capture earnings across multiple vectors simultaneously. Several conclusions stand out for investors and industry observers:
- Earnings quality matters as much as earnings size. The 82% FCF conversion rate and the $10.8 billion debt reduction confirm that Shell's $9.84 billion adjusted earnings figure reflects genuine cash generation rather than accounting amplification.
- Geographic diversification has measurable financial value. The Brazil-Middle East dynamic in Q2 2026 made tangible a benefit that often remains theoretical in portfolio diversification discussions.
- Pre-salt geology creates structural earnings leverage. The combination of high flow rates, low lifting costs, and strong reservoir pressure makes Brazilian deepwater assets uniquely powerful in high-price environments.
- The buyback streak carries strategic information. Nineteen consecutive quarters of $3 billion or more in repurchases signals management confidence in the durability of cash generation across commodity cycles, not just in periods of price strength.
- ARC Resources reframes Shell's growth narrative. Moving from a company managing production decline to one targeting 4% compound annual growth through 2030 represents a meaningful strategic repositioning. Furthermore, the global crude steel outlook and broader industrial demand trends provide additional context for understanding the macro environment underpinning energy commodity strength this cycle.
- Understanding commodity prices and company performance across the resources sector helps investors appreciate why Shell's results carry implications well beyond the oil majors themselves.
Disclaimer: This article is intended for informational purposes only and does not constitute financial or investment advice. Forecasts, production targets, and financial projections referenced herein are forward-looking and subject to material risks and uncertainties. Readers should conduct their own due diligence before making investment decisions.
Want to Spot the Next Major Resource Discovery Before the Broader Market Does?
While supermajors like Shell capture headlines with billion-dollar earnings cycles, some of the most compelling opportunities in the resources sector emerge from significant mineral discoveries on the ASX — and timing is everything. Discovery Alert's proprietary Discovery IQ model delivers real-time alerts the moment major ASX mineral discoveries are announced, turning complex data across more than 30 commodities into clear, actionable insights for both traders and long-term investors. Explore historic discoveries and their returns to understand the scale of opportunity, then start your 14-day free trial at Discovery Alert to position yourself ahead of the market.