May 11, 2026
India's Steel Sector Is Rewriting Its Growth Story From the Ground Up
For decades, India's steel industry operated primarily as a volume game, where scale and tonnage defined competitive advantage. That logic is rapidly giving way to something more sophisticated. Across the country's mid-tier integrated metal producers, the strategic calculus is shifting toward product differentiation, downstream integration, and margin-led growth. Companies that once competed purely on commodity output are now investing aggressively in speciality grades, value-added processing, and application-specific products. Within this structural transition, Shyam Metalics Q4 profit rises and expansion strategy narrative offers a revealing case study in how India's steel sector is being rewritten at an operational level.
When big ASX news breaks, our subscribers know first
Breaking Down Q4 FY26: The Numbers Behind the Growth
A Quarter That Outperformed the Full-Year Average
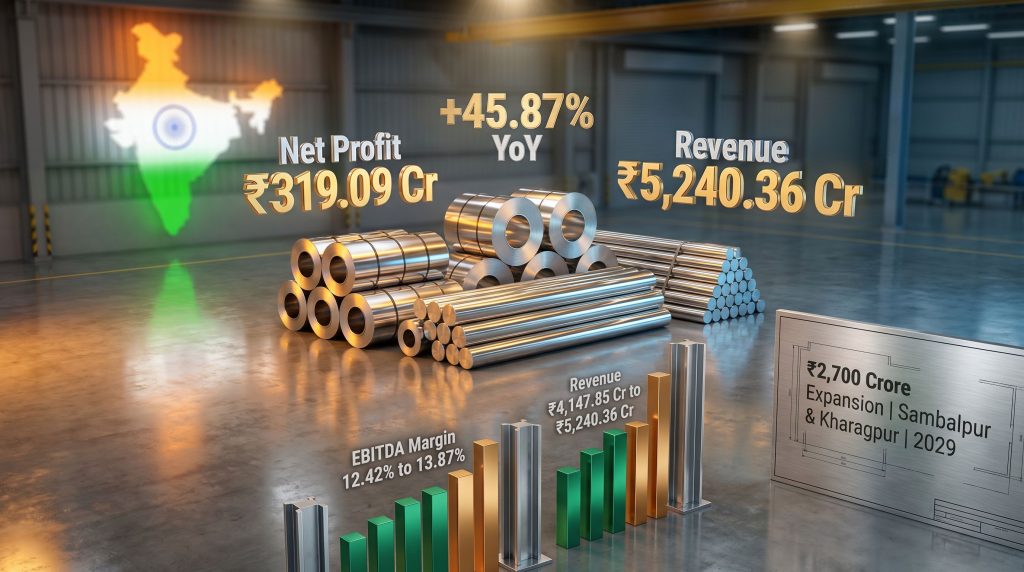
The financial results for the quarter ended March 31, 2026 demonstrated a level of acceleration that meaningfully outpaced Shyam Metalics' own full-year trajectory. Revenue from operations reached ₹5,240 crore (approximately USD 550 million), representing 27% year-on-year growth from ₹4,147.85 crore in the same quarter of the prior year.
Profit after tax climbed to ₹312 crore (₹3.12 billion, USD 32.7 million), reflecting 42% year-on-year growth from the Q4 FY25 base of approximately ₹220 crore. EBITDA expanded 33% to ₹756 crore (₹7.56 billion, USD 79.3 million), while operating EBITDA surged 41% to ₹727 crore (₹7.27 billion, USD 76.3 million), per reporting by AL Circle dated May 11, 2026.
The table below summarises the key Q4 FY26 financial metrics against prior year comparisons:
| Metric | Q4 FY26 | Q4 FY25 | YoY Change |
|---|---|---|---|
| Revenue from Operations | ₹5,240 crore | ₹4,147.85 crore | +27% |
| EBITDA | ₹756 crore | ~₹569 crore | +33% |
| Operating EBITDA | ₹727 crore | ~₹515 crore | +41% |
| Profit After Tax (PAT) | ₹312 crore | ~₹220 crore | +42% |
| Sales Volume Growth | +22% YoY | — | — |
Disclaimer: Minor variations in reported figures may exist across different financial data providers due to rounding conventions and EBITDA definition differences. Investors should verify all figures against official BSE/NSE exchange filings and audited financial statements before making investment decisions.
What Actually Drove the 42% Profit Surge
The profit expansion significantly outpaced revenue growth, and understanding why requires disaggregating several contributing factors. Furthermore, the gap between revenue and profit growth reveals important structural dynamics:
- Volume as the revenue engine: Sales volumes grew 22% year-on-year, meaning roughly 22 of the 27 percentage points of revenue growth came from pure volume expansion rather than pricing
- Per-tonne realization improvements across segments: The aluminium foil business recorded the strongest pricing improvement at +16.1% per tonne, followed by speciality alloys at +8.9% and carbon steel at +3.1%
- Operating leverage amplification: Fixed costs were absorbed across a substantially larger revenue base, creating a mechanical profit expansion that exceeded topline growth by a wide margin
- Product mix enrichment: The progressive shift toward higher-specification products improved blended margins without requiring proportionate input cost increases
The gap between the 27% revenue growth rate and the 42% profit growth rate is not coincidental. It reflects a company operating well past its fixed-cost break-even threshold, where incremental revenue flows disproportionately to the bottom line. This phenomenon, commonly referred to as operating leverage, is a defining characteristic of industrial businesses during their capacity utilisation ramp-up phase.
Segment Realisation Analysis: Where Pricing Power Is Concentrated
| Segment | Per-Tonne Realisation Change (Q4 FY26) | Strategic Significance |
|---|---|---|
| Aluminium Foil | +16.1% | Highest pricing power; premium packaging demand |
| Speciality Alloys | +8.9% | Growing industrial and automotive demand pull |
| Carbon Steel | +3.1% | Infrastructure-linked; lower but resilient uplift |
The aluminium segment's 16.1% realisation improvement deserves particular attention. Aluminium foil pricing in India is influenced by a combination of global LME aluminium prices, domestic processing premiums, and end-market demand from pharmaceutical packaging, food processing, and industrial insulation sectors. Consequently, a 16.1% per-tonne gain in a single quarter suggests that at least part of this improvement reflects favourable market conditions that may not persist indefinitely — a consideration investors should factor into forward earnings expectations.
Full-Year FY26 Context: Reading the Annual vs. Quarterly Divergence
Annual Performance Summary
| Metric | FY26 | FY25 | YoY Change |
|---|---|---|---|
| Net Profit (PAT) | ₹1,060.17 crore | ~₹908.4 crore | +16.6% |
| Revenue from Operations | ₹18,552.21 crore | ~₹15,157 crore | +22.39% |
The full-year figures reveal an important structural dynamic. Revenue grew 22.39% across FY26, yet net profit expanded at only 16.6%, implying that profitability growth lagged revenue growth for most of the year before recovering sharply in Q4. This back-loaded performance pattern carries meaningful implications:
- H1 margin compression: The full-year profit-to-revenue growth gap suggests that earlier quarters experienced input cost pressures or weaker realisation environments that compressed margins below Q4 levels
- Operational improvements gained traction in H2: Process efficiencies, product mix improvements, and cost reduction initiatives likely required several months before delivering measurable financial impact
- Q4 as a new profitability benchmark: The Q4 EBITDA performance establishes a higher reference point for analyst modelling of FY27 earnings, provided the conditions underpinning Q4 results remain broadly intact
A useful way to frame this is through quarterly profit contribution. If total FY26 profit was approximately ₹1,060 crore and Q4 contributed roughly ₹312 crore, then the first three quarters collectively generated around ₹748 crore. Q4 therefore represented approximately 29–30% of annual profit despite constituting 25% of the annual revenue period, confirming that Q4 was structurally the strongest quarter of the year.
Note: Forward projections and full-year estimates referenced in this article are based on reported financial data and publicly available industry analysis. They do not constitute financial advice. Past performance is not indicative of future results.
The ₹2,700 Crore Expansion Blueprint: Architecture of a Strategic Pivot
Capital Deployment Across Two Strategic Pillars
Shyam Metalics' board approved a capital expenditure programme of ₹2,700 crore (₹27 billion, approximately USD 283.6 million) targeted at high-margin, application-specific products. This programme sits within a broader existing capex pipeline, as shown below:
| Capex Category | Amount (₹ Crore) |
|---|---|
| Existing Capex Pipeline (Total) | 16,060 |
| Already Invested to Date | 8,700 |
| Newly Approved Expansion | 2,700 |
| Funding Source | Internal Accruals Only |
The newly approved ₹2,700 crore is split across two primary investment areas:
Pillar One: Special Bar Quality (SBQ) and Speciality Wire Rod/Bar Mill
- Investment allocated: ₹900 crore (33.3% of new capex)
- Targeted capacity: 800,000 tonnes per annum
- Location: Sambalpur, Odisha
- End markets: Automotive manufacturing, precision engineering, fasteners, and infrastructure construction
- Strategic rationale: SBQ steel is a critical input for high-stress automotive components including axles, crankshafts, transmission parts, and suspension systems
Pillar Two: Stainless Steel Downstream Expansion
- Investment allocated: ₹1,800 crore (66.7% of new capex)
- Locations: Kharagpur, West Bengal and Pakuria upgrades
- Programme scale: Part of a cumulative stainless steel investment totalling ₹28,300 crore
- Projected capacity change: Sixfold expansion over the programme lifecycle
- Timeline: 2029 completion target for the current tranche
The two-thirds weighting toward stainless steel reflects management's conviction that downstream stainless steel processing offers superior long-term margin profiles compared to carbon steel or commodity grades. Stainless steel commands significant premiums over ordinary steel, particularly in medical equipment, food processing, coastal infrastructure, and speciality industrial applications where corrosion resistance is non-negotiable.
Why Zero Debt Financing Matters More Than It Appears
The commitment to fund the entire ₹2,700 crore programme through internal accruals is strategically significant and often underappreciated in headline analysis. Consider the implications:
- Balance sheet preservation: No incremental debt means the company retains financial flexibility to respond to acquisition opportunities, dividend growth, or market downturns without leverage-induced constraints
- Interest cost avoidance: At prevailing corporate borrowing rates in India (typically 8–10% for investment-grade credits), ₹2,700 crore of avoided debt translates into roughly ₹216–270 crore of annual interest savings
- Peer differentiation: Several mid-tier Indian steel producers carry significant debt loads accumulated from prior expansion cycles. Shyam Metalics' debt-free capex model consequently represents a structural competitive advantage during industry downturns
- Implied confidence in cash generation: Funding ₹2,700 crore over approximately three years requires approximately ₹900 crore of annual capex from internal cash generation. Against FY26 net profit of ₹1,060 crore, this is achievable but leaves limited margin for error
Why Shyam Metalics Is Betting on Premiumisation: The Broader Industry Context
India's Structural Steel Demand Drivers
India's steel consumption growth story operates across several distinct demand vectors that are simultaneously active. The global steel outlook provides important context for understanding how domestic dynamics interact with international market forces:
- Infrastructure investment cycle: Roads, railways, ports, airports, and urban transit projects collectively represent a multi-decade demand source for construction-grade steel
- Automotive sector evolution: India's passenger vehicle and commercial vehicle markets are growing while simultaneously transitioning toward components requiring higher-specification steel grades
- Manufacturing expansion: The electronics, defence, and capital goods sectors are scaling domestic production capacity, creating demand for precision and speciality alloys
- Import substitution dynamics: India currently imports significant volumes of high-grade SBQ steel and speciality stainless products, creating domestic supply gaps that new capacity can address
However, it is also worth noting how Indian steel prices interact with these demand dynamics, as realisation levels across segments directly influence the economic case for domestic capacity expansion.
The SBQ Steel Opportunity: An Underappreciated Market Dynamic
Special Bar Quality steel represents one of the less widely understood but strategically important segments within India's steel landscape. Unlike commodity long steel products, SBQ steel requires:
- Tightly controlled chemical compositions with precise alloying element concentrations
- Stringent cleanliness standards to minimise non-metallic inclusions that create stress concentration points
- Controlled rolling and cooling processes that develop specific microstructural properties
- Rigorous testing protocols including ultrasonic inspection and mechanical property verification
These process requirements mean that SBQ production commands both a significant per-tonne premium and a competitive moat. India's automotive OEMs have historically sourced SBQ grades from established domestic producers and importers. A new 800,000 tonne per annum facility at Sambalpur would position Shyam Metalics as a meaningful participant in this market, provided quality certifications from major automotive customers are secured during the commissioning phase.
Stainless Steel Downstream: The Sixfold Capacity Ambition
The projected sixfold expansion in stainless steel capacity is an ambitious target that requires careful contextualisation. Stainless steel consumption in India has grown significantly over the past decade, driven by:
- Rising disposable incomes increasing demand for consumer durables (cookware, cutlery, appliances)
- Healthcare infrastructure expansion requiring medical-grade stainless applications
- Food processing industry growth demanding hygienic, corrosion-resistant equipment
- Coastal and marine infrastructure requiring corrosion-resistant structural materials
India remains a net importer of several stainless steel grades, particularly austenitic grades used in industrial and medical applications. In addition, the dynamics shaping China steel and iron ore markets are influencing global stainless feedstock pricing, creating further strategic impetus for domestic capacity expansion. Domestic capacity growth directly addresses this import dependence whilst capturing value-added processing margins that currently accrue to overseas producers.
Key Risk Factors: What Investors Should Monitor Closely
Execution and Regulatory Risk
Large-scale industrial expansion across multiple geographies carries inherent execution risk. Specific considerations include:
- Construction timelines for the Sambalpur greenfield SBQ facility involve land acquisition finalisation, equipment procurement lead times (specialised steel mill equipment often requires 18–24 month manufacturing lead times from suppliers), and civil construction
- Environmental clearance processes at state and central levels for new industrial facilities in India can extend timelines beyond initial projections
- Brownfield expansion at Kharagpur and Pakuria involves coordinating construction activity alongside live production operations, creating scheduling complexity
Commodity Price and Margin Sustainability
Several of the Q4 FY26 margin drivers may face headwinds. Furthermore, the evolving landscape of green steel pricing adds another layer of complexity, as producers increasingly face questions about their long-term cost structures relative to lower-emissions alternatives:
- The 16.1% aluminium realisation improvement is partly linked to global LME aluminium pricing and domestic demand conditions. Softening in either could compress this margin contribution in subsequent quarters
- Coking coal and iron ore remain the primary input cost variables for integrated steel producers. Global coal markets are influenced by geopolitical factors, weather events, and energy transition policies that remain unpredictable
- The gap between the Q4 FY26 EBITDA performance and the full-year average margin suggests that Q4 may represent a cyclical high point rather than a normalised run-rate
Competitive Intensity in Speciality Segments
Speciality steel markets in India are becoming increasingly contested. Moreover, steel tariff impacts from major economies are reshaping global trade flows, with potential knock-on effects for Indian producers targeting export markets:
- Established large-scale producers possess existing customer relationships, quality certification histories, and brand recognition in SBQ and stainless steel segments
- Automotive OEM qualification processes for new steel suppliers typically require 12–18 months of testing and validation before volume supply contracts are awarded
- Export market entry for speciality steel carries currency risk, logistics cost challenges, and international quality certification requirements that may extend the timeline to market
The next major ASX story will hit our subscribers first
Frequently Asked Questions: Shyam Metalics Q4 FY26 Performance
What was Shyam Metalics' net profit in Q4 FY26?
Shyam Metalics reported a consolidated profit after tax of ₹312 crore (₹3.12 billion, USD 32.7 million) in Q4 FY26, representing 42% year-on-year growth compared to Q4 FY25, according to reporting by AL Circle dated May 11, 2026.
What revenue did Shyam Metalics report for Q4 FY26?
Revenue from operations reached ₹5,240 crore (₹52.40 billion, USD 550 million) in Q4 FY26, reflecting 27% year-on-year growth from ₹4,147.85 crore in Q4 FY25.
What is the ₹2,700 crore capex plan targeting?
The capital expenditure programme covers two main areas: an 800,000 tonne per annum SBQ and speciality wire rod/bar mill facility at Sambalpur, Odisha (₹900 crore), and a major stainless steel downstream expansion at Kharagpur, West Bengal (₹1,800 crore), with the full programme funded entirely through internal accruals and a 2029 completion target.
How did EBITDA perform in Q4 FY26?
EBITDA reached ₹756 crore in Q4 FY26, representing 33% year-on-year growth, while operating EBITDA grew 41% to ₹727 crore over the same period.
Which segment showed the strongest realisation improvement?
The aluminium foil segment recorded the highest per-tonne realisation improvement at 16.1%, followed by speciality alloys at 8.9% and carbon steel at 3.1%.
Is the expansion funded by debt?
The entire ₹2,700 crore capex programme is planned to be financed exclusively through internal cash generation, with no new debt anticipated.
What the Q4 Performance Signals for FY27 and the Long-Term Investment Thesis
Forward Indicators Worth Tracking
Several data points from Q4 FY26 will serve as meaningful benchmarks for evaluating FY27 performance. In particular, the Shyam Metalics Q4 profit rises and expansion strategy story raises important questions about sustainability and execution:
- EBITDA margin trajectory: Whether the Q4 FY26 operating margin level becomes a sustainable baseline or represents a cyclical peak will depend on realisation stability, input cost behaviour, and product mix continuity through FY27
- Volume growth sustainability: The 22% Q4 FY26 volume expansion sets an elevated comparison base for Q4 FY27. Sustaining double-digit volume growth requires successful commissioning of new capacity during FY27
- Capex execution milestones: Progress updates on the Sambalpur SBQ facility and Kharagpur stainless expansion through FY27 will provide the clearest signal of management's delivery capability on its strategic commitments
- Automotive sector qualification progress: Announcements of OEM supply agreements or quality certifications for SBQ products would represent meaningful de-risking of the expansion thesis
The Long-Term Structural Argument
Shyam Metalics is executing a deliberate transition from volume-led commodity steel production to a margin-focused, application-specific business model. This repositioning aligns with broader structural forces reshaping India's industrial economy, including import substitution in speciality materials, domestic manufacturing capacity expansion, and the automotive sector's shift toward higher-specification component sourcing.
The combination of internally funded expansion, improving product mix realisations, and growing alignment with India's infrastructure and manufacturing cycles creates a multi-year growth framework. Whether that framework delivers sustained shareholder value will ultimately depend on two variables that remain uncertain: the pace of execution on committed capital projects, and the durability of the commodity and realisation conditions that made Shyam Metalics Q4 profit rises and expansion strategy results so compelling.
This article is intended for informational purposes only and does not constitute financial advice or a recommendation to buy, sell, or hold any securities. All financial figures are drawn from publicly reported data and industry sources. Investors should conduct independent due diligence and consult qualified financial advisors before making investment decisions.
Want to Spot the Next Major ASX Mineral Discovery Before the Market Does?
Discovery Alert's proprietary Discovery IQ model delivers real-time alerts on significant ASX mineral discoveries, transforming complex geological data into actionable investment insights for both short-term traders and long-term investors. Explore Discovery Alert's dedicated discoveries page to understand how historic finds have generated substantial returns, and begin your 14-day free trial today to position yourself ahead of the broader market.