June 20, 2026
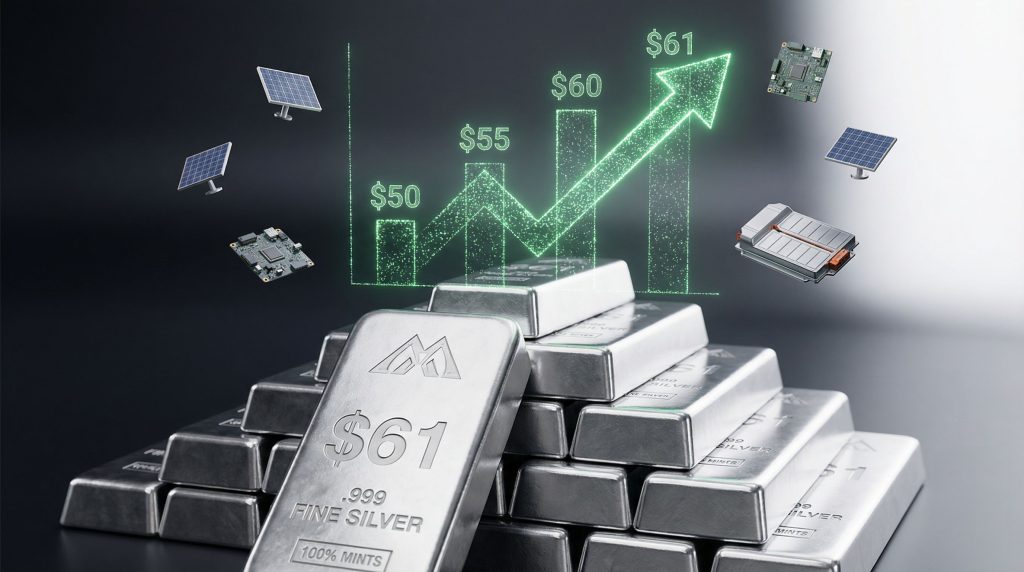
What Does Silver's Historic $61 Breakthrough Signal for Precious Metals Investors?
Market dynamics in precious metals rarely unfold with such dramatic precision, yet the silver breakout at $61 per troy ounce represents far more than a simple price milestone. This breakthrough signals a fundamental shift in how investors perceive industrial metals within their portfolio frameworks, particularly as traditional safe-haven assets face increasing pressure from monetary policy uncertainty and geopolitical tensions.
The convergence of multiple technical and fundamental factors has created what analysts describe as a perfect storm for silver appreciation. Unlike previous precious metals rallies driven primarily by currency debasement fears, this movement demonstrates remarkable independence from dollar strength cycles, suggesting deeper structural changes within global commodity markets.
However, the silver market squeeze that contributed to this breakthrough presents broader implications for financial markets beyond precious metals alone.
When big ASX news breaks, our subscribers know first
Understanding the Technical Foundation Behind Silver's All-Time High
Technical analysis reveals silver's breakout followed classic wedge pattern mechanics, where price compression between converging trend lines eventually forced a directional resolution. The silver breakout at $61 emerged from a triangle formation that had been building pressure since August 2024, creating what market technicians recognise as an inevitable breakout scenario.
Key resistance levels that silver overcame include:
- $48-$50 zone: Previous all-time high area from 2011
- $54 level: Secondary resistance that became support
- $58-$60 range: Final technical barrier before breakout
- $61+ territory: New price discovery zone
The breakout's authenticity is confirmed by several technical indicators. Volume expansion accompanied the price surge, while momentum oscillators reached levels not seen since the 2020-2021 precious metals rally. Most significantly, silver achieved this breakout while the Dollar Index remained relatively stable, trading sideways between 96-99 throughout the period.
Furthermore, gold-silver ratio insights reveal that the mathematical relationship between these metals has shifted dramatically, supporting silver's outperformance.
Silver's Recent Performance Timeline:
| Date | Silver Price | Notable Events |
|---|---|---|
| August 2024 | ~$30 | Triangle pattern formation begins |
| November 21, 2024 | $48 | Rally acceleration phase |
| December 10, 2024 | $62+ | Breakout confirmed above $61 |
| Current trajectory | $61+ | Bull flag consolidation |
Market Structure Changes Driving the Breakout
The structural foundation supporting silver's rally extends beyond technical patterns into fundamental supply-demand imbalances that have been building for multiple years. Industrial demand transformation has accelerated dramatically, particularly within sectors driving the digital economy expansion.
Silver's unique position as both an industrial metal and monetary asset creates dual demand streams that rarely coincide so powerfully. Current market structure reveals a five-year supply deficit that traditional mining response cannot quickly address, given that approximately 70-80% of silver production comes as a by-product of base metal mining operations.
This by-product dependency creates structural constraints that limit supply responsiveness to price signals. Unlike primary silver mines, which can adjust output based on silver prices, by-product operations prioritise their primary metal (typically copper, lead, or zinc), making silver supply relatively inelastic even during price surges.
Investment flow patterns have also shifted dramatically. Institutional buyers who previously focused primarily on gold allocation are now incorporating silver exposure through multiple channels:
- Direct physical holdings
- Exchange-traded products
- Mining company equity exposure
- Cryptocurrency platform precious metals reserves
The emergence of alternative reserve managers, including major cryptocurrency platforms using Treasury bill proceeds to accumulate precious metals, represents an entirely new demand category that didn't exist in previous metal cycles. In addition, the broader silver squeeze transformation continues reshaping how investors approach precious metals allocation.
How Strong Are the Fundamental Drivers Behind Silver's Rally?
Industrial Demand Revolution Creating Structural Shortages
The digital transformation accelerating across global economies has positioned silver as an indispensable component in multiple high-growth sectors. Unlike gold, which maintains primarily monetary and jewellery applications, silver's industrial utility spans critical infrastructure development areas.
Silver Industrial Applications Growth 2020-2025
| Sector | 2020 Demand (Moz) | 2025 Projected (Moz) | Growth Rate |
|---|---|---|---|
| Solar Panels | 98 | 165 | +68% |
| Electronics | 245 | 290 | +18% |
| EV Components | 15 | 45 | +200% |
| Data Centres | 8 | 25 | +213% |
Note: Projected figures based on current industry expansion rates and technology adoption curves. Actual demand may vary based on policy changes and technological developments.
Solar photovoltaic installations represent the largest single driver of industrial silver demand growth. Each solar panel requires approximately 20 grams of silver for conductive paste applications, with no viable substitute maintaining equivalent efficiency levels. Current renewable energy mandates globally suggest this demand will continue accelerating through 2030.
Electric vehicle adoption creates multiple silver demand streams beyond battery applications. Modern EVs contain approximately 25-50 grams of silver in various electrical systems, compared to 15-20 grams in traditional internal combustion vehicles. As EV production scales toward projected 30% market penetration by 2030, this sector alone could consume an additional 150-200 million ounces annually.
Data centre expansion, driven by artificial intelligence infrastructure requirements, presents perhaps the most explosive growth opportunity. Each server rack contains silver-bearing components across power management systems, networking equipment, and cooling infrastructure. Current AI capital expenditure trends suggest this sector could become a dominant silver consumer within five years.
Supply Constraints That Cannot Be Easily Resolved
Silver supply dynamics present unique challenges compared to other precious metals. The by-product mining structure means that approximately 70-80% of global silver production occurs as a secondary output from copper, lead, zinc, and gold mining operations.
This structure creates several supply-side constraints:
- Primary metal price dependency: Silver output fluctuates based on base metal economics rather than silver prices
- Geographic concentration: Major producing regions include Peru (22%), Mexico (17%), and China (12%)
- Grade decline: Average silver ore grades have decreased 35% over the past decade
- Capital intensity: New mine development requires $500 million to $2 billion investments
Mine development timelines further complicate supply response. From initial discovery through production, primary silver projects typically require 8-12 years, including:
- Exploration phase (2-4 years)
- Feasibility studies (2-3 years)
- Permitting process (2-4 years)
- Construction phase (2-4 years)
By-product operations face additional constraints, as their silver output cannot increase independently of primary metal production. Even if silver prices double, a copper mine's silver production remains tied to copper extraction rates and ore body characteristics.
Investment Demand Acceleration in 2024-2025
Investment demand patterns have evolved dramatically beyond traditional central bank accumulation. While central banks continue purchasing precious metals for reserve diversification, new institutional participants have emerged with different motivations and purchasing patterns.
The most significant development involves major cryptocurrency platforms and Treasury-backed stablecoin issuers using their reserve income to accumulate precious metals. These entities generate substantial cash flows from Treasury bill holdings and are systematically converting portions into physical gold and silver reserves.
Key Investment Demand Sources:
- Central banks: Continued diversification from dollar-heavy reserves
- Pension funds: Inflation hedging allocation increases
- Cryptocurrency platforms: Treasury income conversion to metals
- Retail investors: ETF and physical accumulation following gold's performance
- Family offices: Wealth preservation strategies amid currency concerns
This diversified demand base creates more stable support levels compared to previous metals rallies that depended heavily on single investor categories. The result is reduced volatility during pullbacks and more sustained upward momentum during advancement phases.
Is the $61 Level Sustainable or a Short-Term Peak?
Technical Analysis Framework for Silver's Next Move
Current technical analysis suggests that the silver breakout at $61 represents a legitimate trend change rather than a temporary spike. However, short-term consolidation appears likely as the metal digests its rapid 27% appreciation from November 21 through December 10, 2024.
The bull flag pattern forming after the initial breakout provides a framework for understanding potential price action. Bull flags typically consist of:
- Sharp upward move (August low to $61+ high)
- Sideways consolidation (current phase)
- Continuation breakout (projected future move)
Technical projections suggest a pullback toward the $54 support level would be healthy and consistent with historical silver behaviour. This level represents the previous significant resistance that should now act as support, providing an opportunity for momentum to rebuild before attempting higher levels.
Critical Technical Levels to Monitor:
- Resistance: $63-$65 (next technical barrier)
- Current support: $58-$60 (breakout level)
- Secondary support: $54 (former resistance)
- Trend line support: Ascending channel from August (currently ~$55)
The ascending trend line from August lows represents the most critical technical level. As long as silver maintains this upward-sloping support, the bull case remains intact even during pullbacks. Breaking below this trend line would signal a more significant correction might be underway.
Moreover, current tariff impacts on silver could introduce additional volatility factors that influence these technical levels.
Gold-Silver Ratio Dynamics and Market Implications
The gold-silver ratio has compressed to approximately 68-70, approaching multi-year lows that historically coincide with silver outperformance periods. This mathematical relationship provides insight into silver's relative strength and potential future performance.
According to market analysts, "Historical analysis reveals that during precious metals bull markets, the gold-silver ratio typically contracts toward the 50-60 range, suggesting silver has significant additional appreciation potential if gold maintains current levels above $4,200 per ounce."
Gold-Silver Ratio Analysis:
| Ratio Level | Gold Price | Implied Silver Price |
|---|---|---|
| 70 (current) | $4,200 | $60.00 |
| 60 (bull market target) | $4,200 | $70.00 |
| 50 (historical low) | $4,200 | $84.00 |
Mean reversion dynamics suggest that if gold maintains strength, silver could continue outperforming until the ratio reaches more typical bull market levels. This mathematical relationship provides a framework independent of silver's individual fundamentals, suggesting additional upside potential exists based purely on relative valuation metrics.
Volatility Expectations and Risk Management
Silver's inherent volatility characteristics require careful position sizing and risk management frameworks. Historical analysis shows that silver typically experiences 40-50% drawdowns even during strong bull markets, requiring investors to maintain appropriate capital reserves and emotional discipline.
Risk Management Framework:
- Position sizing: Limit silver exposure to 5-15% of portfolio
- Dollar-cost averaging: Regular purchases during pullbacks
- Stop-loss levels: Technical support breaks (trend line violations)
- Profit-taking: Systematic reduction at resistance levels
Volatility patterns suggest that silver moves in waves rather than steady appreciation. Understanding this behaviour helps investors avoid panic selling during normal corrections and prevents overextension during euphoric phases.
What Are the Strategic Investment Scenarios for Silver Above $61?
Bullish Scenario: Path to $75-$85 Silver
The bullish scenario for silver envisions continued industrial demand acceleration coinciding with persistent supply deficits and favourable monetary policy conditions. Under this framework, silver could reach $75-$85 within 12-24 months through a combination of fundamental and technical drivers.
Key Catalysts for Bullish Scenario:
- Industrial demand acceleration: AI infrastructure build-out requiring 200+ million additional ounces annually
- Supply deficit widening: By-product mine closures and grade decline limiting output growth
- Investment flow continuation: Central banks and cryptocurrency platforms maintaining accumulation
- Dollar weakness cycles: Federal Reserve policy supporting precious metals generally
Technical analysis supports this scenario through the ascending channel pattern that suggests continuation toward much higher levels. Historical precious metals bull markets demonstrate that initial breakouts often represent just the beginning phase of multi-year advancement cycles.
The gold-silver ratio compression provides mathematical support for this scenario. If gold advances toward projected levels of $7,000 by 2030 (based on historical bull market percentage gains of 550-750%), silver could reach $140+ even at conservative ratios of 50-1.
Furthermore, comprehensive gold-silver markets analysis suggests that central bank policies will continue supporting precious metals throughout this cycle.
Consolidation Scenario: $50-$65 Trading Range
The consolidation scenario anticipates that current price levels represent fair value given existing supply-demand dynamics, leading to extended sideways trading while fundamentals develop further. This outcome would involve silver trading between $50-$65 for 6-12 months.
Factors Supporting Consolidation:
- Profit-taking dynamics: Early investors securing gains after 100%+ appreciation
- Industrial buying patterns: Steady demand without acceleration
- Seasonal variations: Traditional weakness in Q1-Q2 precious metals demand
- Economic uncertainty: Recession concerns limiting speculative investment
Under this scenario, silver would establish a new base level significantly higher than previous trading ranges while allowing supply-demand fundamentals to catch up with price appreciation. Consolidation phases are typical in commodity bull markets and often precede the next major advance phase.
Risk Scenario: Factors That Could Trigger Reversals
Several risk factors could potentially reverse silver's upward momentum, requiring careful monitoring by investors maintaining exposure to the metal.
Economic recession impact presents the most significant risk to industrial demand. If AI capital expenditure slows dramatically (currently representing approximately 90% of GDP growth according to market analysis), the resulting economic contraction could reduce silver consumption across multiple sectors simultaneously.
Dollar strength cycles historically correlate with precious metals weakness, although the silver breakout at $61 occurred despite dollar stability. However, a significant dollar strengthening phase could create headwinds for all precious metals, regardless of individual supply-demand dynamics.
Speculative positioning unwinding represents another risk factor. Momentum-driven investors who entered silver positions during the rapid ascent from $48 to $61+ may exit positions quickly if technical patterns break down or if alternative opportunities emerge.
Risk Monitoring Framework:
- Economic indicators: AI capital expenditure trends and recession probability
- Currency markets: Dollar Index movements and Federal Reserve policy shifts
- Technical patterns: Trend line breaks and volume confirmation
- Sentiment measures: Speculative positioning and media coverage intensity
The next major ASX story will hit our subscribers first
How Should Investors Position for Silver's Next Phase?
Direct Silver Investment Strategies
Direct silver exposure offers the purest play on price appreciation while avoiding company-specific risks associated with mining equity investments. Multiple vehicles provide access to silver price movements with varying characteristics:
Silver Investment Vehicles:
-
Physical silver bullion and coins
- Advantages: Direct ownership, no counterparty risk, long-term store of value
- Disadvantages: Storage costs, insurance requirements, liquidity limitations
-
Silver ETFs and exchange-traded products
- Advantages: High liquidity, professional storage, easy trading
- Disadvantages: Management fees, potential tracking errors, counterparty risk
-
Silver futures and options contracts
- Advantages: Leverage availability, precise position sizing, hedging capabilities
- Disadvantages: Complexity, margin requirements, expiration dates
-
Silver streaming and royalty companies
- Advantages: Exposure to multiple mines, reduced operational risk, cash flow generation
- Disadvantages: Company-specific risks, premium valuations, limited pure silver exposure
Portfolio allocation should consider individual risk tolerance, investment timeframe, and overall precious metals exposure. Conservative investors might limit direct silver exposure to 3-5% of total portfolio value, while more aggressive investors could allocate 10-15% depending on conviction levels.
Mining Company Exposure Considerations
Silver mining companies provide leveraged exposure to silver prices while introducing operational and geological risks. The key distinction lies between primary silver producers and by-product miners, each offering different risk-reward profiles.
Primary Silver Producers offer the purest operational exposure to silver prices. These companies generate 70-90% of revenue from silver sales, creating direct correlation with silver price movements. However, primary silver mines often have higher operational costs and shorter mine lives compared to diversified operations.
By-Product Silver Miners generate silver as secondary production from base metal operations. While these companies offer more diversified revenue streams, their silver output cannot increase independently of primary metal production levels.
Geographic Diversification Considerations:
- North America: Stable jurisdictions, higher labour costs, environmental regulations
- Latin America: Major silver deposits, political risks, currency fluctuations
- Asia-Pacific: Growing markets, varying regulatory environments, infrastructure challenges
Production cost analysis remains critical for mining company evaluation. Companies with all-in sustaining costs below $18-$20 per ounce maintain healthy margins even during price pullbacks, while higher-cost producers face operational challenges during correction phases.
Portfolio Allocation Models for Precious Metals
Strategic portfolio allocation to precious metals requires balancing potential returns against volatility and correlation characteristics. Three primary allocation models serve different investor profiles:
Conservative Allocation (5-10% precious metals weighting):
- Silver: 2-3% of total portfolio
- Gold: 3-5% of total portfolio
- Mining stocks: 1-2% of total portfolio
- Focus: Wealth preservation and inflation hedging
Aggressive Growth (15-25% metals and mining exposure):
- Silver: 5-8% of total portfolio
- Gold: 5-10% of total portfolio
- Mining equities: 5-10% of total portfolio
- Focus: Capital appreciation and commodity beta exposure
Tactical Trading (Short-term momentum strategies):
- Position sizing: 10-20% of trading capital
- Timeframe: 3-6 month holding periods
- Stop-loss: Technical level breaks
- Focus: Momentum capture and technical pattern trading
Rebalancing frameworks should establish specific triggers for adjusting precious metals exposure based on performance relative to other asset classes and changes in fundamental outlook.
What Macroeconomic Factors Could Accelerate Silver's Advance?
Federal Reserve Policy Impact Assessment
Federal Reserve monetary policy decisions create significant influence over precious metals markets through multiple transmission mechanisms. Current policy frameworks suggest continued support for commodity prices, though specific implementation details matter tremendously.
Interest rate policy affects precious metals through real yield calculations. Lower nominal rates reduce the opportunity cost of holding non-yielding assets like silver, while inflationary pressures can create negative real yields that strongly favour precious metals allocation.
Policy Scenarios and Silver Impact:
- Continued rate cuts: Supportive through lower opportunity costs
- Quantitative easing expansion: Positive through currency debasement effects
- Hawkish pivot: Risk factor through higher real yields
- Balance sheet reduction: Mixed effects depending on implementation pace
The Federal Reserve's dual mandate creates potential policy conflicts during simultaneous inflation and employment challenges. If economic growth slows while inflation persists, precious metals could benefit from policy paralysis that prevents aggressive tightening measures.
Geopolitical Risk Premium in Silver Pricing
Geopolitical tensions increasingly influence precious metals pricing as investors seek alternatives to traditional reserve assets. Silver benefits from both safe-haven demand and supply chain security considerations.
Supply Chain Security Factors:
- Geographic concentration of silver mining in potentially unstable regions
- Transportation chokepoints affecting global silver distribution
- Strategic metal stockpiling by major economies
- Trade policy impacts on industrial silver flows
Military and aerospace applications create additional demand streams that are relatively price-inelastic. Defence contractors typically prioritise supply security over cost considerations, providing stable demand even during economic slowdowns.
Strategic metal considerations become increasingly important as governments recognise critical material dependencies. Silver's essential role in renewable energy and electronic systems makes it a strategic security concern for major economies pursuing energy independence.
Inflation Hedge Characteristics of Silver
Silver's inflation hedging characteristics differ from gold due to its substantial industrial component. While gold primarily responds to monetary factors, silver benefits from both monetary debasement and real economic growth that drives industrial demand.
Historical Performance During Inflationary Periods:
| Period | Silver Performance | CPI Inflation | Real Return |
|---|---|---|---|
| 1973-1980 | +2,400% | +110% | +1,100% |
| 2000-2011 | +650% | +35% | +450% |
| 2020-2024 | +120% | +25% | +75% |
Note: Historical performance data compiled from various sources. Past performance does not guarantee future results.
Silver's dual nature as both monetary and industrial metal creates unique inflation protection characteristics. During periods of economic growth with inflation, industrial demand supports prices while monetary debasement provides additional upward pressure.
Currency devaluation scenarios particularly favour silver due to its international pricing in dollars. As dollar purchasing power declines, silver prices typically rise to maintain purchasing power parity across global markets.
Frequently Asked Questions About Silver's $61 Breakout
Is Silver's Rally Sustainable Long-Term?
The sustainability of silver's advance beyond $61 depends on multiple converging factors that extend well beyond short-term technical considerations. Structural demand growth trajectory analysis suggests that industrial consumption will continue accelerating through 2030, driven by renewable energy expansion and digital infrastructure development.
Supply response timeline constraints support long-term sustainability arguments. The by-product mining structure means that silver supply cannot quickly adjust to higher prices, creating persistent deficit conditions even if demand growth moderates from current levels.
Investment thesis durability appears strong given the diversified nature of current demand sources. Unlike previous silver rallies dependent on single factors like currency fears or speculative activity, the current advance reflects multiple simultaneous demand drivers across industrial, investment, and monetary channels.
Sustainability Assessment Framework:
- Industrial demand: Accelerating through technology adoption
- Supply constraints: Structural limitations preventing quick response
- Investment demand: Diversified sources providing stable support
- Monetary factors: Central bank policies supportive of precious metals
How Does Silver Compare to Gold as an Investment?
Silver and gold serve different roles within precious metals portfolio allocation, each offering distinct risk-return characteristics and correlation patterns with broader markets.
Volatility Profile Differences:
Silver typically exhibits 2-3x the volatility of gold, creating greater potential returns but requiring more active risk management. This volatility stems from silver's smaller market size and dual industrial-monetary nature.
Industrial vs. Monetary Demand Drivers:
Gold primarily responds to monetary factors including currency weakness, inflation fears, and geopolitical tensions. Silver responds to these same factors plus industrial demand cycles, creating more complex but potentially more rewarding investment dynamics.
Liquidity and Storage Considerations:
Gold markets offer greater depth and tighter spreads for large transactions. Silver requires more physical storage space per dollar value and faces higher transaction costs for small investors. However, silver's lower absolute price makes it more accessible for smaller investment amounts.
Comparative Investment Characteristics:
| Factor | Silver | Gold |
|---|---|---|
| Volatility | High (2-3x gold) | Moderate |
| Industrial demand | 50%+ of total | 10-15% of total |
| Storage requirements | High volume/value | Low volume/value |
| Transaction costs | Higher spreads | Lower spreads |
| Accessibility | Lower absolute price | Higher absolute price |
What Price Targets Are Realistic for Silver?
Price target development for silver requires multiple analytical approaches given the metal's unique characteristics and current market dynamics.
Technical Analysis Projection Methods:
Chart pattern analysis suggests initial targets in the $75-$85 range based on the bull flag formation and historical percentage moves. The ascending channel pattern from August supports even higher long-term targets approaching $100-$120 if the trend continues.
Fundamental Valuation Models:
Supply-demand modelling indicates that persistent deficits could drive prices toward $80-$100 within 24-36 months, assuming current industrial demand growth rates continue and supply remains constrained by by-product mining limitations.
Historical Bull Market Comparison Studies:
Previous silver bull markets have achieved 300-500% appreciation from cycle lows. Applied to recent lows around $20-$25, this methodology suggests potential targets of $80-$125 during peak enthusiasm phases.
According to industry experts, "if gold reaches projected levels of $7,000 by 2030 and the gold-silver ratio compresses to historical bull market levels of 50-60, silver could trade between $115-$140 based purely on relative valuation mechanics." This analysis from Kitco News highlights the interconnected nature of precious metals markets.
Important Disclaimer: Price projections involve substantial uncertainty and should not be considered investment advice. Precious metals markets can experience significant volatility and extended periods of underperformance. All investment decisions should be based on individual circumstances and risk tolerance.
Strategic Conclusions: Navigating Silver's Post-$61 Environment
Key Monitoring Indicators for Trend Continuation
Successful navigation of silver's post-breakout environment requires systematic monitoring of specific indicators that provide early warning of trend changes or continuation confirmation.
Weekly closing levels above $60 support represent the most critical short-term indicator. Consistent closes above this level confirm the breakout's legitimacy and provide foundation for further advancement. Conversely, weekly closes below $58 would suggest the breakout might be failing.
Industrial demand data releases offer fundamental confirmation of the investment thesis. Key reports include quarterly semiconductor shipments, solar installation data, and electric vehicle production statistics. Acceleration in these sectors validates silver's industrial demand story.
Investment flow tracking mechanisms help identify whether institutional accumulation continues or begins reversing. Exchange-traded fund holdings, central bank purchase data, and cryptocurrency platform allocation announcements provide insight into evolving demand patterns.
Critical Monitoring Dashboard:
- Weekly silver closes above $60: Trend continuation signal
- Gold-silver ratio below 70: Relative strength maintenance
- Industrial demand growth >15% annually: Fundamental support
- Dollar Index stability <105: Macro environment support
- Technical trend line: Ascending channel from August lows
Risk Management Framework for Silver Exposure
Effective silver investment requires comprehensive risk management frameworks that account for the metal's inherent volatility and multiple risk factors.
Stop-Loss Placement Strategies:
Technical stop-loss levels should be placed below key support zones rather than arbitrary percentage levels. Current critical support sits at the ascending trend line from August, approximately $55 and rising weekly.
Profit-Taking Level Identification:
Systematic profit-taking at resistance levels helps capture gains while maintaining core positions. Initial targets around $75-$80 based on technical analysis, with additional targets at $100 and $120 if momentum continues.
Portfolio Rebalancing Triggers:
Establish specific triggers for adjusting silver exposure, such as:
- Reduce position by 25% if silver reaches $80 (take profits)
- Add to position if silver pulls back to $50 (support buying)
- Exit completely if weekly close below ascending trend line
- Reassess allocation if silver exceeds 20% of total portfolio value
Long-Term Outlook: Silver in the 2025-2030 Cycle
The 2025-2030 timeframe presents unprecedented opportunity for silver investors, assuming current technological and monetary trends continue developing. Structural demand growth projections suggest silver consumption could increase 50-75% over this period, driven primarily by renewable energy adoption and digital infrastructure expansion.
Structural Demand Growth Projections:
- Solar energy installations: 200% increase requiring additional 400 million ounces annually
- Electric vehicle adoption: 150% increase consuming additional 150 million ounces annually
- Data centre expansion: 300% increase requiring additional 50 million ounces annually
- 5G infrastructure: New demand category consuming 25-50 million ounces annually
Supply Response Timeline Expectations:
New primary silver mine development cannot realistically address projected demand increases within the 2025-2030 timeframe. Major projects currently in development will add approximately 100 million ounces of annual capacity, far below projected demand increases of 600+ million ounces.
By-product silver supply depends entirely on base metal mining economics and cannot increase independently of copper, lead, and zinc production levels. Current base metal supply projections suggest modest growth insufficient to meet industrial demand acceleration.
Analysis from FXStreet confirms that technical indicators support continued upward momentum for silver prices, with institutional interest remaining strong across multiple sectors.
Investment Return Scenario Modelling:
Conservative Scenario (2025-2030):
- Silver reaches $100-$120 per ounce
- Total return: 60-95% from current levels
- Annual return: 10-15% compounded
- Risk level: Moderate with normal bull market corrections
Aggressive Scenario (2025-2030):
- Silver reaches $150-$200 per ounce
- Total return: 145-225% from current levels
- Annual return: 20-25% compounded
- Risk level: High with substantial volatility periods
Risk Scenario (2025-2030):
- Economic recession reduces industrial demand significantly
- Silver returns to $40-$50 range
- Total return: -20% to -35% from current levels
- Annual return: -5% to -8% compounded
Investment Advisory Disclaimer: All projections and scenarios presented are speculative and based on current market conditions and trends. Precious metals investments carry substantial risks including price volatility, storage costs, and potential total loss of invested capital. Past performance does not guarantee future results. Investors should consult qualified financial advisors and conduct thorough due diligence before making investment decisions.
The convergence of technological advancement, monetary policy uncertainty, and supply constraints creates a potentially historic opportunity for silver investors willing to accept the associated volatility and risks. However, success requires disciplined risk management, realistic expectations, and systematic monitoring of the multiple factors driving this complex market.
Ready to Capitalise on Major Mineral Discoveries?
Discovery Alert instantly alerts investors to significant ASX mineral discoveries using its proprietary Discovery IQ model, turning complex mineral data into actionable insights. With precious metals like silver experiencing historic breakthroughs, positioning yourself ahead of the market through real-time discovery notifications becomes increasingly valuable for both short-term trading opportunities and long-term investment success.