August 20, 2026

Why Silver Supply Analysis Is Harder Than Most Investors Realise
The story of any commodity market begins not with price charts or trading volumes, but with the fundamental question of how much material actually exists and in what form it can be accessed. For silver, this question is deceptively complex. Unlike crude oil, which is extracted, refined, and consumed in a relatively linear chain, silver accumulates across centuries of mining, circulates through dozens of industrial applications, disappears into consumer products, and re-emerges through recycling channels that nobody fully monitors. Before any investor can form a credible view on silver above ground stocks and silver deficit dynamics, they must first grapple with a more uncomfortable truth: the data itself is contested, and the gap between competing methodologies is wide enough to change the entire investment thesis.
When big ASX news breaks, our subscribers know first
Understanding What a Silver Deficit Actually Means
The Mechanics of Supply and Demand in Silver Markets
A silver deficit, in its simplest form, occurs when total global demand for silver in any given year exceeds the combined volume of newly mined silver and recycled material entering the market. The shortfall is not met by conjuring new silver from thin air. It is met by drawing down existing above-ground stockpiles, meaning the world is not running out of silver in an absolute sense, but is consuming its inherited reserves faster than current production can replace them.
This distinction between a deficit and a shortage is critically important and frequently misunderstood. A deficit is an accounting condition. A shortage is a physical availability crisis. The former can persist for years, even decades, while a large inherited stockpile absorbs the annual gap. Whether that inherited stockpile is large enough, and accessible enough, to prevent the deficit from becoming a shortage is precisely the question that the three major research frameworks answer very differently.
How Silver Supply and Demand Are Measured
To assess whether a deficit exists, analysts must first define and quantify both sides of the ledger.
Key supply components include:
- Primary mine production from silver-specific and by-product mines
- Secondary recycling and scrap recovery from industrial, jewelry, and consumer sources
- Net hedging flows from mining companies managing forward price exposure
- Net official sector sales from government and central bank holdings
Key demand components include:
- Industrial fabrication across electronics, military, and medical sectors
- Photovoltaic and solar energy applications, now the fastest-growing demand category
- Jewelry and silverware manufacturing
- Physical investment demand including coins, bars, and exchange-traded funds
The way each of these categories is defined, measured, and treated in the final accounting determines whether the model produces a deficit or a surplus, and by how much. Furthermore, understanding silver's dual role as both an industrial input and a monetary asset adds another layer of complexity to this already nuanced analysis.
The Scale of the Silver Deficit: Six Consecutive Years of Shortfalls
Deficit Projections and Cumulative Drawdowns Through 2026
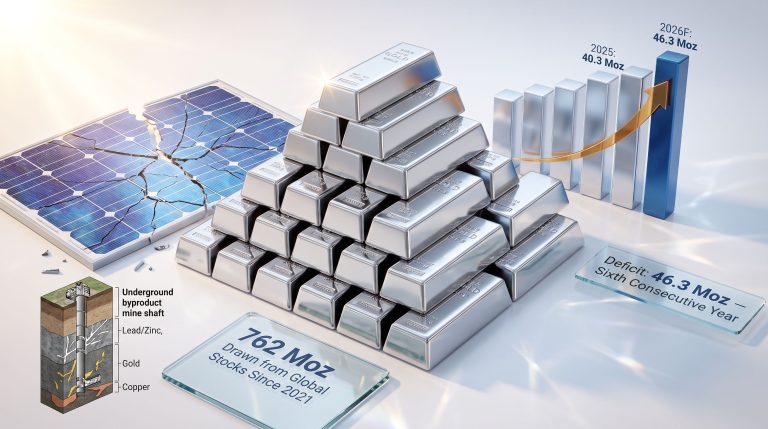
According to the Silver Institute's most recent projections, the silver market is expected to record a deficit of approximately 46.3 million ounces in 2026, extending what has now become a six-year consecutive run of annual shortfalls dating back to 2021.
| Metric | Figure |
|---|---|
| Projected 2026 deficit | 46.3 million ounces |
| Consecutive deficit years (2021–2026) | 6 years |
| Cumulative above-ground stock drawdown since 2021 | ~762 million ounces |
| Cumulative deficit 2019–2026 (Metals Focus methodology) | ~43,513 tonnes |
The persistence of this deficit pattern across six years carries structural significance. Neither mine supply growth nor recycling volumes have proven sufficient to offset the combined rise in industrial fabrication and investment demand. Whether this reflects a genuine and worsening supply constraint or a methodological artefact, however, depends entirely on which research framework you treat as the most credible.
How the 2026 Deficit Compares to the Broader Trend
The deficit first appeared in the Metals Focus and Silver Institute data in 2019. Adding the annual shortfall figures reported across the 2019 to 2026 period produces a cumulative gap of approximately 43,513 tonnes, a figure that has circulated extensively in precious metals commentary and is one of the most-cited statistics in the silver investment space. It is also one of the most debated.
Consequently, silver supply deficits of this scale and duration inevitably attract intense scrutiny from analysts seeking to determine whether the shortfall is structural or a product of contested accounting methodologies.
The persistent nature of the deficit, now entering its sixth consecutive year, suggests that neither mine supply growth nor recycling volumes have been sufficient to offset rising industrial and investment demand. Whether the gap is as large as reported depends on assumptions that neither study can fully verify.
Three Research Frameworks, Three Different Conclusions
Why Methodology Is the Most Important Variable in Silver Analysis
Three primary data sources shape the global conversation on silver supply and demand: the U.S. Geological Survey (USGS), the Silver Institute in conjunction with Metals Focus through their annual World Silver Survey, and CPM Group through their independent annual analysis. Each applies different geographic scope, different recycling assumptions, and different philosophical frameworks for treating investment demand. The result is not minor variation around a central estimate. It is fundamentally different conclusions about the state of the silver market.
| Methodology Dimension | USGS | Silver Institute / Metals Focus | CPM Group |
|---|---|---|---|
| Geographic scope | Primarily U.S. (world mine estimates only) | Global | Global |
| Annual mine production estimate | Closely aligned with Metals Focus | ~880–900 Moz range | Slightly lower |
| Scrap / recycling estimate | Limited | 180–195 Moz/year | 230–275 Moz/year |
| Investment demand treatment | N/A | Counted as demand contributing to deficit | Counted as above-ground stock |
| Above-ground stock methodology | N/A | Identifiable, reported stocks only | Large implied unreported basis |
| Deficit conclusion | N/A | Persistent annual deficits since 2019 | Large existing stockpile buffers deficits |
Where the Three Studies Agree
The one area where all three frameworks converge is mine production. The USGS world mine estimates align closely with Metals Focus figures, and CPM Group's mining estimates, while slightly lower, are not divergent enough to materially change the supply picture on their own. Mine production is the most verifiable variable in the analysis, supported by corporate reporting, royalty data, and government statistics from major producing nations. It is not what drives the disagreement between the studies.
The Single Biggest Variable: Scrap and Recycling Estimates
Why Recycling Is Where the Analysis Breaks Apart
The difference between Metals Focus reporting approximately 180 to 195 million ounces of annual scrap recovery and CPM Group's estimate of 230 to 275 million ounces is not a minor rounding discrepancy. Compounded across five decades of accumulation, this divergence in annual recycling estimates produces dramatically different conclusions about the total volume of silver available above ground. It is, in practical terms, the single variable that most determines whether an investor views silver as tightly constrained or adequately supplied.
Metals Focus and Silver Institute approach:
- Applies conservative, verifiable recycling data based on identifiable and reported scrap flows
- Results in lower annual supply, which produces larger reported annual deficits
- More likely to understate recycling from private and informal channels
CPM Group approach:
- Applies higher recycling estimates across industrial, jewelry, and silverware categories
- Incorporates implied flows from private holdings re-entering the market at price-sensitive thresholds
- Results in higher annual supply, which offsets or significantly reduces apparent deficits
How Scrap Composition Breaks Down in Practice
Silver scrap is not a homogeneous category. It flows from several distinct sources with very different price sensitivities, recovery rates, and reporting characteristics.
Primary scrap categories and their dynamics:
- Industrial scrap: Typically represents 15 to 60% of total recycling volume depending on the year and methodology applied
- Jewelry scrap: Highly price-sensitive, rising 8% as a share of total scrap in 2024 as elevated prices incentivised selling
- Silverware scrap: Also price-sensitive, rising 11% as a share of total scrap in 2024, particularly in markets where old silverware carries limited collector premium
- Photographic silver: Structurally declining as digital photography replaces film-based processes
- Consumer bullion (bars, coins, rounds): Difficult to track systematically because it moves through private channels without mandatory reporting
In 2024, total scrap volumes reached a 12-year high, the highest level recorded since 2012, driven by price-sensitive selling as silver prices climbed sharply from levels at which many retail investors had originally purchased their holdings. This data point is significant because it demonstrates that above-ground private stocks are price-responsive, a dynamic that neither study fully integrates into its modelling.
Scrap recycling reached its highest level in twelve years during 2024. This price-driven surge illustrates a key tension in silver supply analysis: the very stockpiles that are claimed to be unavailable can and do re-enter the market when price incentives are sufficiently strong.
Above-Ground Silver Stocks: Total Inventory vs. What Is Actually Accessible
The Critical Distinction Between Existence and Availability
Total above-ground silver stocks were estimated at approximately 19.3 billion ounces at the end of 2023, representing roughly 16 times annual global demand. On the surface, this sounds like an enormous buffer. In practice, the vast majority of this silver is embedded in fabricated products, long-term private hoards, and industrial applications where recovery is either physically difficult or economically unviable at current prices.
| Stock Category | Estimated Volume | Liquidity / Availability |
|---|---|---|
| Total above-ground silver (all forms) | ~19.3 billion oz (end-2023) | Very low, largely immobile |
| Visible / exchange-deliverable silver | Exchange-reported inventories only | Moderate, tradeable but declining |
| Free-float silver (CPM Group estimate, all investment forms) | ~6.5 billion oz | Variable, price-sensitive |
The total above-ground figure does not correlate directly with silver price for precisely this reason. Availability, not existence, is what drives market tightness. For a deeper look at how this tension manifests in real-time trading conditions, silver market backwardation provides a compelling illustration of how physical availability pressures can surface in futures pricing structures.
According to global silver supply and demand data published by the Silver Institute, the breakdown between investable and non-investable forms of silver reinforces the point that headline inventory figures routinely overstate practical market accessibility.
The COMEX Inventory Puzzle: A Central Empirical Tension
One of the most striking and least-discussed data points in recent silver market history is the addition of approximately 200 million ounces to COMEX inventories during 2025, with the largest increase concentrated in registered stocks, meaning silver that is unencumbered and immediately tradeable. Despite significant outflows from COMEX to offshore markets in late 2025, total inventories in 2026 remain slightly above their 2024 pre-surge levels.
This creates an empirical tension that any credible silver above ground stocks and silver deficit analysis must address directly. If the silver market has been running persistent deficits since 2019 and above-ground stocks have been drawn down by approximately 762 million ounces since 2021, how did COMEX inventories increase by 200 million ounces in a single year?
Three plausible explanations exist, none of which is conclusive:
- Scrap and recycling acceleration: Elevated silver prices through 2024 and into 2025 triggered above-average consumer and industrial scrap selling, flooding refineries and ultimately boosting exchange-deliverable supply
- Repatriation of offshore silver bars: Foreign-held silver bars re-entering U.S. exchange infrastructure, possibly driven by arbitrage opportunities between regional markets
- Drawdown of implied unreported private stocks: Private holdings accumulated over decades entering the visible market in response to sustained price incentives, consistent with CPM Group's theoretical framework
The honest answer is that nobody knows with confidence which explanation accounts for the largest share of the surge, and the absence of granular tracking data makes it impossible to determine this with precision.
The next major ASX story will hit our subscribers first
CPM Group's 6.5 Billion Ounce Estimate: The Auditability Problem
What the CPM Group Above-Ground Stock Estimate Actually Contains
CPM Group's estimate that approximately 6.5 billion ounces of silver exist in investable form above ground incorporates both reported and implied components. The reported portion includes government-minted coins such as American Eagles and Canadian Maple Leafs, dealer and wholesale stocks, COMEX and other exchange holdings, ETF and investment fund holdings, and government reserves.
The implied unreported component is where the estimate becomes analytically fragile. This category is intended to capture third-party rounds, bars, and various private holdings accumulated since the 1970s that have never re-entered the formally tracked market. It is, by the study's own admission, the largest and fastest-growing component of CPM Group's above-ground stock estimate since 2010.
The implied unreported stock category cannot be independently verified. Private ownership breaks the chain of custody. There is no mechanism to audit the volume, condition, or market availability of silver held in private hands across five decades of accumulation. An estimate built on unauditable inputs deserves to be treated as an approximation, not a precise inventory count.
How Compounding Errors Over 50 Years Distort the Total
If the annual recycling estimates used to build the cumulative above-ground stock figure are even modestly incorrect, the error compounds dramatically across 50 years of accumulation. A difference of 50 million ounces per year in recycling estimates, which falls within the range of disagreement between the two major studies, produces a cumulative discrepancy of 2.5 billion ounces over that timeframe. This is not a small rounding issue. It is a structural uncertainty that makes the 6.5 billion ounce figure an informed estimate rather than an audited inventory.
Silver Lost to Fabrication: The Permanent Destruction Problem
A meaningful but unquantified portion of all silver ever mined has been permanently removed from accessible above-ground stocks through industrial consumption in forms that cannot be economically recovered at current prices.
Categories of effectively irrecoverable silver include:
- Military ordnance and defence applications where silver is chemically dispersed on detonation
- Consumer electronics in landfills, including smartphones, cameras, and medical devices where silver is present in minute concentrations across billions of units
- Photographic materials in historical waste streams
- Minute-concentration industrial applications where the cost of extraction vastly exceeds the value recovered
Recovery of silver from landfill sources is generally estimated to require silver prices of at least $120 to $150 per ounce or higher before it becomes economically viable at meaningful scale, and only then in landfills with unusually high concentrations of silver-bearing electronic waste.
How Investment Demand Complicates the Deficit Calculation
The Accounting Disagreement at the Heart of the Debate
The treatment of investment demand, meaning the purchase of silver coins, bars, and rounds by retail and institutional investors, is where the two major studies diverge most sharply in their philosophical approach.
| Treatment | Silver Institute / Metals Focus | CPM Group |
|---|---|---|
| Investment demand (coins, bars) | Counted as demand, contributes to deficit | Counted as above-ground stock, offsets deficit |
| Logical basis | Point-in-time flow accounting | Stock-based cumulative accounting |
| Implication | Larger deficits, more bullish signal | Larger stockpile, more moderate signal |
Both approaches are simultaneously defensible and incomplete. The Silver Institute framework is logically sound on a year-by-year basis: if an investor buys a silver bar, that silver is removed from the industrial supply pool in that period. CPM Group's counter-argument is equally valid: that bar has not been consumed. It can be resold, and it regularly is when prices rise sufficiently. The 2024 scrap surge to a 12-year high is direct empirical evidence that investment silver does return to the market under the right price conditions.
The Premium Preservation Dynamic in Retail Silver Markets
One underappreciated nuance in silver recycling economics is why certain forms of retail silver are far less likely to enter the scrap market than their raw metal content would suggest. Government-minted coins such as American Eagles and Canadian Maple Leafs consistently trade at premiums of several dollars per ounce above spot price, sometimes significantly more during periods of high retail demand.
Dealers who scrap these coins instead of reselling them typically receive only around 97 to 98% of spot from refiners, meaning they sacrifice the premium entirely. This economic incentive structure means that government coin holdings, which represent an enormous share of accumulated retail silver investment, are among the least likely silver assets to re-enter industrial supply chains, even during periods of elevated prices. Generic bars and rounds, particularly older products from brands with limited collector recognition or those with physical damage, are more likely candidates for recycling and refining.
The Financialisation Factor: The Variable Neither Study Can Quantify
Multiple Ownership Claims on a Single Physical Ounce
Beyond the dispute between competing supply and demand methodologies lies a third layer of uncertainty that neither major study attempts to resolve. Neither the Silver Institute framework nor CPM Group's analysis accounts for the degree to which a single physical ounce of silver may simultaneously underpin multiple financial claims through ETF structures, exchange-eligible inventory designations, leasing agreements, and over-the-counter swap contracts.
This financialisation dynamic means that even a perfectly accurate physical inventory count would not reveal the true volume of silver available to meet discrete demand obligations. One ounce stored in a centralised warehouse could simultaneously be counted as ETF collateral, listed as exchange-eligible inventory, and subject to a leasing arrangement or swap agreement. When those claims converge simultaneously, the physical metal cannot satisfy all of them.
Even if a precise and auditable above-ground silver inventory existed, it would not capture the degree to which that inventory has been hypothecated across multiple simultaneous financial claims. The financialisation layer introduces a supply risk that sits entirely outside the accounting frameworks of both major studies.
What This Means for Silver Price Discovery
The practical implication for investors is sobering. Even a committed view on the Silver Institute's deficit numbers, or on CPM Group's stockpile estimates, provides an incomplete picture of available supply if the financialisation dimension is not factored in. A market in which the same physical ounce underlies multiple financial claims is a market where reported inventories will overstate true available supply during periods of simultaneous claim redemption.
Historical precedents in commodity markets, including documented instances in which the gap between paper claims and physical metal availability became apparent only under stress conditions, suggest this is not a theoretical concern. In addition, the gold-silver ratio offers a complementary lens through which investors can assess relative value distortions that may emerge when financial claims diverge from physical realities.
Silver Bullion by Form: Why Type Determines Market Availability
Industrial vs. Retail Silver and the Liquidity Spectrum
Not all silver above ground is equally accessible to the market. The form in which silver exists determines its practical liquidity, exchange eligibility, and likelihood of re-entering industrial supply.
| Silver Form | Primary Use | Recyclability | Exchange Eligibility |
|---|---|---|---|
| 1,000 oz bars | COMEX contracts, industrial | High | Yes (registered/eligible) |
| Kilo bars and rounds | Retail investment | Moderate | Limited |
| 1 oz, 10 oz, 100 oz coins/bars | Consumer investment | Low to moderate | No |
| Government coins (Eagles, Maples) | Collector / investment | Low (premium preserved) | No |
| Industrial fabricated silver | Electronics, solar, medical | Very low | No |
COMEX contracts are settled using 1,000-ounce bars, and each standard contract represents five of these bars. The registered versus eligible distinction on exchanges is important: registered stocks are unencumbered and immediately tradeable, while eligible stocks are privately owned and can only be traded if not pledged to an existing contract. The sharp increase in registered stocks during the 2025 COMEX inventory surge was particularly notable because it represented genuinely deployable supply.
Investor Implications: What Methodological Uncertainty Means for Positioning
How Your Starting Assumptions Determine Your Silver Thesis
The investment case for silver in a structural deficit environment is not simply a matter of reading the headline numbers from one report. It requires a conscious choice about which methodological framework most closely reflects reality, and an honest accounting of what each framework gets wrong.
If you weight the Metals Focus and Silver Institute framework more heavily:
- Lower recycling estimates lead to larger annual deficits
- Declining visible inventories are interpreted as confirming physical supply stress
- The primary risk is that price-sensitive investment silver re-entering the market at higher prices moderates the upward price move that the deficit thesis implies
If you weight the CPM Group framework more heavily:
- Higher recycling estimates combined with the implied private stockpile partially or fully offset annual deficits
- A large above-ground buffer limits the risk of extreme price spikes driven by physical unavailability
- The primary risk is that the implied unreported stock category is overstated due to compounding estimation errors and silver lost to fabrication, meaning tightness is more severe than the model suggests
Industrial Demand as the Structural Long-Term Price Driver
Regardless of which supply framework an investor accepts, the demand side of the silver equation is considerably less ambiguous. Industrial applications now represent the dominant and fastest-growing source of silver consumption, and many of these applications involve silver in forms that are not economically recoverable at current prices.
Key industrial demand growth sectors:
- Solar photovoltaics, the largest and fastest-growing silver demand category globally
- Electric vehicles and EV charging infrastructure
- Data centre power systems and artificial intelligence hardware
- Military and defence electronics
- Medical devices and diagnostics
Silver's irreplaceability across these applications, driven by its unique combination of electrical conductivity, thermal properties, and antimicrobial characteristics, means that industrial demand is structurally anchored in ways that are not easily disrupted by price increases in the short to medium term. This structural anchoring matters more for the long-term silver price trajectory than any single year's deficit figure. For broader context, a comprehensive precious metals analysis can help investors situate silver's industrial demand dynamics within the wider commodity landscape.
Furthermore, analysts at Mining.com have noted that the risk of silver above ground stocks and silver deficit dynamics being misread is substantial, particularly when investors conflate total inventory with genuinely accessible supply — a distinction that has significant implications for how tightly the market is actually constrained.
What We Know, What We Don't, and How to Think About It
Three Things the Data Confirms With High Confidence
- Annual silver demand has exceeded annual mine supply for at least six consecutive years through 2026, regardless of which recycling methodology is applied
- Visible, exchange-deliverable silver inventories have been materially drawn down since 2021, with the 2025 COMEX surge representing a partial and unexplained reversal that neither study fully accounts for
- Industrial applications are consuming silver in ways that permanently remove a meaningful share of it from investable supply, with the exact percentage unknown but structurally significant
Three Things That Remain Genuinely Uncertain
- The true volume of private above-ground silver stocks and the price level at which they become available in meaningful quantities
- The degree to which financialisation has created multiple simultaneous claims on single physical ounces, distorting all inventory-based supply assessments
- The exact annual recycling rate, which is the single variable most responsible for the divergence between the two major studies and the one least amenable to precise independent verification
The silver deficit is real in the sense that annual demand structurally exceeds annual mine production. What remains genuinely contested is how much of the existing above-ground stockpile is available to bridge that gap, and at what price point it becomes mobilised. The answer to that question will determine whether the deficit produces a gradual price re-rating or a more acute supply dislocation.
This article is intended for educational and informational purposes only. It does not constitute financial advice. Forecasts, projections, and analysis of commodity markets involve inherent uncertainty. Investors should conduct their own due diligence and consult qualified financial advisers before making investment decisions. All figures cited reflect data available at the time of writing and are subject to revision as new information becomes available.
Further Reading and Research Sources
Readers seeking to explore silver supply methodology, above-ground stock estimates, and deficit analysis in greater depth can consult the publicly available Silver Institute World Silver Survey at silverinstitute.org, the U.S. Geological Survey Mineral Commodity Summaries at usgs.gov, and CPM Group's publicly released video commentary and articles, which are accessible through their official YouTube channel. Each source applies a different methodological lens and reading all three in parallel is the most reliable way to form an independently grounded view of the silver market.
Want to Know When the Next Major Silver or Mineral Discovery Hits the ASX?
Discovery Alert's proprietary Discovery IQ model scans ASX announcements in real time, instantly translating complex commodity data — across more than 30 minerals — into clear, actionable investment insights, so subscribers can act on significant discoveries before the broader market catches on. Explore historic discoveries and their exceptional returns, then start your 14-day free trial to position yourself ahead of the next major find.