June 13, 2026
Why Silver Developer Valuations Diverge So Sharply From Resource Reality
The precious metals mining sector has a long-standing valuation paradox: some of the largest, highest-quality resource bases in the world trade at the deepest discounts to in-situ value, while smaller, production-stage assets command multiples that appear disconnected from underlying geology. This divergence is not irrational. It reflects a precise set of institutional constraints that govern which assets can attract capital and which remain structurally excluded from the investable universe regardless of what lies underground.
Understanding this mechanism is essential context for evaluating Hycroft Mining Holding Corporation (NASDAQ: HYMC), a Nevada-based precious metals developer whose Hycroft Mining capital structure transformation and enterprise value benchmarking story illustrates exactly how the gap between resource value and market pricing opens, and under what conditions it closes. Furthermore, silver's dual nature as both a precious and industrial metal adds another layer of complexity to how developers in this space are valued by institutional investors.
When big ASX news breaks, our subscribers know first
The Institutional Access Problem in Pre-Revenue Mining
For most institutional precious metals funds, the decision to invest in a pre-production developer is governed less by geological quality and more by balance sheet configuration. A developer carrying debt obligations that mature before production commences creates what compliance frameworks classify as an equity-at-risk condition: the equity cannot generate returns faster than the debt compounds, meaning shareholders absorb a structural drag that worsens with time.
This is precisely the position Hycroft occupied before its capital restructuring. Legacy obligations inherited from a predecessor entity were accumulating at approximately $1 million per month, with maturities extending to 2027. For a company without revenue, that trajectory placed the stock outside the investment mandate of the majority of institutional precious metals funds, irrespective of the underlying asset's scale or quality.
The restructuring resolved this through a sequenced series of private placements. An initial round anchored by specialist resource investors, including Eric Sprott and Tribeca (Australia), established credibility within the resource investment community. A larger subsequent institutional round retired all outstanding debt obligations in full, injecting sufficient capital to fund multi-year exploration without returning to public equity markets. The net result was extraordinary in its compression: the entire capital structure shift occurred within a single trading session.
By Q1 2026, Hycroft reported $189 million in cash and cash equivalents with zero debt. As of April 27, 2026, unrestricted cash stood at $192 million, with 91.4 million shares outstanding and 101.4 million fully diluted shares inclusive of warrants and restricted stock units. Institutional investors now hold approximately 85% of the company, including Franklin Equity Group, BlackRock Investment Management LLC (UK), Eric Sprott, and Schroder Investment Management Ltd.
The funded operational runway is characterised by management as exceeding three years without requiring additional equity issuance, a claim supported by the current cash position relative to the company's disclosed burn rate across technical studies and drilling programs.
Enterprise Value Mechanics When Cash Dominates the Equation
With zero debt, the enterprise value calculation simplifies to market capitalisation minus the cash balance. This creates a counterintuitive dynamic that is frequently misread by investors unfamiliar with balance sheet composition: a large cash position mechanically compresses EV against a static resource base, causing the EV/oz metric to appear anomalously low.
This is not the same as the market assigning negative value to the asset. It is an arithmetic outcome of the formula itself. Analysts and investors modelling Hycroft's valuation on a per-ounce basis must use the 101.4 million fully diluted share count as the denominator, not the basic share count, to avoid understating potential dilution from warrants and RSUs. A thorough gold-silver ratio analysis also helps contextualise how the relative pricing of these metals shapes EV benchmarking across the developer peer group.
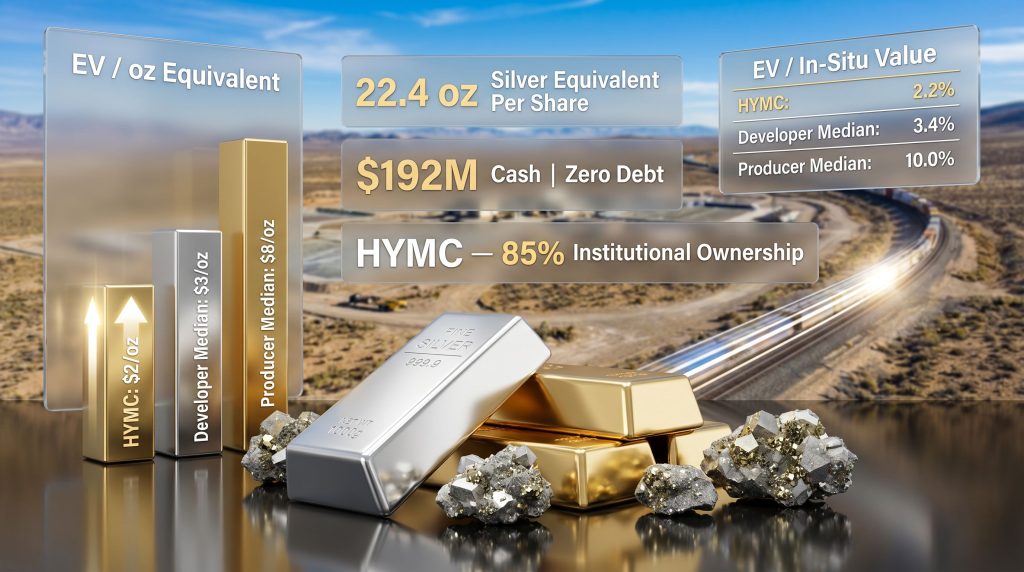
Hycroft's own benchmarking analysis, conducted using BMO Capital Markets data at spot prices, produced the following comparison:
| Metric | Hycroft (HYMC) | Silver Developer Median | Silver Producer Median |
|---|---|---|---|
| EV / Silver Equivalent (per oz) | $2 | $3 | $8 |
| EV / In-Situ Value | 2.2% | 3.4% | 10.0% |
| Silver Equivalent oz Per Share | 22.4 oz | ~6.3 oz (Contango) | ~7.8 oz (Fresnillo) |
At 22.4 ounces of silver equivalent per share, Hycroft's resource density exceeds its nearest developer peer by 3.6 times and its nearest producer peer by 2.9 times. The discount to the silver developer median on an EV/oz basis is approximately 33%, while the discount to the producer median is 75%.
Three structural factors explain why the discount currently persists rather than closing:
- No published Preliminary Economic Assessment (PEA): Without a PEA, institutional models cannot generate an NPV figure, IRR sensitivity, or payback period, which are the standard inputs required for investment committee approval at most funds.
- Pre-production status: Revenue-generating operations command a premium over development-stage assets of equivalent resource size, reflecting the execution risk that separates a drill hole from a mine.
- Initial resource classification: The high-grade Brimstone and Vortex systems hold an initial resource estimate rather than a feasibility-grade resource, introducing geological uncertainty that markets price conservatively until additional infill drilling tightens confidence intervals.
Two Distinct Assets Within a Single Permitted Boundary
A critical analytical distinction that is frequently collapsed in surface-level coverage of Hycroft is that the property contains two fundamentally different economic scenarios, not a single deposit with varying grades.
The Large-Scale Oxide Resource
The 2026 measured and indicated mineral resource, calculated at $3,100/oz gold and $36/oz silver, totals 16.4 million ounces of gold and 562.6 million ounces of silver, representing a 55% increase from the 2023 resource estimate. That prior estimate used substantially lower price assumptions of $1,900/oz gold and $24.50/oz silver, meaning the resource growth reflects a combination of additional drilling and an expanded price deck.
Average combined grades across this resource run to 0.333 g/t gold and 11.42 g/t silver. This bulk-tonnage, lower-grade inventory has historically defined the asset's scale, but the grade profile demands large-scale processing infrastructure and capital intensity that made the commercial pathway uncertain for an extended period.
The High-Grade Underground Discovery: Brimstone and Vortex
The February 2026 Initial Assessment Technical Report established a materially different economic profile within the same permitted land package. The measured and indicated high-grade silver resource across the combined Brimstone and Vortex systems totals 90.2 million ounces at an average grade of 154.71 g/t silver, using a cutoff grade of 68.57 g/t silver. An additional 13.4 million ounces of inferred silver resource accompanies that figure.
The gold component within these high-grade domains registers 299,000 ounces measured and indicated at 0.512 g/t gold.
The grade differential between the two scenarios is not marginal. At 154.71 g/t silver, the Brimstone-Vortex domains are producing roughly 13.5 times the silver grade of the broader resource average. This is the difference between a bulk mining operation and a selective underground mine with concentrate optionality.
A 3,500 to 5,000 tonne-per-day underground operation targeting these high-grade domains would produce a high-quality sulfide concentrate. Management has identified the active Union Pacific rail line that crosses the Hycroft property as a direct concentrate transport pathway to third-party processing facilities, eliminating the need for new logistics infrastructure investment.
| Resource Category | Gold M&I (oz) | Silver M&I (oz) | Gold Grade (g/t) | Silver Grade (g/t) |
|---|---|---|---|---|
| Full 2026 Combined Resource | 16.4 million | 562.6 million | 0.333 | 11.42 |
| Brimstone + Vortex High-Grade | 299,000 | 90.2 million | 0.512 | 154.71 |
| Grade Ratio (High vs. Bulk) | 1.5x | 13.5x | Higher | Higher |
The Roaster Trade-Off Study: Why Process Selection Determines the PEA Outcome
One of the least widely understood aspects of the Hycroft development pathway is the degree to which the PEA's economic conclusions depend on a process selection decision that has not yet been finalised. The roaster versus pressure oxidation (POX) trade-off study is not an operational footnote. It is a variable that directly reshapes the project's margin architecture.
Under a pressure oxidation pathway, the sulfide and pyrite content of the ore requires lime neutralisation, which is a pure operating cost with no offsetting revenue. Under a roasting pathway, the same sulfide stream generates sulfuric acid as a byproduct. That acid can be sold into adjacent industrial markets, including lithium processing, fertiliser production, and copper refining, converting what was a cost centre into a third commodity revenue line alongside gold and silver.
Both processing routes carry broadly comparable headline capital and operating cost structures. The margin differential between the two scenarios emerges from the acid revenue stream available only under roasting. This revenue line is not reflected in any current market pricing of the asset because no PEA incorporating it has been published.
The trade-off study is targeted for mid-2026 completion. Until it concludes, the PEA cannot be finalised with a base-case process selection, which means the NPV sensitivity tables that institutional investors require for valuation modelling remain unavailable. The study is a necessary predecessor to the PEA, not a parallel workstream. In addition, understanding concepts around grade, permitting and value is useful context for appreciating why process selection carries such significant weight in the overall development timeline.
If roasting is confirmed as economically superior, every gold and silver price scenario in the PEA sensitivity analysis will carry a higher projected margin than an equivalent POX scenario at the same metal recoveries. This asymmetric upside to the NPV calculation is currently invisible to the market.
Catalyst Roadmap: What Drives a Re-Rating From Here?
The pathway from current enterprise value to a market price that reflects institutional NPV-based valuation runs through a defined sequence of technical milestones. Each study resolves a specific information gap that currently prevents institutional models from pricing the asset on a comparable basis to peers.
| Milestone | Target Date | What It Resolves |
|---|---|---|
| Roaster trade-off study | Mid-2026 | Determines PEA base-case process and margin structure |
| Milling + POX PEA | 2026 | First published NPV for large-scale development scenario |
| Vortex + Brimstone expansion drilling (~26,000m, 5 rigs) | 2026 | Resource growth to underpin underground mine plan |
| Heap leach restart feasibility | 2026 | Near-term, lowest-capital production pathway assessment |
| Brimstone-Vortex underground PEA | Early 2027 | Standalone NPV for high-grade starter mine concept |
The heap leach restart feasibility study deserves particular attention because it represents the lowest-capital route to initial cash generation. Hycroft already holds existing permits for heap leach operations. A confirmed restart pathway would provide near-term revenue optionality while the underground and milling scenarios advance through longer technical study timelines.
The next major ASX story will hit our subscribers first
Material Risks Investors Must Incorporate Into Their Modelling
Any analysis of Hycroft's development scenario that omits the downside framework is incomplete. Several material risks affect both the timeline and the magnitude of a potential re-rating.
Drilling execution risk: The Brimstone-Vortex underground mine plan requires sufficient resource delineation to support a bankable study by early 2027. The 2023-2024 campaign returned ore-grade intercepts in approximately 85% of drill holes, an exceptionally high success rate. If subsequent programs underperform this benchmark, the underground resource could grow more slowly than the mine plan timeline demands.
Commodity price sensitivity: The 2026 resource estimate is calculated at $3,100/oz gold and $36/oz silver, materially above the $1,900/oz gold and $24.50/oz silver assumptions used in 2023. Resource ounce counts are price-dependent. A sustained pullback in precious metals would compress the resource base underpinning both scenarios. Investors should stress-test resource metrics against lower price decks when constructing downside cases.
Timeline and cash burn: With no production revenue, all operational and technical study costs are funded from the cash position. The runway exceeds three years at current burn rates, but acceleration in drilling programs, study costs, or permitting modifications could compress that timeline. The fully diluted share count of 101.4 million represents the ceiling for dilution exposure if additional equity is ever required.
Permitting modifications: Hycroft holds existing permits for both heap leach and milling operations in Nevada, consistently ranked among the top three global mining jurisdictions in the Fraser Institute's Annual Survey of Mining Companies. Final operating plans may require modifications to existing permits, introducing timeline uncertainty, though the regulatory baseline is materially more advanced than most development-stage peers.
Infrastructure Replacement Value and the Greenfield Comparison Problem
One valuation consideration that is systematically underweighted in surface-level peer comparisons is the replacement cost of Hycroft's existing permitted infrastructure. Management estimates that replicating on-site infrastructure at current construction costs would exceed $1 billion.
This matters because several silver developers in the benchmarking peer group trade at higher EV/oz multiples despite holding no comparable permitted infrastructure. The EV/oz metric, taken in isolation, does not adjust for the cost and time required to build what Hycroft already possesses within an approved regulatory framework.
Nevada's position as the most active mining state in the contiguous United States adds a jurisdictional dimension to this comparison. The established permitting pathways, experienced mining labour force, and existing logistics infrastructure within the state provide a development baseline that genuine greenfield developers in other jurisdictions cannot replicate at current enterprise valuations. However, broader silver supply deficits remain a powerful macro tailwind that could accelerate valuation re-ratings across the entire developer cohort, including assets with Hycroft's infrastructure profile.
The Information Gap Between Resource Density and Market Pricing
The Hycroft Mining capital structure transformation and enterprise value benchmarking analysis converges on a single conclusion: the current discount to developer peers is mechanically explainable rather than fundamentally justified. A pre-production status premium, an absence of published economic studies, and an initial resource classification at Brimstone-Vortex collectively explain why $2/oz silver equivalent persists against a developer median of $3/oz and a producer median of $8/oz.
What the discount does not reflect is geological worthlessness. The combination of a fully funded multi-year drilling program, an 85% institutional ownership base that was structurally unavailable before the capital restructuring, over $1 billion in estimated infrastructure replacement value, and a high-grade discovery that repositions the development pathway from bulk-tonnage only to high-grade underground plus bulk-tonnage creates the conditions for a valuation re-rating once the information gap closes.
The PEA is the instrument that closes that gap. When published, it will provide the first institutional-grade NPV figure, IRR sensitivity tables, and commodity price scenario analysis that allow fund managers to place Hycroft into a quantitative valuation framework. A definitive feasibility study would represent the ultimate validation milestone further down the development pathway, converting probabilistic resource estimates into bankable project economics. Until the PEA document is released, the discount is the market's rational response to incomplete information, not a verdict on the underlying asset. Investors can review Hycroft's latest financial statistics to track how the balance sheet and market metrics evolve as technical milestones are reached.
This article is for informational purposes only and does not constitute financial advice or a recommendation to buy or sell any security. All resource estimates, valuations, financial figures, and milestone timelines referenced are sourced from company disclosures and public filings as of the dates cited. Investing in mining development companies involves significant risks, including commodity price volatility, execution risk, and capital requirements. Readers should conduct their own due diligence and consult a licensed financial adviser before making investment decisions.
Want To Be First When The Next Major Mineral Discovery Hits The ASX?
Discovery Alert's proprietary Discovery IQ model delivers real-time alerts on significant ASX mineral discoveries, transforming complex geological and commodity data into actionable investment insights for both short-term traders and long-term investors — explore historic discoveries and the returns they generated to understand what early positioning can mean, then begin your 14-day free trial at Discovery Alert to secure your market-leading edge.