July 15, 2026
Silver's Dual Nature: Why Macro Sentiment Keeps Overriding a Six-Year Supply Crisis
Most commodity markets operate on a straightforward premise: when supply falls persistently short of demand, prices rise until equilibrium is restored. Silver refuses to follow this logic. Despite recording six consecutive annual physical deficits and cumulative above-ground inventory drawdowns that rival some of the most extreme supply shocks in modern commodity history, silver's spot price continues to be pulled in competing directions by forces that have nothing to do with mining output or industrial consumption.
Understanding why this happens requires examining silver's dual nature as two fundamentally different assets occupying the same metal. On one side sits monetary silver, a traditional store of value and safe-haven instrument with centuries of precedent. On the other sits industrial silver, a critical input in solar photovoltaic manufacturing, electric vehicle powertrains, semiconductor fabrication, and increasingly, the high-performance chips powering artificial intelligence infrastructure.
These two identities do not always want to move in the same direction, and when the macro environment shifts, the tension between them becomes the defining dynamic in silver price discovery.
The gold-silver ratio and silver deficits represent two sides of this contradiction. The ratio is expanding at the same time that physical fundamentals are tightening, and the gap between those two realities tells investors something important about how silver markets actually function.
When big ASX news breaks, our subscribers know first
What the Gold-Silver Ratio Actually Measures and Why Most Investors Read It Wrong
Defining the Ratio and Its Limitations as a Standalone Signal
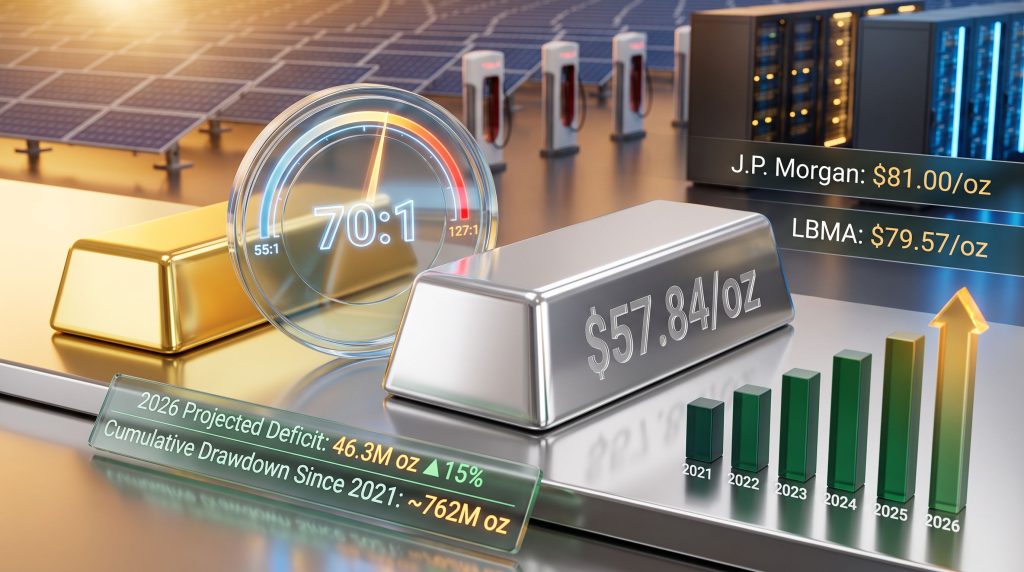
The gold-silver ratio expresses how many ounces of silver are required to buy a single ounce of gold at prevailing spot prices. When silver is at $57.84 per ounce and gold is trading near $4,035 per ounce, the ratio sits at approximately 70:1. A rising ratio means silver is underperforming gold on a relative basis. A falling ratio signals silver outperformance.
The ratio is frequently cited as a valuation shortcut, with readings above historical averages interpreted as evidence that silver is cheap relative to gold. This framing is not wrong, but it is dangerously incomplete. The ratio is a snapshot of relative pricing, not a forecast of mean reversion. Without context around Federal Reserve policy direction, industrial demand expectations, and physical inventory levels, the ratio alone cannot tell investors when or whether silver will close the gap. For a deeper perspective, gold-silver ratio analysis provides essential context that standalone figures simply cannot.
Historical Range: What the Data Actually Shows
| Period | Gold-Silver Ratio Range | Market Context |
|---|---|---|
| 50-Year Historical Average | ~65:1 to 70:1 | Long-run equilibrium benchmark |
| Modern Free-Market Range | 50:1 to 80:1 | Post-gold standard trading band |
| COVID-Era Peak | ~127:1 | Extreme risk-off, industrial demand collapse |
| Early 2024 | ~88:1 | Elevated rate environment, US dollar strength |
| May 2026 | ~55:1 | Silver outperformance, deficit repricing |
| July 2026 | ~70:1 | Fed rate expectations, industrial risk-off |
The compression from approximately 85:1 in late 2024 to 55:1 by May 2026 was driven by a combination of accelerating industrial demand recognition and growing investor conviction that Fed easing would support growth-sensitive assets. The subsequent reversal back toward 70:1 required no change in the physical supply picture whatsoever. What changed was the probability assigned to a September 2026 Federal Reserve rate hike, which CME FedWatch data placed at approximately 44% at the time of writing.
Key Insight: The ratio's swing from 55:1 to 70:1 within weeks demonstrates that short-term silver pricing is primarily a monetary policy sentiment trade, not a physical commodity trade. Investors who enter positions based on ratio extremes without accounting for the rate cycle risk being technically correct and financially wrong for extended periods.
Six Consecutive Annual Silver Deficits: Contextualising the Structural Shortfall
The Scale of Cumulative Inventory Depletion
The silver supply deficits recorded since 2021 represent a historically significant structural imbalance. The Silver Institute's data confirms that silver has now recorded a physical deficit in every year from 2021 through the 2026 projection. The 2026 deficit is estimated at 46.3 million ounces, representing a 15% increase over the 40.3 million ounce shortfall recorded in 2025. Furthermore, the cumulative drawdown from above-ground inventories since 2021 has reached approximately 762 million ounces.
To contextualise that figure: 762 million ounces represents roughly nine months of total global silver mine output. The magnitude of sustained inventory depletion is comparable in duration to the supply recovery cycle that followed the Hunt Brothers silver corner in the early 1980s, but occurring in the opposite direction and for structurally different reasons.
Above-ground stockpiles are now approaching decade lows, which reduces the market's capacity to absorb future deficits without forcing sharper price adjustments.
Why Mine Supply Cannot Be Turned On Like a Tap
A critical and widely underappreciated feature of silver supply is that the metal is overwhelmingly extracted as a byproduct of base metal mining, primarily copper, zinc, and lead operations. This means silver production volumes are governed by the economics of those primary metals, not by silver's own price signals. When silver prices rise, it does not automatically incentivise new silver-focused mine development because the marginal economics are determined by copper or zinc prices, not silver.
This creates a structural supply inelasticity that is unique among precious metals. Gold exploration and development is largely price-responsive: higher gold prices attract capital, drill programmes accelerate, and eventually new mines enter production. Silver lacks this self-correcting mechanism for the majority of its supply base.
Primary silver mines do exist, but they represent a minority of global output. The Bunker Hill Mining restart in Idaho illustrates the lead time problem clearly: despite a change in ownership in 2020, the mine required approximately six years before it could contribute meaningful production volumes. This timeline is typical, not exceptional, for mine restarts in established jurisdictions with existing infrastructure. Greenfield development in new locations takes considerably longer.
Global silver mine production peaked at approximately 900 million ounces in 2016 and had declined to an estimated 835 million ounces by 2025, a reduction of roughly 7% from peak output despite a period that included significantly higher silver prices. This structural production decline reinforces the view that supply cannot organically close a deficit measured in the tens of millions of ounces per year.
Where Demand Pressure Is Coming From
Industrial silver consumption reached a record 680.5 million ounces in 2024, with three demand vectors accounting for the bulk of structural growth. According to the Silver Institute's World Silver Survey, these drivers are expected to intensify further through the latter half of the decade:
- Solar photovoltaic manufacturing: Silver paste is applied to photovoltaic cells during production to create electrical contacts. As global solar capacity additions continue to accelerate, silver consumption per gigawatt of installed capacity remains substantial despite incremental efficiency improvements in paste application.
- Electric vehicles and power electronics: EV drivetrains, onboard charging systems, and grid-connected infrastructure each require meaningful silver content. The EV adoption curve, while cyclically sensitive, represents a durable long-term demand growth vector.
- Artificial intelligence infrastructure: High-temperature silicon carbide semiconductors used in AI data centre power management and high-frequency processing applications rely on silver paste in their manufacturing process. This is an emerging demand driver that receives comparatively little mainstream analytical coverage.
| Demand Category | Approximate Share of Total Demand | Growth Trajectory |
|---|---|---|
| Industrial (total) | ~58% | Accelerating |
| Solar and renewable energy | Largest industrial sub-segment | Strong structural growth |
| EVs and power electronics | Rapidly growing | Tied to EV adoption curve |
| AI and semiconductor applications | Emerging material driver | Early-stage but increasingly significant |
| Investment (coins, bars, ETFs) | ~25% to 30% | Cyclical, sentiment-driven |
| Jewellery and silverware | ~12% to 15% | Stable to modest growth |
How Federal Reserve Policy Expectations Override Physical Market Logic
The Transmission Mechanism: Why Rate Expectations Hit Silver Harder Than Gold
Gold and silver are both priced in US dollars and both are non-yielding assets, so the conventional wisdom holds that they should respond similarly to changes in interest rate expectations. In practice, the approximately 58% industrial demand exposure in silver's demand profile creates a materially different response function.
When rate-hike probability rises, two things happen simultaneously for silver. First, the opportunity cost of holding a non-yielding asset increases, which is the same headwind facing gold. Second, the forward outlook for global industrial activity is discounted more aggressively, which creates a unique additional headwind for silver that gold does not face. Gold's demand is dominated by central bank purchasing programmes and institutional safe-haven allocation, both of which are relatively insensitive to near-term growth cycle adjustments.
The result is that during periods of rising rate-hike expectations, silver tends to underperform gold even when the underlying physical supply situation remains structurally tight. The ratio widening to 70:1 is a textbook example of this dynamic. Consequently, the gold-silver ratio and silver deficits can diverge sharply during these episodes without any change to the underlying physical balance.
Reading the Current Macro Signals
The macro picture as of July 2026 presents a conflicted environment for silver:
- CME FedWatch data prices a July Fed hold at approximately 90%, a near-certain pause in the tightening cycle.
- September rate-hike odds sit near 44%, introducing forward uncertainty that weighs on industrial demand expectations for the second half of 2026.
- Brent crude holding above $85 per barrel on renewed geopolitical tensions adds inflationary pressure, complicating the Fed's path toward easing and sustaining elevated rate-hike probability estimates beyond July.
- The 10-year Treasury yield trajectory is a secondary but important signal: a sustained move below 4.60% would reduce the opportunity cost of holding non-yielding precious metals and support ratio compression.
The PCE Inflation Report as the Next Pivotal Decision Point
The Personal Consumption Expenditures index is the Federal Reserve's preferred measure of underlying inflation trends. Unlike the Consumer Price Index, PCE adjusts for substitution effects and changes in consumer spending patterns, making it a more dynamic measure of real purchasing power erosion.
Scenario Framework:
Bull case for silver: Fed holds in July, PCE prints below expectations, September hike odds fall below 30%, 10-year yield declines toward 4.50%. Ratio compresses toward the low 60s, supporting institutional price targets near $79 to $81 per ounce.
Bear case for silver: September hike odds rise above 50%, Brent remains above $85, PCE comes in hotter than expected. Ratio holds at or expands beyond 70:1 through Q3 2026, with silver remaining under macro pressure despite ongoing physical deficits.
Institutional Price Targets and the Implied Ratio Compression Required
Mapping Analyst Forecasts to Current Market Conditions
Two major institutional forecasts frame the upside scenario for silver:
| Forecast Source | Silver Price Target | Implied Gold-Silver Ratio (at ~$4,035 gold) |
|---|---|---|
| J.P. Morgan | $81.00 per ounce | ~50:1 |
| LBMA Consensus | $79.57 per ounce | ~51:1 |
| Current Market Price | $57.84 per ounce | ~70:1 |
| May 2026 Ratio Low Equivalent | ~$73 per ounce | ~55:1 |
Reaching either institutional target requires the gold-silver ratio to compress by 20 to 30% from current levels. That compression is not impossible — the ratio moved from 85:1 to 55:1 within approximately four months in late 2025 and early 2026 — but it requires a macro environment that actively supports silver's industrial demand outlook rather than discounting it. Analysis of why the gold-silver ratio is falling suggests that such compression episodes, however, can be swift and substantial when conditions align.
The Persistent Gap Between Physical Fundamentals and Spot Pricing
One of the more counterintuitive features of the current silver market is that six years of consecutive deficits and 762 million ounces of cumulative inventory drawdown have not been sufficient to force spot pricing toward institutional fair value estimates. This divergence reflects a well-documented dynamic in commodity markets where paper market positioning, driven by futures and ETF flows, can dominate price discovery over extended periods even when the physical market is structurally tight.
COMEX silver net speculative positioning provides a useful supplementary signal in this context. Extreme short positioning in futures markets can create conditions for sharp short-covering rallies that temporarily compress the ratio. Conversely, crowded long positioning signals near-term vulnerability to unwind pressure. Neither position extreme changes the underlying supply deficit, but both can significantly influence the timing of price moves.
The Basel III Dimension: An Underappreciated Structural Tailwind
One factor that receives limited mainstream coverage in silver market analysis is the ongoing implementation of Basel III banking regulations and their implications for how financial institutions account for precious metals positions. The Basel III impacts on unallocated precious metals positions held by banks are significant: under the Net Stable Funding Ratio requirements, these positions require more stable funding than was previously necessary.
This regulatory shift has structural implications for the cost and mechanics of holding silver in unallocated form, which could gradually shift institutional preference toward allocated physical holdings. While this dynamic is more advanced in gold markets, it represents an evolving structural consideration for silver that operates independently of industrial demand cycles. Combined with growing ETF demand for physical silver and nascent sovereign wealth diversification into precious metals, the institutional demand vector for silver has multiple potential reinforcing sources over a medium to long-term horizon.
The next major ASX story will hit our subscribers first
A Practical Framework for Monitoring Silver Exposure Decisions
The Three Primary Indicators to Watch
Before adjusting silver exposure in either direction, three macro indicators provide the most reliable forward signal:
- PCE Inflation Data: A softer-than-expected reading reduces September hike probability, improving the industrial demand outlook and supporting ratio compression. A hotter-than-expected reading reinforces the case for tightening and sustains or expands the ratio.
- CME FedWatch September Hike Probability: The critical threshold is 50%. Below this level, silver's macro headwinds ease meaningfully. Above 50%, the industrial demand discount intensifies regardless of physical supply conditions.
- 10-Year Treasury Yield: A sustained decline below 4.60% reduces the opportunity cost of non-yielding silver exposure and signals improving conditions for ratio compression.
Decision Matrix: Adjusting Silver Exposure Based on Macro Signals
| Macro Signal | Bullish for Silver | Bearish for Silver |
|---|---|---|
| PCE Inflation Print | Below expectations | Above expectations |
| September Fed Hike Odds | Below 30% | Above 50% |
| 10-Year Treasury Yield | Sustained decline below 4.60% | Rising above 4.75% |
| Brent Crude | Declining below $80 | Sustained above $85 |
| Gold-Silver Ratio | Compressing below 65:1 | Expanding above 75:1 |
| COMEX Net Speculative Position | Extreme short positioning | Extreme long positioning |
Secondary Indicators That Provide Supplementary Context
- US Dollar Index (DXY): Silver is priced in USD, so dollar strength creates an independent headwind for spot silver prices that compounds the macro rate sensitivity already described.
- Brent crude oil: Functions as a proxy for global industrial demand expectations. Sustained prices above $85 per barrel in the current context signal persistent inflationary pressure that complicates Fed easing scenarios.
- Solar installation data: Given that solar is the largest single industrial sub-segment for silver demand, quarterly solar capacity addition data from major markets including China, the United States, and Europe provides a leading indicator for silver industrial consumption trends.
Key Takeaways: Navigating the Gold-Silver Ratio in a Persistent Deficit Environment
The tension between the gold-silver ratio and silver deficits is not a market inefficiency waiting to be arbitraged. It is the predictable outcome of a metal with a split personality responding to two sets of inputs simultaneously. For a broader view of where both metals are headed, the precious metals outlook provides useful context alongside the deficit and ratio dynamics discussed here.
- The ratio at 70:1 reflects macro sentiment around Federal Reserve policy, not a deterioration in silver's physical supply fundamentals.
- Six consecutive annual deficits totalling approximately 762 million ounces of cumulative inventory drawdown represent a historically significant structural imbalance.
- The 2026 projected deficit of 46.3 million ounces is 15% larger than the 2025 shortfall, indicating the structural gap is widening rather than self-correcting.
- Mine supply cannot meaningfully respond to silver price signals because the majority of production is a byproduct of base metal mining, with development timelines measured in years or decades.
- Institutional price targets from J.P. Morgan at $81 per ounce and the LBMA consensus at $79.57 per ounce imply ratio compression toward 50:1, but realising that compression requires supportive macro conditions.
- The three signals to monitor before adjusting silver exposure are PCE inflation data, CME FedWatch September rate-hike probability relative to the 50% threshold, and the 10-year Treasury yield relative to 4.60%.
- The long-term structural thesis, anchored in solar manufacturing demand, EV adoption, AI infrastructure growth, and secular mine supply decline, remains intact regardless of short-term ratio fluctuations driven by shifting monetary policy expectations.
This article is intended for informational purposes only and does not constitute financial or investment advice. All price targets, forecasts, and scenario projections involve uncertainty and should not be relied upon as guarantees of future performance. Investors should conduct their own due diligence or consult a qualified financial adviser before making investment decisions.
Want to Know When the Next Major Silver Discovery Hits the ASX?
Discovery Alert's proprietary Discovery IQ model scans ASX announcements in real time, instantly identifying significant mineral discoveries — including silver — and translating complex data into actionable investment insights before the broader market reacts. Explore historic discoveries and their returns to understand the potential scale of being early, then start your 14-day free trial at Discovery Alert to position yourself ahead of the next major find.