July 15, 2026
The Dual-Engine Metal: Why Silver's July 2026 Setup Demands a Structural Lens
Most commodities follow a single economic logic. Oil responds to supply and geopolitics. Copper tracks industrial output. Gold moves primarily with real interest rates and monetary sentiment. Silver does all of the above simultaneously, and that complexity is precisely what makes the silver price outlook for July 2026 so analytically rich.
Understanding where silver stands today requires more than reading a price chart. It demands a framework that accounts for two distinct demand engines pulling in potentially different directions, a supply architecture that cannot respond to price signals the way most markets can, and two specific macro catalysts arriving within weeks of each other. Each of these dimensions deserves careful treatment before any price conclusion is drawn.
When big ASX news breaks, our subscribers know first
Silver's Structural Identity: The Metal That Behaves Like Two Different Assets
Why Silver Cannot Be Classified as Simply Monetary or Industrial
Gold is universally understood as a monetary asset. Copper is an industrial barometer. Silver refuses to sit neatly in either category, and that refusal has profound consequences for how the metal prices itself across different economic environments.
Approximately 58% of annual silver consumption is driven by industrial applications, including solar photovoltaic manufacturing, electric vehicle components, semiconductor fabrication, and AI data-centre infrastructure (Silver Institute, World Silver Survey 2026). The remaining demand is primarily monetary, covering investment bars, coins, and exchange-traded products. This split creates what can be described as a demand bifurcation dynamic: the two demand sources can diverge sharply during certain economic phases, converge powerfully during others, and occasionally amplify one another in ways that produce the outsized price moves silver is historically known for.
The practical consequence of this structure is well-documented. Silver's dual nature means it historically moves harder than gold in both directions. During precious metals bull markets, silver tends to significantly outperform gold as both monetary and industrial demand accelerate together. During periods of monetary tightening and growth concern, silver faces a simultaneous hit from two directions: rising real yields compress monetary demand while economic slowdown fears reduce industrial consumption.
This dual-channel vulnerability is not a flaw in silver's investment case; it is a mechanical feature that investors must understand before interpreting any single month's price action.
Key Insight: Silver's 58% industrial demand composition means monetary tightening cycles hit the metal through two simultaneous channels. Rising real yields compress monetary demand while growth fears suppress industrial consumption. Understanding this dual-channel mechanism is essential before interpreting any single month's price action.
Where Silver Stands in July 2026: Reading the Data Correctly
The Correction in Context
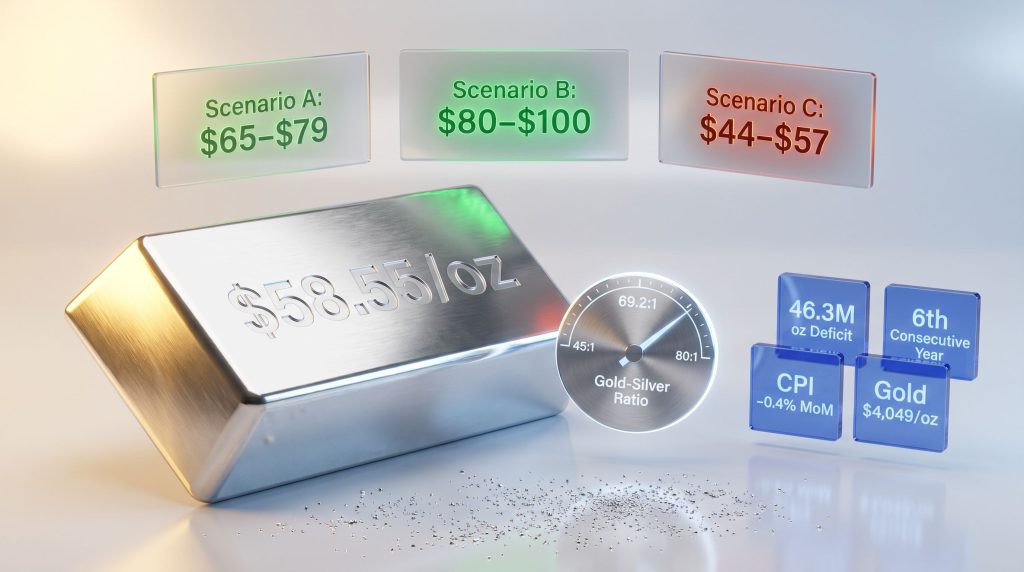
Silver is trading near $58.55 per troy ounce as of July 14, 2026, approximately 52% below the January 2026 all-time high of $121.62. On that date, the intraday range spanned from a low of $56.87 to a high of $59.68, reflecting active volatility around the release of the June Consumer Price Index report (GoldSilver live price data).
A 52% correction from an all-time high is significant by any measure. However, raw percentage declines, taken in isolation, tell only part of the story. Context matters enormously. During the 2011 silver cycle, the metal fell approximately 60% from its April 2011 peak near $49 before eventually recovering and forming part of the base for the next structural advance. The question investors should be asking in July 2026 is not whether the correction is painful but whether the underlying thesis has been invalidated or merely interrupted.
Key Market Metrics at a Glance: July 14, 2026
| Metric | Current Reading | Significance |
|---|---|---|
| Silver Spot Price | ~$58.55/oz | 52% below Jan 2026 ATH of $121.62 |
| Gold-Silver Ratio | 69.2:1 | Near top of 50-year historical range |
| Gold Spot Price | ~$4,049/oz | Reference point for ratio calculations |
| June CPI (YoY) | 3.5% | Down from 4.2% in May — silver-positive |
| June CPI (MoM) | -0.4% | Largest monthly decline since April 2020 |
| Core CPI (YoY) | 2.6% | Down from 2.9% — easing trend emerging |
| Fed Funds Rate | 3.50–3.75% | Held at June FOMC meeting |
| US Gross National Debt | $39.39 trillion | Fiscal constraint on further Fed tightening |
| 2026 Supply Deficit | 46.3M oz | Sixth consecutive annual shortfall |
Sources: Bureau of Labor Statistics (July 14, 2026); Silver Institute / Metals Focus, World Silver Survey 2026; U.S. Treasury Fiscal Data (July 6, 2026); GoldSilver live price charts
What Caused the Decline From the January Peak?
Three traceable and potentially reversible factors drove the correction from $121.62 to current levels:
-
Federal Reserve policy divergence: The June FOMC meeting produced a deeply divided committee. Of 18 officials submitting projections, nine favoured at least one additional rate hike before year-end, eight projected no change, and one projected a cut. This split created maximum policy uncertainty and pushed real Treasury yields higher (Federal Reserve, June 17, 2026).
-
Elevated inflation readings: May CPI printed at 4.2% year-over-year, driven partly by energy disruptions linked to Strait of Hormuz tensions. This reinforced the Fed's hawkish posture and kept real-yield pressure elevated (Bureau of Labor Statistics, June 2026).
-
Industrial demand vulnerability: Silver's significant industrial consumption base made it disproportionately exposed to growth-slowdown fears relative to gold. Furthermore, the gold and silver markets saw the gold-silver ratio widen from approximately 55:1 in May to 69:1 by mid-July, reflecting this relative underperformance.
Critical Distinction: The correction altered the price. It did not alter the supply-demand thesis. These are analytically separate questions that must be evaluated independently.
The Supply Architecture: A Structural Problem That Cannot Be Quickly Solved
Six Consecutive Annual Deficits — and a Widening Gap
The World Silver Survey 2026, published April 15, 2026 by the Silver Institute with research by Metals Focus, confirmed the sixth consecutive annual supply deficit at 46.3 million ounces — wider than the 40.3 million ounce gap recorded in 2025. Since 2021, the cumulative drawdown from above-ground silver stocks has reached an estimated 762 million ounces. Global mine production is projected at approximately 844.1 million ounces, essentially unchanged year-over-year (Silver Institute / Metals Focus, 2026).
These numbers represent a structural reality that price corrections cannot resolve on their own. In addition, these silver supply deficits persist not because mines are failing, but because the entire economics of silver production are governed by forces that operate independently of the silver price itself.
The Byproduct Problem: Why Higher Prices Have Not Generated More Supply
This is one of the least appreciated dynamics in the entire silver market, and it has profound implications for anyone attempting to forecast a supply-side resolution to the deficit.
Approximately 74% of annual silver production is extracted as a byproduct of copper, lead, and zinc mining operations (Silver Institute, 2026). This means the primary economic decision-makers for most of the world's silver supply are base-metal miners who are optimising around copper grades, zinc prices, and lead economics. Silver is incidental to their operating decisions.
The consequences of this structure include:
-
Silver mine production cannot respond elastically to rising silver prices the way primary-mined commodities can
-
When silver prices rise, byproduct producers do not accelerate output because their throughput decisions are driven by the host metal, not the byproduct
-
Only approximately 26% of silver originates from primary silver mines — an insufficient share to meaningfully swing total global output
-
New primary silver mine development takes seven to fifteen years from discovery to production, meaning even a sustained price signal cannot deliver new supply within the current decade
Structural Takeaway: The combination of inelastic, byproduct-dominated supply and structurally growing industrial demand creates a deficit architecture that is unlikely to self-correct within this decade, regardless of near-term price fluctuations.
The Two Macro Triggers Shaping the Silver Price Outlook for July 2026
Trigger 1: The June CPI Report and Its Direct Transmission to Silver
The June 2026 CPI data, released July 14, represented the most significant near-term positive development for silver pricing in several months. The key readings:
-
Headline CPI (YoY): 3.5% — down sharply from 4.2% in May
-
Monthly change: -0.4% — the largest single-month decline since April 2020
-
Core CPI (YoY): 2.6% — down from 2.9%
(Bureau of Labor Statistics, July 14, 2026)
The transmission mechanism from softer inflation to higher silver prices follows a clear logical sequence:
-
Softer inflation data reduces the probability that the Federal Reserve will implement additional rate hikes
-
Lower rate-hike expectations cause real Treasury yields to ease
-
Declining real yields reduce the opportunity cost of holding non-yielding physical silver
-
Reduced opportunity cost supports silver demand from both monetary and institutional investors
-
Increased demand at the margin supports price recovery
This mechanism was not theoretical on July 14. Silver rallied immediately following the CPI release, touching $59.12 intraday before settling near $58.55 — a gain of approximately 1.56% on the day (GoldSilver live price data). That real-time response confirms the transmission channel is actively functioning.
Important Caveat: A single CPI print does not resolve the broader monetary policy uncertainty. The June report is the most significant near-term data point leading into the July FOMC meeting, but it is one input into a multi-variable Fed decision framework.
Trigger 2: The July 28–29 FOMC Meeting — Three Scenarios and Their Silver Implications
The Federal Reserve's July 29 rate decision carries structural importance for precious metals positioning, but it operates differently from meetings that include formal economic projections. Critically, this meeting does not produce a Summary of Economic Projections or an updated dot plot (Federal Reserve). Market attention will consequently concentrate almost entirely on Chair Warsh's press conference language and any signals regarding the September meeting, which does include formal rate forecasts.
The fiscal backdrop adds another layer of complexity to the Fed's decision calculus. US gross national debt stood at $39.39 trillion as of July 6, 2026, with annual interest expense already exceeding $1 trillion (U.S. Treasury Fiscal Data). This fiscal reality creates a structural ceiling on sustained rate increases, as the Treasury's own borrowing costs become a binding constraint on how far the central bank can push rates without creating a self-reinforcing debt spiral.
| FOMC Outcome | Real Yield Implication | Silver Price Direction | Probability Shift Post-June CPI |
|---|---|---|---|
| Hold + Dovish Language | Real yields ease further | Bullish — removes key headwind | Increased |
| Hold + Neutral Language | Real yields stabilise | Neutral to mildly positive | Base case |
| Surprise Hike | Real yields rise | Bearish — extends correction | Reduced |
Reading the Gold-Silver Ratio as a Valuation Signal
What 69.2:1 Actually Means for Silver Positioning
The gold-silver ratio on July 14, 2026 sits at 69.2:1, meaning it takes approximately 69 ounces of silver to purchase one ounce of gold. A thorough gold-silver ratio analysis shows the modern 50-year historical average range falls between 60:1 and 70:1, placing the current reading near the historically elevated end of silver's relative valuation range (GoldSilver price charts).
This is a meaningful signal, though it must be read carefully. The ratio does not tell investors whether silver will rise or fall in absolute terms. It indicates whether silver is cheap or expensive relative to gold. At 69:1, silver is historically undervalued relative to gold. The ratio compressed to approximately 55:1 as recently as May 2026 before the hawkish Fed repricing widened it again, demonstrating how quickly this relationship can shift.
Ratio Compression Scenarios and Implied Silver Price Targets
Using gold at $4,049 per ounce as the reference point:
| Gold-Silver Ratio Scenario | Implied Silver Price | Historical Context |
|---|---|---|
| Current: 69.2:1 | ~$58.50/oz | Near top of 50-year range |
| Compression to 65:1 | ~$62.30/oz | Moderate normalisation |
| Compression to 60:1 | ~$67.50/oz | Return to historical midpoint |
| Compression to 55:1 | ~$73.60/oz | Level reached in May 2026 |
| Compression to 45:1 | ~$90.00/oz | Prior cycle extremes |
Analytical Note: Ratio compression requires a catalyst to materialise. At 69:1, the signal is clear — silver is historically cheap relative to gold. However, relative cheapness alone does not determine timing. The FOMC outcome and continued CPI moderation are the catalysts most likely to trigger meaningful compression.
The next major ASX story will hit our subscribers first
What Major Institutional Analysts Are Forecasting for Silver in 2026
The Consensus Has Not Moved to Match the Price Decline
One of the most notable features of the current silver correction is how the institutional analyst community has responded: they largely have not revised their full-year forecasts lower to match current spot prices. This divergence between price and consensus is analytically significant. For instance, longer-term silver price predictions from a range of analysts continue to reflect optimism well beyond current levels.
| Institution | 2026 Silver Forecast | Scenario Basis |
|---|---|---|
| LBMA (26-analyst consensus) | $79.57/oz average | Full-year survey |
| JPMorgan | $81/oz base / $85 year-end | Industrial demand + Fed pivot |
| HSBC | ~$75/oz | Moderate recovery scenario |
| Goldman Sachs | $85–$100/oz | Strong industrial demand case |
| TD Securities | ~$44/oz | Sustained hawkish Fed (tail risk) |
Sources: LBMA 2026 Annual Precious Metals Forecast Survey; J.P. Morgan Global Research; institutional research notes
The LBMA's 2026 Annual Precious Metals Forecast Survey, drawing on 26 analysts, produced a full-year consensus of $79.57 per ounce (LBMA). JPMorgan's base case sits at $81 per ounce with a year-end target near $85 (J.P. Morgan Global Research). Goldman Sachs identified $85 to $100 as achievable if industrial demand holds at projected levels. TD Securities represents the bear case at approximately $44, a scenario contingent on the Fed sustaining a hawkish posture through the second half of the year.
Not one major institution has revised its full-year average below current spot prices near $58 to $59. The consensus treats the correction as cyclical and price-driven, not as evidence that the structural thesis has changed. Furthermore, reviewing the latest silver price forecasts from independent analysts broadly echoes this institutional consensus.
Three Scenarios for Silver Through H2 2026
Scenario A: Gradual Recovery (Base Case)
-
Fed holds at the July meeting with neutral language; September signals a pause
-
Inflation continues moderating toward the 3.0% range through Q3
-
Industrial demand holds at projected levels; supply deficit persists
-
Implied silver range: $65 to $79/oz by Q4 2026
-
Gold-silver ratio: Compresses toward 60 to 65:1
Scenario B: Accelerated Recovery (Bull Case)
-
Fed pivots to dovish language earlier than expected; rate cut signals emerge at September SEP
-
Industrial demand accelerates, particularly in solar and EV-related silver consumption
-
Supply deficit widens beyond the 46.3 million ounce projection
-
Implied silver range: $80 to $100/oz by year-end
-
Gold-silver ratio: Compresses toward 50 to 55:1
Scenario C: Extended Consolidation (Bear Case)
-
Fed surprises with a July or September hike; inflation re-accelerates
-
Dollar strengthens materially; real yields remain persistently elevated
-
Industrial demand softens on growth concerns
-
Implied silver range: $44 to $57/oz through Q3 2026
-
Gold-silver ratio: Widens toward 75 to 80:1
Technical Levels to Watch in July 2026
The Support and Resistance Architecture
For investors monitoring price action through the remainder of July, the key technical levels are:
-
Key support zone: $56 to $58 — holding above this range suggests the broader bullish structure remains intact
-
First resistance: $65 — must be cleared to signal meaningful recovery momentum
-
Secondary resistance: $68 and $76 — sequential hurdles required to confirm a true bullish breakout
-
July consolidation range consensus: Most technical models expect trading to remain within $54 to $64, governed primarily by dollar strength and ETF flow dynamics
Algorithmic and short-term technical models suggest a potential dip toward $55 to $57 in the second half of July before the FOMC meeting, with the post-decision reaction likely determining whether the month closes in the lower or upper half of the projected range. Consequently, the silver price outlook for July 2026 remains closely tied to developments at that meeting.
Frequently Asked Questions: Silver Price Outlook July 2026
What is the silver price in July 2026?
As of July 14, 2026, silver is trading near $58.55 per troy ounce, with an intraday range of approximately $56.87 to $59.68. The price rose approximately 1.56% on the day following the release of the June CPI report, which showed the largest monthly inflation decline since April 2020 (GoldSilver live price data). Understanding the silver vs gold performance dynamic helps contextualise where this level sits historically.
Why has silver fallen so far from its January 2026 high?
Silver reached an all-time high of $121.62/oz in January 2026 before correcting approximately 52% to current levels. Three primary factors drove the decline: a deeply divided Federal Reserve committee signalling potential further rate hikes, a hot May CPI reading of 4.2% that reinforced hawkish policy expectations, and silver's significant industrial demand exposure making it more sensitive to growth-slowdown fears than gold. None of these factors altered the underlying supply-demand deficit structure.
Is the silver supply deficit still relevant in 2026?
Yes, and it is widening. The World Silver Survey 2026 confirmed a 46.3 million ounce shortfall — the sixth consecutive annual deficit, exceeding the 40.3 million ounce gap recorded in 2025 (Silver Institute / Metals Focus). Cumulative drawdown from above-ground stocks since 2021 has reached an estimated 762 million ounces. The deficit has not been resolved by the price correction.
What does the July 28–29 FOMC meeting mean for silver?
The July 29 Fed decision does not include updated economic projections or a dot plot, making Chair Warsh's press conference language the primary market focus (Federal Reserve). A hold decision with neutral or dovish language would ease real-yield pressure on silver. A surprise rate hike would extend the correction. The June CPI print at 3.5% has already shifted the probability distribution toward a hold outcome (Bureau of Labor Statistics).
Disclaimer: This article is for informational and educational purposes only and does not constitute financial or investment advice. Forecasts and scenario projections involve significant uncertainty and may not reflect actual future performance. All investments, including precious metals, involve risk and may result in partial or total loss. Always consult a qualified financial adviser before making investment decisions.
Want to Catch the Next Major Mineral Discovery Before the Market Does?
Discovery Alert's proprietary Discovery IQ model scans ASX announcements in real time, delivering actionable alerts on significant mineral discoveries — including those across commodities with structural supply dynamics similar to silver — so subscribers can position themselves ahead of the broader market. Explore historic discoveries and their returns to understand the opportunity, then begin your 14-day free trial at Discovery Alert to gain an immediate market-leading edge.