July 10, 2026
The Architecture of a Fractured Market: Understanding Silver's Dual Pricing Reality
Commodity markets have always carried an inherent tension between the financial instruments used to trade them and the physical reality underpinning their value. In most markets, that tension remains manageable. In silver, it has become structural, persistent, and increasingly difficult to ignore. The silver physical shortage and paper market manipulation dynamic represents one of the most significant fault lines in global commodity pricing today.
Understanding this fracture requires looking beyond headline prices and examining the mechanics of how silver is bought, sold, financed, and delivered across the global trading ecosystem. The story that emerges is one of a market operating under extraordinary internal pressure, shaped by five consecutive years of silver supply deficits, a financing system stretched to breaking point, and a growing recognition among sophisticated investors that the paper price and the physical price are telling two very different stories.
When big ASX news breaks, our subscribers know first
Why the Paper Silver Market Dwarfs Physical Reality
The Scale of the Leverage Problem
Most retail investors assume commodity prices reflect supply and demand for the physical commodity itself. In silver, this assumption breaks down almost immediately upon inspection. Daily trading volumes in paper silver instruments, including futures contracts and derivatives, have approached 600 million ounces on active sessions. Against this, annual mine production sits in the range of 830 to 850 million ounces, a figure that has remained essentially flat for a decade.
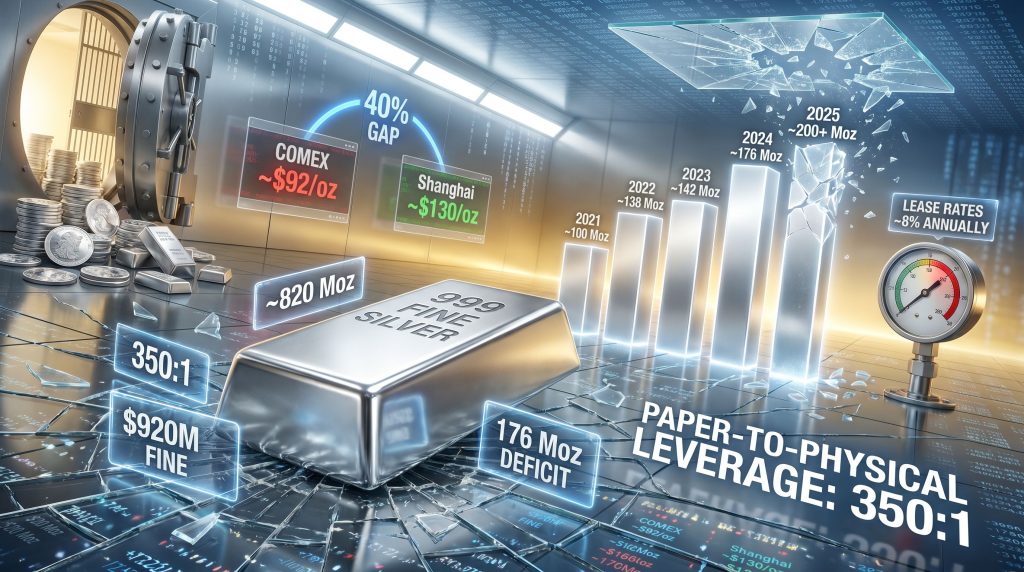
The mismatch is not incidental. It reflects a system where financial instruments tied to silver trade with no requirement for physical backing. Estimates of the leverage ratio between paper claims and real metal have reached as high as 350:1, meaning that for every ounce of deliverable silver, hundreds of paper claims on that metal exist simultaneously. This is sometimes described informally as a fractional reserve silver system, analogous in structure (though not in regulation) to the fractional reserve lending practices of commercial banks.
How Unbacked Short Selling Suppresses Price
The mechanics of price suppression in silver have been documented not just by market commentators but by regulators themselves. Bullion banks operating in futures markets have used large, concentrated short positions to defend price levels, knock out stop-loss orders, and prevent sustained upward breakouts. The technique involves selling contracts for silver that the seller does not hold and has no immediate intention of sourcing physically, with the expectation that prices will fall and contracts can be repurchased at a profit.
This practice became the subject of significant legal scrutiny between 2008 and 2016. The documented regulatory penalties during this period exceeded $1.27 billion across multiple institutions. JP Morgan alone received a fine of $920 million from the US Department of Justice, which characterised the conduct as a large-scale, multi-year effort to manipulate precious metals markets through the systematic use of futures contracts with no physical backing.
The paper system itself has been in place since the 1970s and has proven deeply entrenched. Miners continue to sell into it not because they support the structure, but because of the operational simplicity it provides. Executing a physical sale to an industrial buyer in another jurisdiction requires compliance checks, due diligence processes, and logistical coordination that a phone call to a bullion bank in New York does not. A company can receive payment within two to three days through the paper channel; finding and credentialing a direct physical buyer is a far more resource-intensive process.
Five Years of Structural Deficit: The Demand Reality Accumulating Beneath the Surface
The Supply-Demand Gap by Year
The silver market has now recorded structural supply deficits for at least five consecutive years. Cumulative shortfalls across this period have reached an estimated 820 million ounces, a figure that dwarfs what even a significant production ramp-up could rapidly offset. The trajectory of those deficits reflects the broadening industrial demand base for silver across multiple high-growth sectors. Furthermore, silver's dual role as both a monetary metal and an industrial input makes supply shortfalls particularly difficult to resolve quickly.
| Year | Estimated Deficit (Moz) | Key Demand Driver |
|---|---|---|
| 2021 | ~100 | Industrial recovery post-COVID |
| 2022 | ~138 | Solar PV expansion |
| 2023 | ~142 | EV manufacturing surge |
| 2024 | ~176 | AI infrastructure + industrial |
| 2025 (proj.) | ~200+ | Nuclear, robotics, electronics |
Why Mining Cannot Simply Respond to Higher Prices
A persistent misconception about commodity markets is that higher prices will automatically stimulate additional supply. In most manufacturing industries, this is broadly true. In silver mining, it is not, at least not within meaningful timeframes.
Mine supply has remained anchored in the 830 to 850 million ounce annual range for roughly a decade despite significant price volatility. Bringing a new silver mine into production requires permitting cycles that typically span years, substantial capital deployment into exploration and development, and geological success that cannot be engineered through price incentives alone. The industry has effectively demonstrated that it cannot grow production in response to price signals with any speed that matches the demand curve it now faces.
As one industry veteran with over two decades in primary silver production has observed, if a manufacturer of consumer goods could suddenly sell its products at twice the prior year's price, output would expand rapidly. The mining sector does not function that way. Production volumes are constrained by geology, infrastructure, permitting, and time, none of which respond to a price signal within a single commodity cycle.
To illustrate the scale of the problem: closing the current annual deficit through new mine production alone would require approximately ten new operations of the scale produced by major primary silver producers. That is not a one or two year undertaking.
Reading the Physical Stress Signals: What the Market Is Actually Saying
Backwardation, Lease Rates, and Vault Drawdowns
Several market indicators have flashed warning signals about physical silver availability in recent periods. Taken individually, each can be explained away. However, taken together, they paint a picture of a market operating under genuine physical stress. Indeed, silver backwardation signals of this nature have historically preceded significant pricing dislocations.
-
Silver backwardation occurs when the spot price exceeds the forward price for future delivery. This is unusual in commodity markets and signals that buyers value immediate physical possession more highly than future claims. Silver entered its deepest backwardation conditions since the 1980s during the most recent period of price stress.
-
Lease rate spikes in London reached approximately 8% annually at peak stress points, compared to historically subdued levels in prior years. Lease rates measure the cost of borrowing physical silver, and a sharp upward spike directly reflects tightening availability of loanable metal.
-
COMEX vault drawdowns accelerated markedly during the stress period, with reports of approximately 33.45 million ounces exiting registered inventories within a seven-day window.
-
Shanghai premiums over London pricing reached double-digit percentage levels and at peak, the gap between Chinese domestic silver pricing and COMEX paper pricing approached 40%, representing a 40% real-world premium that buyers were willing to pay for physical metal over paper contract exposure.
| Indicator | Paper Market Signal | Physical Market Reality |
|---|---|---|
| Price (approx.) | ~$92/oz (COMEX) | ~$130/oz (Shanghai) |
| Lease Rates | Historically low | Spiked to ~8% annually |
| Vault Inventory | Reported as stable | Accelerating drawdowns |
| Settlement | Cash-settled default | Physical delivery demanded |
| Backwardation | Rare | Deepest since 1980s |
Industrial Buyers Moving to Forward-Purchase Strategies
One less-discussed consequence of the physical tightness has been a shift in procurement behaviour among industrial consumers. Manufacturers who had previously purchased silver on a spot basis or through rolling short-term contracts began forward-buying to secure confirmed future supply. This behaviour, driven by anxiety about availability rather than price speculation, adds a self-reinforcing layer of demand pressure to an already deficit market.
The Credit System Breakdown: How Financing Constraints Amplified the Crunch
The Leverage Inversion in Trading Finance
One of the least publicly understood dynamics of the 2024–2025 silver stress period involves the financing model used by commodity trading intermediaries. These firms typically operate with fixed credit facilities from banking counterparties, using that capital to purchase physical metal from producers and on-sell it to industrial consumers.
The problem that emerges as prices rise is a direct compression of tradeable volume:
A trader operating with a $250 million credit facility at $25 per ounce silver can finance approximately 10 million ounces of metal. At $100 per ounce, that same facility covers only 2.5 million ounces, representing a 75% reduction in market-making capacity at precisely the moment physical demand is surging.
This dynamic is not theoretical. Producers with their own mints and vault capacity reported receiving calls from buyers willing to pay spot premiums for immediate physical delivery, with payment clearing within hours of the transaction being agreed verbally. The urgency behind those calls reflected a system where normal intermediary channels had become constrained or had ceased functioning entirely.
The Refinery Financing Ceiling
The credit compression problem extended downstream to the refining sector. Refineries that had previously extended informal credit to retail silver dealers, accepting inbound physical metal and issuing payment before processing was complete, found themselves unable to continue this practice as their own banking credit limits were reached.
Retail dealers who purchased silver from walk-in customers found that their traditional refinery contacts could no longer accept new inbound metal, having exhausted their balance sheet capacity. The result was a gridlock condition across multiple layers of the supply chain simultaneously, creating the type of systemic stress that does not show up clearly in paper market prices until it has already reached acute levels.
China's Role: Manufacturing Demand, Not Speculation
Why the World's Largest Silver Consumer Does Not Export
China's position in the global silver market is frequently discussed in terms of speculative stockpiling, but the more substantive explanation is simpler: China manufactures an enormous proportion of the world's silver-intensive products and retains its silver supply to feed that manufacturing base.
China is the world's largest electric vehicle manufacturer. It dominates global electronics production across categories including smartphones, computers, and household appliances. Solar panel manufacturing, another silver-intensive process, is also concentrated heavily in China. The combination of these industries creates a structural domestic demand for silver that consistently absorbs available supply before any export consideration arises.
The persistent Shanghai premium over Western pricing is best understood not as a speculative premium but as a manufacturing necessity premium. Buyers in China are paying above London and COMEX prices because they need the metal for active production, not because they are betting on future price appreciation.
The opacity of China's internal silver data creates additional uncertainty for Western market participants. Unlike gold, where central bank holdings are reported and tracked, Chinese silver consumption and inventory data within the manufacturing sector is not fully transparent to external analysts, making it difficult to model true demand precisely.
The next major ASX story will hit our subscribers first
Scenario Analysis: Could the Paper Market Actually Break?
Four Pathways to Structural Repricing
The question of whether the paper silver market can continue to price the metal below physical reality indefinitely is central to the long-term investment thesis. Consequently, several scenarios could accelerate a structural repricing, and understanding silver squeeze dynamics is essential context for each of them.
-
Coordinated physical delivery demand exhausts COMEX registered inventories, forcing cash settlement defaults that expose the leverage ratio to public scrutiny and trigger a confidence collapse in paper pricing mechanisms.
-
Asian buyers refuse cash settlement, insisting on physical delivery of contracted metal and creating a fracture point where the paper and physical markets must reconcile.
-
Mining industry collective action, modelled on the uranium sector's coordinated producer behaviour, where miners refuse to sell at paper prices and demand physical market premiums. This has been discussed but not meaningfully implemented, primarily because the operational convenience of the paper system remains difficult to abandon at the individual company level.
-
Institutional capital rotation from equities into hard assets, potentially accelerated by a correction in overvalued technology stocks. The historical precedent is instructive: when the NASDAQ reached its peak in March 2000 and subsequently corrected approximately 80% over the following three years, the mining sector entered a bull market that ran from roughly 2002 to 2012, delivering significant returns across both physical metals and mining equities.
The Gold-to-Silver Ratio and the Mining Production Argument
Two Ratios, Two Very Different Conclusions
A thorough gold-silver ratio analysis is the metric most commonly cited when assessing silver's relative value. At approximately 67:1, the current ratio sits above the long-run historical average of around 54:1, suggesting silver remains undervalued relative to gold on this measure. Normalising to the historical average at a gold price of $3,200 per ounce would place silver in the range of $59 to $93 per ounce.
However, a separate metric, the mining production ratio, offers a more structurally grounded perspective. The global mining industry produces approximately 8 ounces of silver for every 1 ounce of gold. If silver were to trade at the mining ratio, the implied price at $3,200 gold would be approximately $400 per ounce, a figure that reflects the geological reality of relative scarcity rather than the historical trading habits of financial markets.
| Ratio Type | Current Level | Historical Benchmark | Implied Silver Price (at $3,200 gold) |
|---|---|---|---|
| Market (Gold:Silver) | ~67:1 | ~54:1 (long-run avg) | ~$59 (current) vs. ~$59–$93 (normalised) |
| Mining Production Ratio | 8:1 | 8:1 (stable) | ~$400 (theoretical) |
The mining ratio argument is not widely discussed in mainstream financial commentary but represents a compelling framework for understanding why silver's price, even at recent highs, may not have reflected its fundamental scarcity relative to gold.
Physical Silver vs. Mining Equities: An Honest Risk-Return Assessment
What Each Asset Class Actually Provides
For investors seeking exposure to the silver thesis, the choice between physical metal and mining equities involves a genuine trade-off rather than a clear hierarchy. Analysts at Investing.com have noted how physical demand is increasingly challenging traditional pricing mechanisms, adding further complexity to this decision.
Physical silver provides:
- Zero counterparty risk once held directly
- Simplicity of ownership with no operational complexity
- No exposure to management quality, geological risk, or balance sheet leverage
- Lower potential upside compared to equities in a bull market
Silver mining equities provide:
- Leveraged exposure to the silver price through operating margins
- Potential for significant capital appreciation in strong markets
- Exposure to management quality, which can be either a benefit or a risk
- Dividend income from established producers
- Genuine risk of capital loss through operational failure, geological disappointment, or financial distress
Institutional investors have historically defaulted to index products such as GDX and GDXJ rather than selecting individual miners, primarily because the due diligence burden of evaluating individual companies is prohibitive given the specialist knowledge required. This dynamic means that a large pool of institutional capital has historically entered the sector at cycle peaks through index products, sold at cycle troughs, and repeated the cycle.
A structured entry approach, deploying capital in approximately 10% tranches over a six to twelve month period, reduces timing risk in highly volatile commodity markets. Disciplined profit-taking at three times and five times the entry price preserves capital while retaining exposure to further upside. By the time a position has returned five times the original investment, returning the full initial capital and holding the remainder as a cost-free position removes the psychological burden of drawdown risk on the remaining exposure.
Frequently Asked Questions: Silver Physical Shortage and Paper Market Manipulation
What is the difference between paper silver and physical silver?
Paper silver refers to financial contracts, primarily futures and derivatives, that provide price exposure to silver without requiring ownership or delivery of actual metal. Physical silver involves direct ownership of the commodity itself. The critical distinction is counterparty risk: paper silver contracts depend on the solvency and delivery capability of the issuing institution, while physical silver carries no such dependency.
Why can't silver miners simply produce more metal to meet demand?
Mine development timelines, permitting requirements, and geological constraints mean that production cannot respond to price signals within short timeframes. Annual global mine supply has remained essentially flat at 830 to 850 million ounces for approximately a decade despite significant price appreciation, demonstrating that the supply response mechanism in silver mining operates far more slowly than in most other industries.
What does silver backwardation mean and why does it matter?
Backwardation occurs when the current spot price exceeds the price for future delivery. In silver, this is historically unusual and signals that market participants place significant value on immediate physical possession. Deep backwardation, as observed during recent stress periods, indicates that physical supply is genuinely constrained relative to current demand.
How do bullion banks manipulate the silver price?
Through the use of large concentrated short positions in futures markets, selling contracts for metal that is not held or sourced physically. The objective is to suppress prices below technically significant levels, trigger stop-loss orders, and profit from subsequent price declines. This practice has resulted in over $1.27 billion in regulatory fines across multiple institutions between 2008 and 2016.
Is it safer to own physical silver or silver mining stocks?
Physical silver carries no counterparty risk and no operational risk but provides lower leveraged upside. Mining stocks offer greater price leverage but expose investors to company-specific risks including management quality, geological outcomes, financing conditions, and jurisdictional factors. Both have a role in a diversified portfolio constructed around the silver physical shortage and paper market manipulation thesis.
What would cause the paper silver market to collapse?
A sufficiently large demand for physical delivery against existing paper contracts, combined with an inability to source that metal at prevailing prices, would force a reconciliation between paper and physical pricing. This scenario came meaningfully close to occurring during the November 2024 to February 2025 stress period, when lease rates, backwardation, and vault drawdowns all signalled acute physical tightness simultaneously.
Why is China paying a premium for physical silver?
China's premium reflects manufacturing necessity. As the world's largest producer of electric vehicles, electronics, and solar panels, Chinese industry requires physical silver for active production. The country does not export silver, meaning domestic supply must satisfy domestic industrial demand, creating structural price premiums over Western markets where paper pricing remains dominant.
What is the gold-to-silver ratio and does it predict future silver prices?
The ratio measures how many ounces of silver are required to purchase one ounce of gold. At historical averages near 54:1, silver appears undervalued relative to gold at current ratios around 67:1. The mining production ratio of 8:1 offers a more fundamental benchmark but implies a silver price far above current market levels. Neither ratio is a precise predictive tool, but both suggest that silver's current pricing does not fully reflect its relative scarcity or industrial criticality. Furthermore, commentary from TradingKey's 2026 analysis reinforces the view that this undervaluation may be approaching a decisive inflection point.
Key Takeaways: The Structural Case for Silver in a Fracturing Market
-
Global silver deficits have compounded to approximately 820 million ounces over five years with no supply-side relief in sight
-
The paper-to-physical leverage ratio of approximately 350:1 represents a systemic fragility that physical demand events can rapidly expose
-
Regulatory history confirms deliberate price suppression through unbacked short selling, with over $1.27 billion in documented fines across the 2008 to 2016 period
-
The Shanghai-COMEX price gap of approximately 40% serves as a real-time indicator of paper market detachment from physical pricing reality
-
Mine supply has been structurally flat for a decade at 830 to 850 million ounces annually with no meaningful capacity growth response to higher prices
-
Institutional capital remains largely absent from the sector, representing a potential future demand catalyst rather than a current price driver
-
The financing constraint dynamic, where higher silver prices reduce tradeable volume by up to 75% under fixed credit facilities, represents an under-appreciated systemic vulnerability that accelerates physical market stress
-
The mining production ratio of 8:1 silver to gold provides a fundamentals-based framework for long-term price discovery that differs substantially from current market pricing, reinforcing the broader case around silver physical shortage and paper market manipulation
Disclaimer: This article is for informational and educational purposes only and does not constitute financial, investment, or professional advice. The silver market involves significant volatility and risk. All forecasts, projections, and scenario analyses presented are speculative in nature and should not be relied upon as predictions of future performance. Readers should conduct their own due diligence and consult qualified financial advisors before making any investment decisions. Past performance is not indicative of future results.
Want to Know When the Next Major Silver Discovery Hits the ASX?
Discovery Alert's proprietary Discovery IQ model scans ASX announcements in real time, instantly notifying subscribers of significant mineral discoveries — including silver — and translating complex data into clear, actionable opportunities before the broader market reacts. Start your 14-day free trial today and see why major discoveries, like those documented on Discovery Alert's dedicated discoveries page, have historically generated extraordinary returns for investors positioned early.