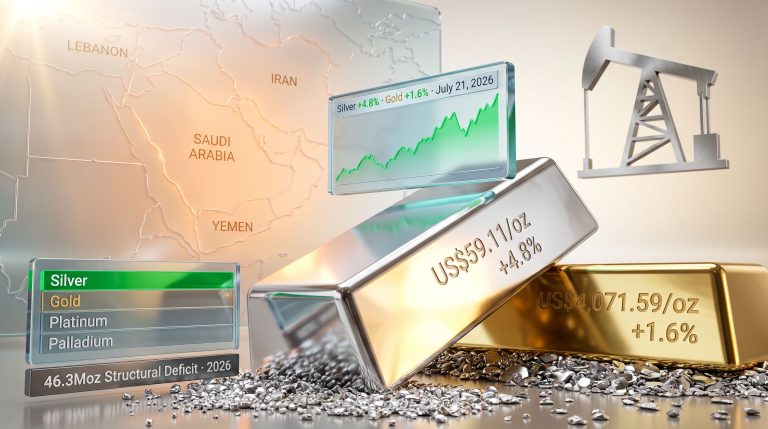
July 21, 2026
What's Driving the Silver Investment Renaissance in 2026?
Investment psychology around precious metals rarely follows rational patterns, yet the silver market in 2026 presents a compelling case study in how investor sentiment can shift from euphoric speculation to strategic accumulation within weeks. Understanding these psychological dynamics becomes crucial as rising investment in silver reaches levels not seen since the commodity supercycle peaks of previous decades.
The current environment reflects a market grappling with multiple competing narratives: speculative momentum driven by social media and retail platforms, fundamental supply constraints creating scarcity premiums, and institutional recognition that structural deficits may persist longer than traditional economic models suggest.
When big ASX news breaks, our subscribers know first
Market Psychology Shifts from Panic to Strategic Accumulation
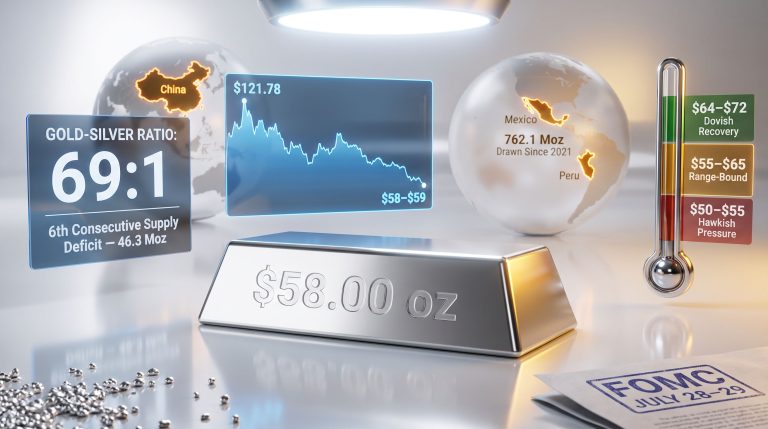
The January 2026 trading period exemplified the extreme psychological volatility inherent in precious metals markets. Silver's advance to a record high of $121.60 per troy ounce on January 29 represented the culmination of frenzied retail buying activity that had been building throughout 2025's 147% annual gain.
The subsequent correction to current levels around $81 per ounce created distinct psychological camps among investors. Early participants who entered during the $100-$121 range experienced the psychological trauma of rapid wealth destruction, while value-oriented investors viewed the correction as validation of their patience in waiting for more attractive entry points.
Technical analysis reveals that the $77-$78 support zone has emerged as a psychological anchor point where disciplined accumulation strategies are replacing momentum-driven speculation. This transition reflects a maturing of investor psychology from fear-of-missing-out dynamics to fundamental thesis validation.
The 33% correction from peak to current levels demonstrates silver's capacity for extreme volatility. However, when considering the broader context of a potential silver market squeeze, the stabilisation around $81 suggests institutional and sophisticated retail investors are treating these price swings as opportunities rather than risk factors.
The Affordability Factor: Silver as Gold's Accessible Alternative
Gold-to-silver ratio compression has created a compelling relative value proposition that extends beyond simple price comparisons. When silver trades at $81 and gold approaches historical highs, the psychological barriers that previously limited retail participation begin to dissolve.
This affordability thesis gains particular strength when examined against wage inflation and savings patterns. A typical retail investor can acquire meaningful silver positions with monthly investment amounts that would purchase only fractional gold exposure.
The marketing narrative of silver as the "poor man's gold" has gained renewed relevance as traditional safe haven assets like Treasury securities and blue-chip stocks fail to provide inflation protection. Silver's 14% year-to-date gain through mid-February positions it as outperforming most traditional defensive asset classes.
Psychological research in behavioural finance suggests that investors prefer owning whole units rather than fractional shares. This makes silver's lower per-ounce price psychologically attractive compared to gold's four-figure pricing, particularly when examining silver vs. gold trends over recent periods.
How Supply Constraints Are Reshaping Investment Demand
Supply-demand fundamentals in commodity markets typically follow predictable patterns where higher prices incentivise increased production. Silver's structural characteristics break this conventional model through a combination of geological constraints and industrial dependencies that create persistent supply bottlenecks.
The Fifth Consecutive Deficit Year Reality
The Silver Institute has documented that global silver markets are experiencing their sixth consecutive year of structural deficit. Global silver investment remains strong, with 2026 projections indicating a 67 million ounce shortage. This extends a pattern of supply shortfalls that began in 2021, creating cumulative inventory drawdowns that must eventually be reconciled through either price increases or demand destruction.
Mine production is forecast to increase by merely 1% to 820 million ounces despite silver prices having more than doubled from recent lows. This production inelasticity reflects fundamental constraints in how silver supply responds to price signals.
The modest production response occurs because approximately 70% of silver supply emerges as a byproduct of primary copper, gold, and zinc mining operations. Expanding silver supply therefore requires developing entirely new mineral deposits, obtaining regulatory approvals, and constructing production facilities across development timelines spanning 7-15 years.
Total global silver supply is projected to reach 1.05 billion ounces in 2026, representing a 1.5% increase to a decade high. However, this supply growth pales compared to the 20% surge in physical investment demand, creating mathematical pressure on available inventory and highlighting persistent silver supply deficits.
Industrial Competition Creating Investment Urgency
Industrial silver consumption presents a complex dynamic where technological advancement both increases and decreases demand simultaneously. Total industrial fabrication is forecast to decline 2% to 650 million ounces in 2026, reaching a four-year low despite robust industrial activity levels.
This decline reflects active substitution efforts in the photovoltaic sector, where manufacturers are developing silver-alternative technologies to reduce material costs. Chinese solar panel producers have made substantial progress in reducing silver content per unit of installed capacity through copper busbar technologies and alternative electrical contact materials.
However, electronics manufacturing, medical applications, and emerging technologies continue driving silver demand growth. The net result creates competition between industrial users and investment demand for available supply, with industrial users often demonstrating greater price sensitivity.
The industrial role of silver continues to evolve as manufacturers balance cost pressures against performance requirements. Recycling has emerged as a critical supply source, with volumes projected to exceed 200 million ounces for the first time since 2012, representing a 7% increase. This recycling surge reflects the economic incentive created by higher prices and improved collection infrastructure for end-of-life silver recovery.
Which Investment Vehicles Are Capturing Rising Silver Demand?
Investment vehicle selection in the silver market reflects risk tolerance, storage capacity, and liquidity preferences among different investor segments. Physical bullion remains the foundation strategy for long-term holders, while financial instruments provide exposure without storage complexity.
Physical Bullion: The Foundation Strategy
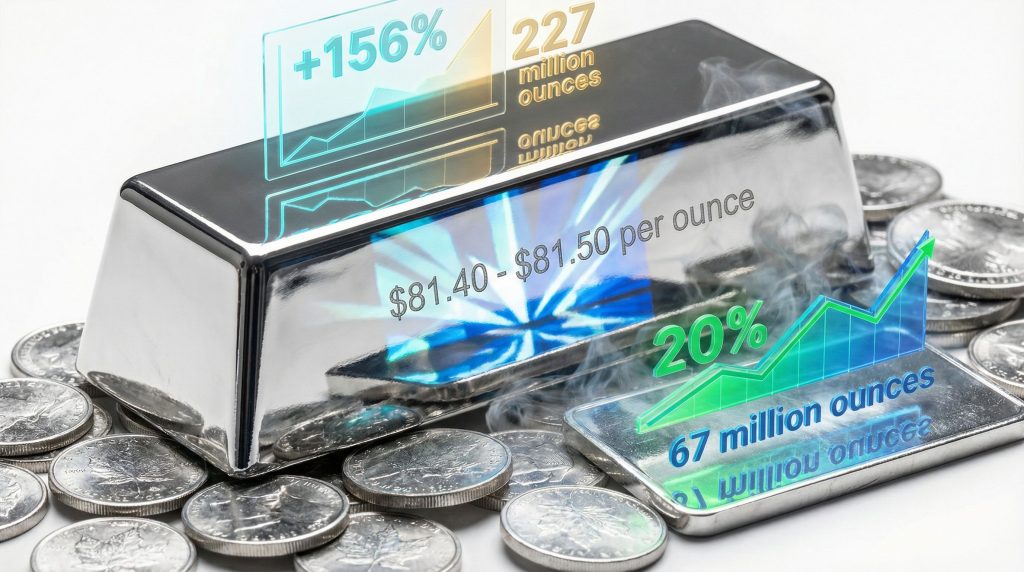
Physical silver investment demand is experiencing unprecedented growth, with projections showing a 20% increase to 227 million ounces in 2026. This represents a three-year high and marks the recovery of Western demand after three consecutive years of decline.
| Investment Vehicle | 2026 Demand Share | Primary Advantages | Key Limitations |
|---|---|---|---|
| Physical Coins/Bars | 40% of new flows | No counterparty risk, inflation hedge | Storage costs, liquidity constraints |
| Silver ETFs (SLV, PSLV) | 35% of institutional allocation | High liquidity, professional storage | Management fees, potential tracking error |
| Mining Equities | 20% of speculative capital | Operational leverage to silver prices | Company-specific risks, operational challenges |
| Futures/Derivatives | 5% of sophisticated traders | Capital efficiency, hedging capability | Margin requirements, contract rollover complexity |
The preference for physical bullion reflects investor concerns about counterparty risk in financial instruments and desire for direct ownership of precious metals. Coin and bar premiums have compressed from pandemic-era highs, making physical acquisition more economically attractive.
Professional storage services have expanded capacity and reduced costs, addressing traditional barriers to physical ownership. Allocated storage programmes now offer institutional-grade security with segregated inventory verification.
Geographic Investment Patterns and Premiums
Regional demand patterns reveal significant geographic concentration in silver investment activity. Rising investment is keeping global silver demand steady, particularly in Asian markets like China and India, which demonstrate consistent physical demand despite price volatility. Western markets show more cyclical investment behaviour.
Shanghai Exchange premiums over London spot prices indicate strong regional demand, with spreads reaching $8-$12 per ounce during periods of elevated buying activity. These premiums reflect logistical constraints, import regulations, and local demand intensity.
European silver investment has accelerated amid currency debasement concerns and negative real interest rates. German and Swiss investors particularly favour allocated storage programmes that provide direct ownership rights without physical possession complexity.
North American demand recovery follows a three-year period of declining investment interest. Retail platforms report substantial increases in account openings and average transaction sizes, suggesting broader participation beyond traditional precious metals investors.
What Price Targets Are Driving Investment Decisions?
Price target methodologies in silver analysis range from conservative technical projections to aggressive scenarios based on monetary system stress assumptions. Understanding these different forecasting frameworks helps explain investment decision-making across various investor segments.
Conservative vs. Aggressive Forecasting Models
Conservative institutional price targets reflect traditional supply-demand modelling with risk adjustments for industrial substitution and economic downturns. Major investment banks maintain $56-$65 target ranges for 2026, incorporating base case scenarios for industrial demand and mine production growth.
These conservative estimates assume that current supply constraints will moderate as higher prices incentivise exploration and development activities. They also factor in potential demand destruction from continued industrial substitution efforts, particularly in photovoltaic applications.
Aggressive retail investment scenarios project targets of $100-$135 based on deficit accumulation mathematics and historical precedent analysis. These projections assume that structural deficits will compound over multiple years, creating inventory shortfalls that require substantial price increases to balance supply and demand.
Ultra-bullish scenarios targeting $200+ incorporate monetary system stress assumptions where silver functions as currency alternative during potential financial system instability. These projections often reference historical gold-silver ratios and purchasing power preservation arguments.
Breakout Level Psychology and Investment Triggers
Technical analysis identifies the $93-$100 resistance zone as a critical psychological barrier that could trigger institutional fear-of-missing-out behaviour. Historical precedent suggests that sustained moves above previous resistance levels often accelerate as momentum algorithms and systematic trading strategies engage.
The January peak at $121.60 established a new technical reference point that reframes investor psychology around what constitutes "expensive" versus "reasonable" silver pricing. Corrections from extreme levels often create new support zones that become launching points for subsequent advances.
Options market activity reveals significant open interest concentrations at $100 and $150 strike prices. This suggests these levels represent important psychological targets for speculative positioning, indicating a potential market transformation in silver dynamics. Institutional option strategies often cluster around round numbers that become self-fulfilling resistance and support levels.
How Are Portfolio Managers Incorporating Silver Allocations?
Professional portfolio management approaches to silver allocation reflect the metal's unique characteristics as both industrial commodity and monetary asset. Strategic allocation frameworks must account for silver's extreme volatility while capturing potential for outsized returns during precious metals bull markets.
Strategic Asset Allocation Frameworks
Modern portfolio theory applications to precious metals typically recommend 3-7% total portfolio allocation to gold and silver combined, with silver comprising 20-30% of total precious metals exposure. This framework balances volatility concerns with diversification benefits.
Conservative wealth preservation strategies often employ 80/20 gold-to-silver allocation ratios. These recognise silver's higher volatility while capturing upside potential during precious metals advances. This approach provides stability through gold while maintaining silver exposure for performance enhancement.
Risk parity models weight silver allocations based on volatility-adjusted contributions to portfolio risk. Given silver's 156% annual volatility, these models typically limit silver to 1-3% of total portfolio weight while maximising diversification benefits.
Tactical allocation strategies adjust silver exposure based on technical momentum, supply-demand metrics, and relative value versus gold. These approaches may range from 0-10% allocation depending on market conditions and opportunity assessment.
Risk Management in High-Volatility Environment
Position sizing in silver requires careful consideration of the metal's tendency toward extreme price movements. Professional managers typically employ volatility-adjusted position limits that prevent silver allocations from overwhelming portfolio risk budgets during periods of high correlation with equity markets.
Correlation analysis reveals that silver's relationship with traditional asset classes varies significantly across market cycles. During risk-off periods, silver may demonstrate positive correlation with equities, while serving as currency hedge during inflation episodes.
Hedging strategies for large silver positions include protective put options, covered call writing, and futures-based collar strategies. These approaches allow managers to maintain long-term exposure while limiting downside risk during volatile periods.
Stop-loss disciplines prove challenging in silver due to frequent gap movements and overnight volatility. Many professional managers prefer partial profit-taking on strength rather than rigid stop-loss orders that may trigger at inappropriate price levels.
The next major ASX story will hit our subscribers first
What Risks Could Derail the Silver Investment Thesis?
Investment thesis validation requires honest assessment of factors that could undermine silver's fundamental outlook. Understanding these risk factors enables more informed decision-making and appropriate position sizing for uncertain outcomes.
Industrial Substitution Threats
Technological advancement in silver-alternative materials represents the most significant long-term threat to industrial demand growth. Chinese manufacturers have made substantial progress in developing silver-free solar panel technologies that could reduce photovoltaic sector consumption by 30-50% over the next decade.
Electronics miniaturisation trends generally increase silver demand per unit of production. However, breakthrough technologies in conductive materials could disrupt this relationship. Graphene, copper-based alternatives, and printed circuit innovations may reduce silver requirements in high-volume applications.
Medical and antimicrobial applications demonstrate strong demand growth. Nevertheless, regulatory changes or alternative sterilisation technologies could impact this market segment. Cost-driven substitution accelerates when silver prices exceed threshold levels where alternative materials become economically attractive.
The photovoltaic sector substitution efforts mentioned by the Silver Institute highlight how rapid technological change can alter demand projections. If silver-reduced solar panels achieve commercial scale deployment, this could eliminate millions of ounces of annual demand.
Market Structure Vulnerabilities
Silver's relatively small market size compared to gold creates vulnerability to large position liquidations and concentrated selling pressure. Exchange-traded fund redemptions during market stress can amplify price volatility and create feedback loops that accelerate declines.
Regulatory changes affecting precious metals investment vehicles could limit accessibility for retail investors. Tax policy modifications, storage regulations, or reporting requirements might reduce investment demand growth rates.
Extreme economic stress scenarios could drive silver demand destruction across multiple categories simultaneously. During severe recessions, both industrial and investment demand typically decline, overwhelming supply reductions from mine closures.
Market liquidity concerns arise during high volatility periods when bid-ask spreads widen and transaction costs increase. Small market size means that institutional selling can create disproportionate price impacts compared to larger commodity markets.
Investment Timing Strategies for Silver's Current Cycle
Successful silver investment timing requires understanding the metal's cyclical behaviour patterns and identifying optimal entry points within volatile trading ranges. Current market conditions present both opportunities and timing challenges for different investor types.
Technical Entry Points and Dollar-Cost Averaging
Technical analysis identifies several key support and resistance levels that influence timing decisions. The $77-$78 support zone represents a critical area where institutional accumulation appears to be occurring, while resistance levels at $93-$100 mark previous breakout attempts.
Dollar-cost averaging strategies help smooth the impact of silver's extreme volatility while building positions over extended timeframes. Monthly purchase programmes allow investors to benefit from price fluctuations without attempting to time perfect entry points.
Volatility-adjusted position building involves increasing purchase amounts during high volatility periods when prices are likely oversold. Conversely, it involves reducing purchases during low volatility periods that may precede breakouts.
Support level identification through technical analysis suggests that $70-$75 represents strong downside support based on previous trading ranges and Fibonacci retracement levels from the January peak.
Long-Term Investment Horizon Planning
Multi-year supply deficit projections suggest that rising investment in silver may continue as structural imbalances persist. Six consecutive years of deficits indicate systemic rather than cyclical supply-demand relationships.
Infrastructure investment cycles supporting renewable energy deployment provide long-term demand underpinning despite substitution efforts. Global electrification trends generally support silver demand growth across multiple industrial applications.
Monetary policy transitions away from ultra-low interest rates may impact precious metals valuations. However, currency debasement concerns often override interest rate considerations during inflationary periods.
Investment horizon planning should account for silver's tendency toward multi-year bull and bear market cycles. Historical patterns suggest that major price advances often persist for 3-7 years before significant corrections occur.
Furthermore, the continuing rising investment in silver reflects both institutional recognition of structural supply constraints and retail investor preference for accessible precious metals exposure during uncertain economic conditions.
Key Investment Metrics for 2026
Current Trading Range: $80-$85 per troy ounce
Year-to-Date Performance: +14% (through mid-February)
2025 Annual Performance: +147%
Projected Market Deficit: 67 million ounces
Investment Demand Growth: +20% to 227 million ounces
Mine Production Growth: +1% to 820 million ounces
Total Supply Projection: 1.05 billion ounces
The silver investment landscape in 2026 reflects a market attempting to balance speculative enthusiasm with fundamental supply constraints. While extreme volatility creates timing challenges, structural deficit projections and investment demand growth suggest that rising investment in silver may continue despite periodic corrections.
Understanding the various risk factors, investment vehicles, and timing considerations enables more informed decision-making in this complex market environment. Success likely depends on appropriate position sizing, risk management, and maintaining long-term perspective amid short-term volatility.
Ready to Invest in the Next Major Mineral Discovery?
Discovery Alert instantly alerts investors to significant ASX mineral discoveries using its proprietary Discovery IQ model, turning complex mineral data into actionable insights. Understand why historic discoveries can generate substantial returns by visiting Discovery Alert's dedicated discoveries page and begin your 14-day free trial today to position yourself ahead of the market.