
July 27, 2026
The silver lease rate spike experienced throughout 2024 represented a watershed moment for precious metals markets, revealing fundamental structural weaknesses within traditional bullion banking systems. Furthermore, these unprecedented lease rate movements demonstrated how modern silver market squeeze conditions can overwhelm conventional arbitrage mechanisms. The convergence of industrial demand pressures, monetary policy uncertainties, and technological disruptions created conditions where traditional financial models simply broke down, exposing deeper systemic vulnerabilities.
Understanding these market mechanics requires examining how physical metal availability intersects with financial engineering, particularly when supply constraints force refiners to abandon profitable operations. The October 2024 crisis demonstrated how modern precious metals markets can seize completely when conventional wisdom about scarcity fails to account for systemic monetary pressures affecting global finance.
Understanding Silver Lease Rate Mechanics
Silver lease rates represent the cost of borrowing physical metal for productive uses, but the calculation methods vary dramatically between traditional London markets and modern leasing platforms. In London's dollar-centric system, lease rates derive from complex arbitrage relationships involving LIBOR replacements, forward curves, and interbank lending costs. The mathematical relationship follows a zero-arbitrage principle where lease rate equals the cost of borrowing dollars minus the forward rate premium.
Traditional bullion banks execute simultaneous transactions: borrowing dollars, purchasing physical silver, selling futures contracts, and leasing metal to industrial users. This creates an equilibrium where banks neither profit nor lose from the arbitrage itself, with lease rates serving as the balancing mechanism. However, this system depends critically on stable interbank lending markets and predictable forward curves.
Modern Leasing Platform Innovations
Contemporary leasing platforms operate under fundamentally different principles, bypassing dollar-based arbitrage entirely. These systems connect metal owners directly with industrial users through transparent rate-setting mechanisms. For instance, platforms operated by fintech companies start with minimal rates and increase incrementally until sufficient metal supply emerges to meet demand.
Current market conditions demonstrate this difference starkly. While traditional systems offer institutional depositors rates around 0.2%, modern platforms provide retail investors with 4% returns on silver leases. This 2,000% differential highlights the friction and inefficiency embedded within conventional bullion banking structures.
The technological advantage extends beyond rate transparency. Modern platforms enable retail participation with as little as 10 ounces of silver, democratizing access to markets previously reserved for institutions with millions in assets under management.
When big ASX news breaks, our subscribers know first
Historical Context and Rate Progression Analysis
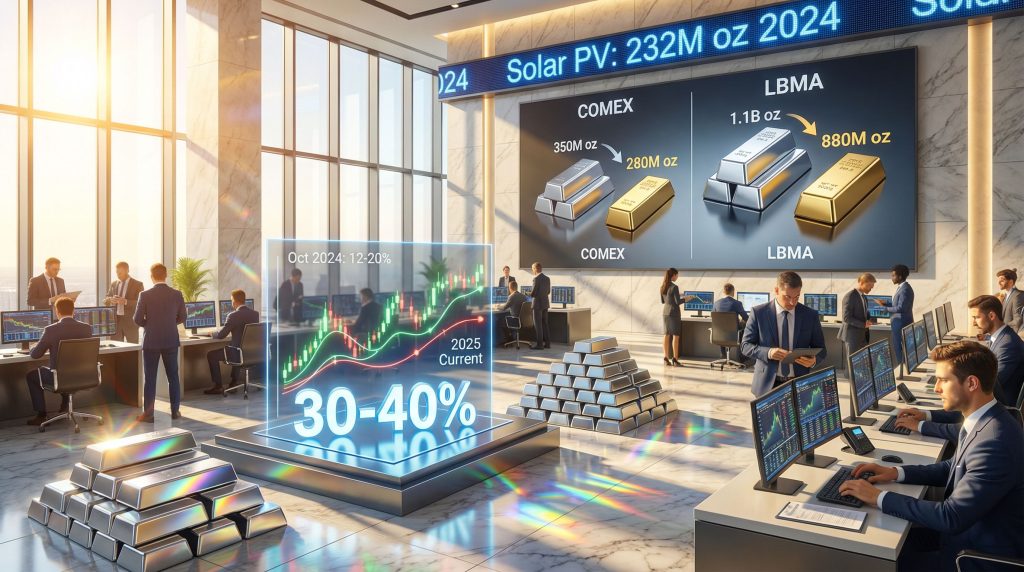
The 2024-2025 silver lease rate crisis unfolded in distinct phases, each revealing different aspects of market stress. Early 2024 rates remained within normal ranges of 2-4%, reflecting standard supply-demand dynamics. However, industrial demand acceleration, particularly from solar photovoltaic manufacturers consuming 232 million ounces annually, began straining available supplies by mid-2024.
Silver Lease Rate Evolution Timeline:
| Period | Rate Range | Market Condition | Duration |
|---|---|---|---|
| Q1 2024 | 2-4% | Stable | 3 months |
| Q2-Q3 2024 | 8-12% | Elevated stress | 6 months |
| October 2024 | 12-20% | Critical shortage | 2 weeks |
| Late 2024 | 8-15% | Gradual normalisation | 2 months |
| 2025 Current | 4-8% | Elevated baseline | Ongoing |
The October 2024 peak represented unprecedented market dysfunction. On October 10th, selling physical silver and purchasing December futures contracts yielded a $2.15 per ounce profit over just two months. This backwardation translated to approximately 12.9% annualised returns, indicating severe physical scarcity that overwhelmed normal arbitrage mechanisms.
Backwardation Signals and Market Psychology
Backwardation occurs when immediate delivery commands premium pricing over future contracts, signalling physical scarcity. The $2.15 arbitrage opportunity should have attracted massive capital to exploit the differential, yet market participants remained hesitant. This hesitancy reflected deeper concerns about delivery capabilities and systemic risks within the silver supply chain.
Traditional economic theory suggests such profitable arbitrage opportunities disappear quickly as traders exploit price differentials. The persistence of extreme backwardation throughout October 2024 revealed structural problems that transcended normal supply-demand imbalances, similar to patterns seen with tariffs and silver pricing disruptions.
Industrial Demand Drivers and Supply Constraints
Silver's industrial applications create unique demand patterns distinct from purely monetary metals like gold. Solar panel manufacturing alone consumed over 232 million ounces in 2024, representing nearly 30% of total annual mine production. Electric vehicle electronics, 5G infrastructure, and medical device applications compound these industrial pressures.
The semiconductor industry's silver consumption has grown particularly rapidly, with each electric vehicle requiring approximately 1-2 ounces of silver for various electrical contacts and components. As global EV production targets approach 30 million vehicles annually by 2030, silver demand from this sector alone could reach 60 million ounces.
The Refinery Economics Paradox
October 2024's crisis exposed a fundamental flaw in silver market structure: scarcity actually disincentivised primary suppliers from increasing production. Refiners typically hedge their metal purchases by selling forward contracts to lock in processing margins. During normal market conditions, forward prices exceed spot prices, providing refiners with modest additional profits on their hedging activities.
However, when backwardation reached $2.15 per ounce, hedging costs soared to 4.5% of the metal's value. With refining margins typically below 1%, refiners faced guaranteed losses on every transaction. This created a perverse situation where metal scarcity prevented the very activities needed to alleviate that scarcity.
"During periods of extreme backwardation, primary silver suppliers face impossible economics where hedging costs exceed processing margins by factors of four or five, creating market paralysis precisely when additional supply is most urgently needed."
Major refineries temporarily suspended silver scrap purchasing programmes, and several facilities reported Tupperware containers filled with old coins and sterling silver items sitting unprocessed due to hedging cost constraints. This inventory backup exacerbated silver supply deficits throughout the distribution chain.
Silver Versus Gold Market Dynamics
While both silver and gold qualify as monetary metals, their market behaviours during stress periods reveal important distinctions. October 2024's silver lease rate spike coincided with stable gold lease rates, demonstrating independent market dynamics despite their shared monetary characteristics.
Gold's near-perfect recycling rate stems from its high per-ounce value, justifying recovery efforts from virtually any source. Silver's lower price point makes recycling economically viable only for high-concentration applications. Discarded electronics containing silver contacts often proceed directly to landfills because extraction costs exceed recovered metal values.
Cultural and Regional Demand Patterns
Indian festival seasons create predictable demand surges for silver jewellery and ceremonial items. During 2024's Diwali period, silver imports increased approximately 25% as high gold prices encouraged substitution toward more affordable precious metals. This cultural preference shift contributed significantly to October's supply stress.
Regional market segmentation means silver shortages can develop unevenly across geographic areas. Asian markets may experience severe constraints while European supplies remain adequate, creating arbitrage opportunities for sophisticated traders capable of managing international logistics.
Regional Silver Market Characteristics:
- India: Cultural demand, price-sensitive substitution from gold
- China: Industrial consumption, government strategic reserves
- North America: Investment demand, technological applications
- Europe: Recycling focus, environmental regulations
Furthermore, understanding gold-silver ratio analysis provides valuable insights into relative value opportunities during periods of market stress.
Investment Strategy Implications
Elevated silver lease rates provide sophisticated investors with multiple strategic opportunities. Backwardation events historically precede significant price appreciation as physical scarcity forces market recognition of supply-demand imbalances. However, timing such investments requires careful monitoring of real-time lease rate data rather than relying on delayed headline coverage.
The $2.15 arbitrage opportunity during October 2024 offered clear risk-adjusted returns for investors capable of executing physical-futures strategies. Such opportunities typically persist for days or weeks before market forces restore equilibrium, requiring rapid decision-making and execution capabilities.
Position Sizing and Risk Management
Backwardation events create asymmetric risk profiles favouring precious metals positions. The downside remains limited by industrial demand floors, while upside potential increases exponentially as physical shortages intensify. Conservative position sizing allows investors to benefit from these dynamics without excessive portfolio volatility.
Exchange-traded funds provide convenient exposure but may lag physical market movements during severe stress periods. Direct ownership of silver bullion offers maximum optionality during supply disruptions, though storage and insurance costs must factor into return calculations.
Investment Vehicle Comparison During Market Stress:
| Vehicle Type | Liquidity | Storage Costs | Stress Performance |
|---|---|---|---|
| Physical Silver | Low | High | Excellent |
| Silver ETFs | High | None | Good |
| Mining Stocks | High | None | Variable |
| Futures Contracts | Very High | None | Complex |
Technology-Driven Market Evolution
Traditional bullion banking systems create multiple layers of friction between metal owners and industrial users. Family offices with substantial precious metals holdings typically receive minimal returns (0.2%) from bank deposits, while industrial users pay significantly higher rates for metal access. This spread represents pure inefficiency that technology platforms are designed to eliminate.
Modern leasing platforms utilise automated matching systems to connect participants directly, reducing middleman fees and improving rate transparency. Real-time data feeds allow dynamic pricing adjustments based on current supply-demand conditions rather than outdated interbank reference rates.
Retail Investor Access Expansion
Historically, precious metals leasing required institutional-scale positions and specialised operational capabilities. Technology platforms now enable retail investors with modest holdings (10+ ounces) to participate in leasing markets previously accessible only to major financial institutions.
This democratisation effect increases the total pool of available metal for leasing while providing individual investors with yield opportunities on their precious metals holdings. The network effects of expanded participation should theoretically improve market efficiency and reduce volatility over time.
In addition, developments in mining innovation trends may help alleviate some supply constraints through improved extraction and processing technologies.
The next major ASX story will hit our subscribers first
Monitoring Tools and Market Intelligence
Successful navigation of volatile silver lease rate spike environments requires access to real-time data sources and analytical frameworks. Delayed or stale information can render trading opportunities obsolete, particularly during rapidly evolving backwardation events.
Professional-grade monitoring systems track lease rates, forward curves, inventory levels, and delivery statistics across multiple exchanges and geographical markets. This comprehensive approach enables early identification of developing stress patterns before they manifest in headline coverage.
Key Performance Indicators for Market Stress
Primary Indicators:
- Lease rate acceleration patterns
- Forward curve inversion depth
- Exchange inventory drawdown rates
- Refinery hedging cost calculations
Secondary Indicators:
- Industrial demand growth rates
- Recycling flow interruptions
- Central bank policy shifts
- Geopolitical risk assessments
Correlation Analysis Requirements:
- Gold-silver lease rate relationships
- Currency volatility impacts
- Interest rate environment changes
- Commodity complex interactions
Additionally, monitoring London's silver market conditions provides crucial insights into global market dynamics, whilst understanding current lease rate analysis helps investors navigate complex market structures.
Risk Assessment and Scenario Planning
Silver market volatility creates both opportunities and dangers for investors unprepared for rapid directional changes. The October 2024 crisis resolved within weeks as normal market mechanisms resumed, but future disruptions could persist longer or intensify further depending on underlying economic conditions.
Scenario planning should consider multiple potential outcomes ranging from quick normalisation to extended supply chain disruptions. Each scenario requires different strategic responses and risk management approaches.
Probability-Weighted Scenario Framework:
- Base Case (60% probability): Gradual normalisation over 3-6 months
- Optimistic Case (20% probability): Rapid resolution within 4-8 weeks
- Stress Case (15% probability): Extended disruption lasting 12+ months
- Crisis Case (5% probability): Systemic breakdown requiring intervention
Hedging Strategies for Different Market Conditions
Conservative investors may prefer to hedge silver exposure during extreme volatility periods, accepting reduced upside potential in exchange for downside protection. Options strategies, currency hedging, and diversification across multiple precious metals can provide risk mitigation without complete market exit.
More aggressive approaches involve increasing silver allocations during backwardation events, reasoning that physical scarcity represents asymmetric risk-reward opportunities. This strategy requires strong conviction and adequate liquidity buffers to withstand potential short-term volatility.
FAQ: Silver Lease Rate Market Dynamics
Why don't gold and silver lease rates always correlate?
Gold and silver serve different economic functions despite both being monetary metals. Silver's extensive industrial applications create demand patterns independent of monetary factors, while gold's primary function as a store of value makes it more sensitive to currency and interest rate dynamics. During October 2024, silver experienced severe physical shortages while gold markets remained stable, demonstrating their distinct supply-demand profiles.
How long do lease rate spikes typically persist?
Historical analysis suggests most lease rate spikes resolve within 2-8 weeks as market mechanisms adapt to new conditions. The October 2024 silver lease rate spike peaked for approximately two weeks before gradually normalising over the following months. However, duration depends heavily on underlying causes: temporary supply disruptions resolve faster than structural demand shifts or monetary system stress.
Can individual investors benefit from lease rate information?
Retail investors can utilise lease rate data for timing precious metals purchases, particularly during backwardation events that historically precede price appreciation. Modern technology platforms also enable direct participation in leasing markets with relatively modest metal holdings (10+ ounces), providing yield opportunities previously available only to institutions.
What distinguishes physical silver shortages from price manipulation?
Genuine physical shortages manifest through multiple simultaneous indicators: elevated lease rates, forward curve backwardation, delivery delays, and refinery hedging cost spikes. Price manipulation typically affects only spot prices without corresponding impacts on physical market infrastructure. The October 2024 crisis displayed all characteristics of authentic supply-demand imbalance rather than financial manipulation.
Disclaimer: This analysis contains forward-looking statements and speculative assessments based on current market conditions. Silver lease rates fluctuate rapidly, and past performance does not guarantee future results. Investors should conduct independent research and consider consulting qualified financial advisors before making investment decisions.
Looking to Position Yourself Ahead of Precious Metals Market Volatility?
Discovery Alert's proprietary Discovery IQ model delivers real-time insights on ASX mineral discoveries, including precious metals companies that could benefit from silver market disruptions and elevated lease rates. Explore Discovery Alert's discoveries page to understand how major mineral discoveries can generate substantial returns, then begin your 30-day free trial to gain a market-leading advantage in identifying actionable opportunities ahead of broader market recognition.