July 8, 2026
The Structural Forces Rewriting Silver's Long-Term Price Story
For most of modern financial history, silver has existed in an awkward middle ground — too industrial to be treated purely as a monetary asset, yet too tied to precious metal sentiment to be valued like copper or zinc. That ambiguity has suppressed institutional coverage, limited retail understanding, and allowed a small number of large financial players to dominate price discovery through the paper derivatives market. What has changed since late 2025 is not the underlying supply-demand imbalance, which has been building for years, but rather the market's forced confrontation with that reality.
Understanding where silver goes from here requires stepping back from short-term price movements and examining the structural mechanics that make this commodity's setup genuinely different from prior cycles.
When big ASX news breaks, our subscribers know first
Why Silver's Supply Side Cannot Respond to Higher Prices
A Production Ceiling That Price Alone Cannot Raise
Global silver mining output has remained essentially flat for a decade, hovering in the range of 850 to 860 million ounces annually. This is not a temporary plateau caused by underinvestment at low prices. It reflects a genuine physical ceiling. The world's primary silver mining base is already operating near full capacity, and the geology required to expand that base significantly simply does not scale quickly.
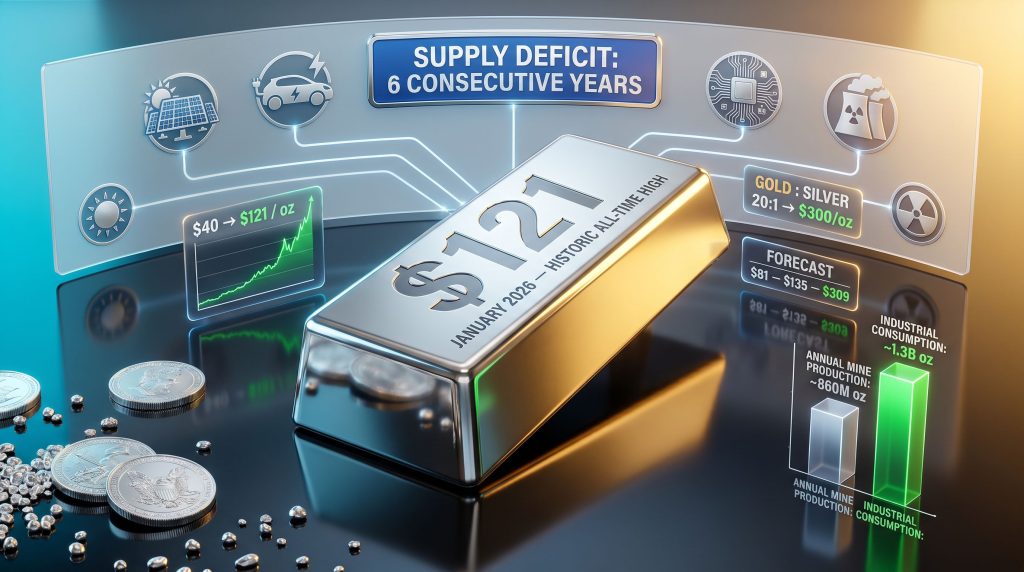
Over the same ten-year period, industrial consumption has surged from approximately 800 million ounces to 1.3 billion ounces per year, creating a structural gap that compounds annually. Furthermore, six consecutive years of supply deficits have drawn down above-ground stockpiles with no credible near-term solution on the production side.
The critical insight here is one that is routinely underestimated in mainstream financial modelling: even if silver were to sustain prices above $100 per ounce indefinitely, the mining sector requires a minimum of ten years before new capital investment translates into meaningful production increases. Exploration, permitting, feasibility studies, construction, and ramp-up timelines are largely immovable regardless of price incentives.
To put the scale of the deficit in concrete terms, filling the current supply gap would require the equivalent of ten large-scale primary silver producers beginning operations simultaneously today. That is not operationally or financially plausible within this decade.
Industrial Demand Has Permanently Redefined Silver's Price Floor
Silver's dual nature as both a precious and industrial metal means its demand base now spans an unusually wide range of high-growth industries:
- Solar panels and photovoltaic manufacturing
- Electric vehicles and associated charging infrastructure
- Consumer electronics, including smartphones, laptops, and household appliances
- AI data centre infrastructure and high-frequency computing hardware
- Robotics and industrial automation systems
- Nuclear energy components
What makes this demand profile structurally significant is its price inelasticity. The volume of silver required to manufacture a solar panel, a microwave, or a semiconductor does not meaningfully change whether silver trades at $30 or $120 per ounce. Industrial end-users absorb price increases rather than substituting away from silver, because no economically viable alternative exists for most of its conductive applications.
Physical demand from these sectors remained structurally unchanged across the full price range experienced during the 2025–2026 rally. That is a fundamentally different demand profile from speculative or monetary demand, which is sensitive to price levels and sentiment shifts.
| Demand Driver | Growth Trajectory | Price Sensitivity |
|---|---|---|
| Solar Panels | High | Very Low |
| Electric Vehicles | High | Very Low |
| Consumer Electronics | Medium-High | Low |
| AI and Data Infrastructure | Emerging, Accelerating | Very Low |
| Robotics and Automation | Emerging | Low |
| Nuclear Energy | Moderate | Low |
| Monetary/Investment Demand | Variable | High |
China has classified silver as a critical industrial metal and moved to restrict silver exports, reducing availability on global markets and tightening the structural supply deficit further. The United States has similarly designated silver a critical mineral, with Canada and the European Union expected to formalise comparable classifications. These are policy frameworks that reflect existing industrial realities rather than creating new demand themselves.
Anatomy of the 2025 to 2026 Silver Rally
What Actually Drove Silver From $40 to $121 Per Ounce?
Silver's price movement from approximately $40 to $121 per ounce across roughly 3.5 months between September 2025 and January 2026 was not a uniform phenomenon. Breaking the move into its component parts reveals a more nuanced and important story.
The initial surge through the psychologically critical $50 per ounce level was driven by genuine physical buying pressure. Real demand for deliverable metal was overwhelming available supply in the spot market — a dynamic that paper derivatives markets struggled to accommodate.
The character of the market shifted materially once prices moved into the $70 to $80 range. From that point to the $121 peak, the dominant force was short covering by major financial institutions. Banks and trading desks that had accumulated substantial concentrated short positions in silver futures were forced to buy back those contracts at escalating losses as the price moved against them.
During the peak stress period, mining companies with physical vault inventory were receiving direct enquiries from institutions in Europe and the United States seeking deliverable metal. This confirms that the paper market had become disconnected from physical reality, and that institutions were scrambling outside normal channels to source metal that could actually be delivered.
The move from $70 to $120 was not primarily the result of new buyers entering the market. It was the result of forced short covering from institutions that had bet heavily against silver and lost. This distinction is critical for understanding whether the price gains were sustainable or speculative in character.
Major exchanges raised margin requirements during the rally — a mechanism that has historically been used to suppress momentum in commodity markets during periods of stress. In addition, the silver squeeze dynamics of this period illustrated just how fragile the existing pricing infrastructure had become.
The Paper Market Distortion That Makes Silver Uniquely Vulnerable to Spikes
An estimated two billion or more ounces of silver trade daily in paper futures and derivatives markets. Annual physical mine production is approximately 860 million ounces. The ratio of paper claims to physical metal is therefore greater than two-to-one on a daily basis relative to annual production.
This structural mismatch is not incidental. It is the mechanism through which short-term price suppression has historically been possible. When physical delivery demand remains manageable, paper contracts can be rolled indefinitely without resolution. However, when physical scarcity becomes acute, as occurred between December 2025 and February 2026, the system faces a stress event that forces rapid non-linear price adjustment.
The Commitment of Traders reports now show that the concentrated short positions that existed prior to the rally have been significantly reduced. The banks that absorbed losses during the short-covering event have, at least temporarily, recalibrated their exposure. This structural shift in institutional positioning may reduce the ceiling on future price suppression, though it does not eliminate it.
The mining sector faces a fundamental asymmetry in this system. Unlike manufacturers of consumer goods who can set product prices to ensure profitability, silver miners are price-takers operating within a market dominated by paper contracts on major exchanges. The price their physical metal receives is determined by a derivatives market that trades multiples of actual annual production every single day.
Industry voices have proposed that primary silver producers establish an independent pricing consortium, selling metal directly between producers and industrial end-users to bypass the derivatives market entirely. The practical barrier is operational convenience — replacing the current system would require competing mining executives to align on structural reform, a historically difficult alignment to achieve.
The Triple Digit Silver Prediction: From Fringe Theory to Market Reality
A Thesis That Took 14 Years to Validate
The triple digit silver prediction was first articulated publicly in 2012, and it was met with significant scepticism at the time. Silver declined sharply in the years that followed, which subjected the original prediction to considerable criticism. However, the underlying supply-demand thesis that supported the forecast remained structurally intact throughout that entire period. The fundamentals did not change; only the timeline extended.
Silver crossing $100 per ounce in January 2026 represented the first time in history that the metal had reached triple digits, having previously peaked near $49.51 per ounce in April 2011. The validation of a 14-year-old structural argument carries significant weight for how analysts should assess current price forecasts. Analysts at GoldSilver have outlined why this milestone carries such historical significance.
The copper market offers a relevant historical analogy. Copper traded near $1.25 per pound in the late 1990s, collapsed to $0.60 in 2000, recovered to $4.50 by 2008, corrected significantly, and now trades near $5.00. It never fully retraced its structural gains. Those who treated the early copper price surge as speculative excess and expected a full retracement were wrong. The structural demand underpinning the move proved durable.
Silver's current consolidation in the $55 to $65 range following the $121 peak may follow a comparable pattern. The argument that sub-$50 silver is unlikely to be seen again within the current commodity cycle is supported by structural deficit data and the precedent of other industrial metals that have undergone permanent price floor resets.
Institutional Forecasts: A Wide Range With an Important Consensus
| Institution / Analyst | Silver Price Target | Timeframe | Key Rationale |
|---|---|---|---|
| BNP Paribas | ~$100/oz | Late 2026 | Secular bull market, supply deficit |
| J.P. Morgan | ~$81/oz average | Full Year 2026 | Conservative structural demand view |
| Bank of America | $135 to $309/oz | Medium-term | Gold ratio compression, industrial demand |
| Independent Analysts | $240 to $260/oz | Mid-2026 accelerated scenario | Bull cycle acceleration |
| Traditional Bank Consensus (pre-rally) | $42 to $65/oz | 2025 | Historical range-based modelling |
It is worth noting that the traditional bank consensus of $42 to $65 per ounce was exceeded by 35% to 58% when silver crossed $100 in January 2026. This systematic underestimation reflects the limitations of conventional financial models when applied to markets experiencing genuine physical scarcity rather than speculative excess.
The Gold-to-Silver Ratio: A Structural Multiplier
Historically, the gold-to-silver ratio has oscillated between 10:1 and 80:1, with long-term averages closer to 15:1 to 20:1. The current ratio remains significantly above historical norms, which ratio compression advocates argue implies substantial upside for silver relative to gold.
At a gold price of $6,000 per ounce and a ratio compression to 20:1, silver would theoretically price at $300 per ounce. Even a conservative ratio of 40:1 at $6,000 gold implies $150 per ounce silver. Ratio compression events have historically been rapid and non-linear, meaning silver can outperform gold by multiples within relatively short timeframes.
It is important to note that these are scenario-based projections, not guarantees. Gold price forecasts and ratio compression timelines carry significant uncertainty, and investors should treat these figures as analytical frameworks rather than investment advice.
Seasonal Patterns and the Psychology of Silver Cycles
Why Does June Weakness Create a Recurring Opportunity Window?
A consistent 30-year seasonal pattern in precious metals and mining equities shows June as historically the weakest month for prices and sector performance. The pattern then shows sideways movement through July and August, with momentum building from September onward. December and January have historically represented the strongest months for metals price appreciation.
Notably, there is no fundamental supply-demand explanation for this seasonal rhythm. It appears to be driven primarily by trader psychology and algorithmic trend-following behaviour. Participants who monitor seasonal charts understand the pattern, position accordingly, and their collective behaviour reinforces it.
Typical Annual Silver Price Cycle (Historical Pattern):
- February to March: Institutional short positioning increases as trend-followers establish bearish positions
- April to June: Price weakness develops and seasonal lows are typically established
- July to August: Sideways consolidation as positioning is absorbed
- September to November: Momentum begins rebuilding as sentiment shifts
- December to January: Peak seasonal strength driven by institutional and retail demand
The practical implication for informed market participants is that the June to August period has historically represented a more favourable entry window than December to January for long-term positioning, even though the latter months generate stronger headline performance.
Monetary Instability as a Dual Demand Driver
Why Silver Occupies a Unique Position in a Reset Scenario
Currency instability and inflationary monetary policy have historically driven capital toward hard assets with tangible utility. Silver occupies a position that no other commodity can fully replicate: it functions simultaneously as a monetary metal with centuries of monetary history and as an indispensable industrial input.
A potential restructuring of the global reserve currency system would likely accelerate silver demand from both institutional and retail investors seeking monetary protection. However, even in a deflationary environment, electronics manufacturing, energy infrastructure, and industrial processes require physical silver regardless of monetary conditions. This dual demand driver makes silver's demand floor more resilient than gold's across a wider range of economic scenarios.
The financial system reset thesis, while speculative in its specific form, is worth taking seriously as a framework for understanding silver's risk-reward profile. Consequently, the exact mechanism of any reset — whether dollar-related, geopolitically driven, or structural — matters less for silver than the broader principle that hard asset demand typically accelerates during periods of monetary regime uncertainty. Silver's industrial demand trajectory further reinforces this point across varying economic conditions.
The next major ASX story will hit our subscribers first
M&A Outlook: When Will Silver Sector Consolidation Accelerate?
Why Is the Industry Waiting Before Moving?
Mining executives who were active during the 2012 to 2015 commodity cycle carry institutional memory of significant asset write-downs that followed acquisitions made at elevated valuations. That experience has produced a cohort of sector leaders who are structurally more conservative than their predecessors, even at current gold and silver price levels.
The current environment of $4,000-plus gold and $50 to $60-plus silver has not yet been sustained long enough for executives to feel confident underwriting large M&A transactions. Industry participants suggest that approximately six months of price stability at current levels would represent the threshold for accelerated consolidation activity.
Investor Consideration: Companies with strong balance sheets, diversified multi-mine production profiles, and demonstrated cash flow generation are best positioned to act as acquirers in the next consolidation wave. Junior explorers and single-asset operators with quality resources may represent the most likely acquisition targets.
The most credible timeline for significant M&A acceleration in the silver sector is 2027 to 2028, not 2026. This is not a bearish signal for the sector. It reflects rational caution from executives who have been through one major write-down cycle and are unwilling to repeat the experience. Furthermore, understanding global silver production constraints helps contextualise why consolidation remains an attractive long-term strategic response.
Frequently Asked Questions: Triple Digit Silver Prediction
What does triple digit silver mean?
Triple digit silver refers to a silver spot price exceeding $100 per ounce. Silver crossed this threshold for the first time in January 2026, establishing a new all-time high having previously peaked near $49.51 per ounce in April 2011.
Why do analysts believe silver will not return to sub-$50 levels?
The structural argument rests on six consecutive years of supply deficits, a physically constrained mining sector producing near its ceiling at 850 to 860 million ounces annually, and permanently elevated industrial demand from the energy transition and technology buildout. The ten-year lead time for meaningful new supply makes the deficit self-reinforcing at current and higher price levels.
What are the highest silver price forecasts for 2026 and beyond?
The most aggressive independent scenarios project silver reaching $240 to $260 per ounce if the current bull cycle accelerates. Bank of America has modelled a range of $135 to $309 per ounce under various scenarios. J.P. Morgan's silver outlook offers a more conservative forecast, averaging approximately $81 per ounce for the full year 2026. These are projections, not guarantees, and carry substantial uncertainty.
How does the paper silver market create price volatility?
An estimated two billion or more ounces of silver trade daily in paper futures and derivatives markets against annual physical production of approximately 860 million ounces. When physical delivery demand spikes and paper contracts cannot be backed by deliverable metal, institutions holding short positions face forced covering, which creates rapid non-linear price increases as demonstrated during the 2025 to 2026 rally.
When is the best seasonal window to consider silver exposure?
Historical 30-year patterns consistently identify June as the weakest month for precious metals and mining equities, followed by sideways consolidation through July and August. The strongest seasonal window has historically been September through January. This pattern appears to be driven by trader psychology and algorithmic behaviour rather than fundamental supply-demand dynamics. Long-range silver forecasts suggest that investors who position during these seasonal troughs may benefit most from the metal's structural upside over a decade-long horizon.
This article is intended for informational and educational purposes only and does not constitute financial or investment advice. All forecasts, price targets, and scenario projections referenced herein involve significant uncertainty and should not be relied upon as predictions of future performance. Readers should conduct their own research and consult qualified financial advisers before making investment decisions.
Want to Be First When the Next Major Silver Discovery Hits the ASX?
Discovery Alert's proprietary Discovery IQ model scans ASX announcements in real time, instantly identifying significant mineral discoveries — including silver — and translating complex data into actionable opportunities for investors at every experience level. Explore historic examples of major discovery returns and begin a 14-day free trial to position yourself ahead of the broader market.