
July 20, 2026
What Drives Silver Price Prediction 2026 Market Dynamics?
The precious metals landscape has transformed dramatically through 2025, with silver emerging as the standout performer among hard assets. While traditional investment wisdom often focuses on gold's monetary characteristics, silver's unique position as both an industrial commodity and store of value creates powerful supply-demand imbalances that drive exceptional price volatility. Understanding these fundamental forces becomes critical when evaluating silver price prediction 2026 scenarios.
Industrial Demand vs. Investment Demand Balance
Silver's dual-nature characteristics generate distinct market behaviour patterns compared to purely monetary metals like gold. According to technical analysis expert Christopher Muan from Technical Traders, this dynamic creates explosive price movements when multiple catalysts align simultaneously. The industrial consumption component provides a baseline demand floor, while investment flows amplify directional moves significantly.
The percentage-based volatility in silver consistently exceeds gold during comparable market conditions. Muan notes that silver moves substantially more during trending periods, reflecting how industrial demand cycles interact with investment sentiment. This amplification effect occurs because industrial users maintain steady consumption regardless of price fluctuations, while investment demand responds to macroeconomic conditions and technical momentum.
Industrial applications typically account for 50-55% of annual silver demand according to United States Geological Survey historical data, with investment demand comprising the remainder through coins, bars, and ETF purchases. However, silver market squeeze insights suggest that 2026 projections remain uncertain pending confirmation of specific industrial adoption rates across emerging technologies.
Supply Deficit Fundamentals
Global silver mining production faces structural constraints that support higher price trajectories through 2026. Primary silver mines represent only a fraction of total output, with approximately 70% of silver production occurring as a byproduct of copper, lead, and zinc mining operations. This creates supply inelasticity when silver prices rise, as miners cannot simply increase silver-specific extraction capacity.
The supply-demand imbalance has widened progressively through 2025, with industrial consumption growth outpacing new mine development. Major producing regions face geological depletion in mature deposits, while environmental regulations have extended permitting timelines for new projects. Political instability in key mining jurisdictions adds additional supply chain risks that support price premiums.
Recycling markets provide secondary supply but cannot offset primary production shortfalls during periods of strong demand growth. Silver's industrial applications often result in permanent consumption, unlike gold which typically returns to above-ground supplies through recycling channels.
Macroeconomic Policy Impact on Precious Metals
Federal Reserve monetary policy represents the primary macroeconomic driver influencing silver price prediction 2026 outcomes. The December 2025 FOMC meeting provided potentially bullish catalysts for precious metals positioning, according to market analysis during the December 8, 2025 recording period.
Lower interest rate environments reduce the opportunity cost of holding non-yielding precious metals assets. When cash yields decline, investors seek alternative stores of value that historically maintain purchasing power during currency debasement periods. Furthermore, tariff impacts on silver demonstrate how silver benefits from this dynamic while also capturing industrial demand growth.
Capital rotation patterns suggest money flows from equity markets during correction phases often migrate toward precious metals as alternative investments. Christopher Muan explains this mechanism: when stock market volatility increases and cash becomes available for redeployment, investors typically move into the best-performing asset classes. Precious metals have demonstrated this performance leadership through 2025.
Currency debasement concerns under expansionary monetary policies create structural demand for hard assets. Silver's accessibility compared to gold prices makes it attractive for smaller investors seeking precious metals exposure as portfolio diversification.
When big ASX news breaks, our subscribers know first
How High Could Silver Prices Reach in 2026?
Silver's explosive performance through 2025 has established new technical parameters for evaluating potential 2026 price targets. From approximately $26.50 per ounce at the start of 2024 to levels above $58-59 by December 2025, silver has delivered remarkable returns that exceed most analyst expectations. This momentum creates the foundation for continued appreciation into 2026.
Conservative Analyst Projections Based on Technical Analysis
Technical analysis provides disciplined methodology for projecting silver price prediction 2026 scenarios based on established chart patterns and mathematical relationships. Christopher Muan's analysis identifies specific near-term targets using Fibonacci extension principles that project forward into early 2026.
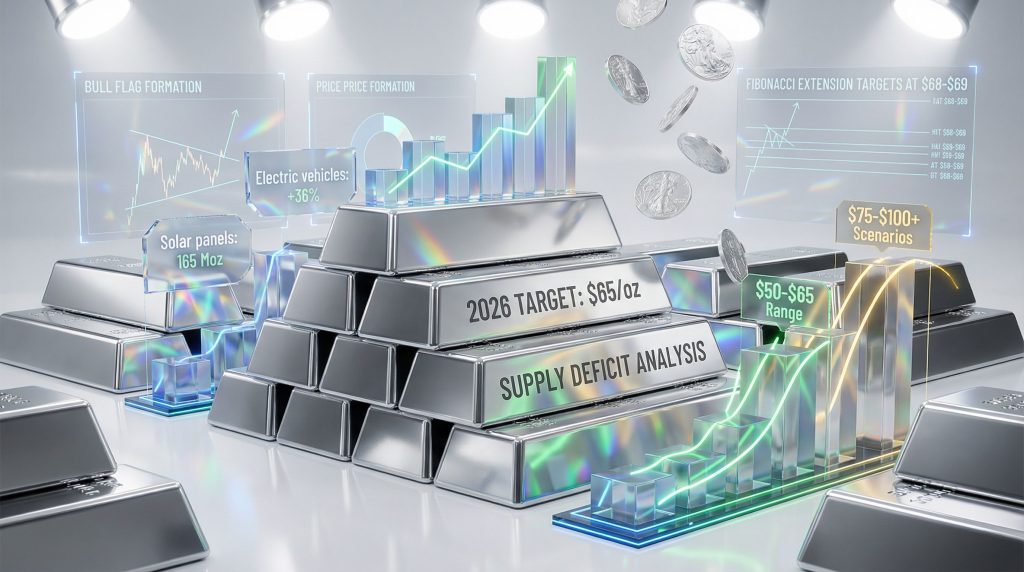
The immediate technical target sits at $64 per ounce, representing approximately 10% upside from December 2025 levels around $58-59. This projection emerges from current bull flag pattern analysis and represents the next logical resistance level based on previous price action.
Extended technical projections point toward $68-69 per ounce, representing 17-18% upside potential based on 100% measured move calculations. Muan explains: "based on this chart pattern, run to about $68, $69 an ounce…this could happen literally within two or three trading sessions based on this chart pattern."
These technical levels assume continuation of current momentum patterns without major macroeconomic disruptions. Conservative projections remain grounded in observable price behaviour rather than speculative scenarios requiring extraordinary circumstances.
Aggressive Bull Case Scenarios for Extended Targets
Historical volatility analysis suggests silver retains significant upside potential beyond conservative technical targets. Annual price bar analysis reveals previous explosive moves including a 149% gain during late 1970s precious metals appreciation cycles. Current market conditions share several characteristics with previous bull market phases.
Christopher Muan notes: "We've never seen a bar…we it'd be interesting to go back here. If we look at these green bars percentage-wise, there was a 149% bar…This bar that we have right now…it still has a lot of potential to be back similar to the late 70s."
Aggressive bull case scenarios requiring silver prices above $75-100 would necessitate extraordinary circumstances including:
• Major currency crisis affecting dollar stability
• Significant industrial demand acceleration beyond consensus forecasts
• Institutional investment demand surge from pension funds and sovereign wealth funds
• Supply disruptions from geopolitical conflicts in major producing regions
In addition to these factors, silver squeeze strategies reveal that without specific catalysts supporting these extreme scenarios, silver price prediction 2026 targets above $70-75 represent speculative positioning rather than probable outcomes based on current fundamental analysis.
What Technical Patterns Signal Silver's 2026 Trajectory?
Technical chart pattern analysis provides the most reliable framework for understanding silver's potential 2026 performance. Current patterns demonstrate characteristics consistent with continued bullish momentum while identifying specific levels for risk management and profit-taking decisions.
Bull Flag Formation Analysis and Pattern Recognition
Silver's December 2025 price action exhibits textbook bull flag characteristics following the explosive move higher through November. This pattern represents temporary consolidation after significant gains, typically indicating trend continuation rather than reversal.
The formation mechanics show a 24% gain over five trading sessions, followed by sideways consolidation around the $58-59 level. Christopher Muan describes the pattern: "we just had this great big pause. We had a big rally up to this level…it's a beautiful big pause, a consolidation, meaning that this is just a little bit of a temporary pause before it goes higher."
Bull flag patterns historically resolve to the upside when volume characteristics and momentum indicators remain supportive. The current pattern suggests breakout potential that could drive silver toward the $68-69 technical targets within weeks rather than months.
High momentum characteristics distinguish this bull flag from typical consolidation patterns. Muan notes: "This is a very high momentum move" indicating accelerated timeframes for pattern resolution compared to standard technical analysis expectations.
Breakout Resistance Levels and Strategic Price Points
Fibonacci extension methodology identifies precise resistance levels that function as strategic decision points for silver price prediction 2026 analysis. These mathematical relationships provide invisible support and resistance zones not apparent through simple chart observation.
Primary Technical Targets:
• $64/oz immediate target: 10% upside potential from current levels, representing next logical resistance
• $68-69/oz extended target: 17-18% upside based on 100% measured move projections
• $52-55 support zone: Fibonacci retracement levels providing buying opportunities during pullbacks
Christopher Muan explains the retracement methodology: "if we use Fibonacci retracement, we could say, well, based on that move, the sweet spot will be between about 52.50 up to about 55.40. So, right around this breakout zone…that would be a healthy pullback range."
These support levels become critical for position management, as they represent areas where technical buyers typically emerge during temporary corrections. Holding above $52 maintains the bullish structure, while breaks below suggest deeper retracement potential.
How Do Seasonal Patterns Affect Silver Prices?
Seasonal analysis suggests December through February periods historically favour precious metals performance. Christopher Muan observes: "we're coming into that time of year…after the first week and a half…of December, we tend to see precious metals want to go higher."
This seasonal tendency combines with year-end portfolio rebalancing flows and institutional positioning adjustments. Holiday period trading often exhibits reduced volume that can amplify price movements when directional momentum exists.
Seasonal Strategy Considerations:
• December-February window: Historical strength period for precious metals
• Reduced trading volume: Can amplify price movements during trend continuation
• Portfolio rebalancing flows: Year-end institutional adjustments affect metal prices
• Holiday demand patterns: Physical silver demand from gift-giving and seasonal purchases
The seasonal overlay supports technical analysis projections by providing additional momentum during typically strong performance periods for precious metals.
Which Industrial Sectors Will Drive Silver Demand in 2026?
Industrial silver consumption represents the fundamental demand driver supporting silver price prediction 2026 scenarios. Unlike gold's primarily monetary function, silver's essential role in manufacturing creates consumption-based demand that cannot be easily substituted or eliminated during price appreciation.
Solar Energy Expansion and Photovoltaic Manufacturing
Solar panel manufacturing represents one of silver's largest and fastest-growing industrial applications. Each photovoltaic cell requires approximately 20 grams of silver for optimal electrical conductivity, creating direct correlation between renewable energy expansion and silver consumption.
Global solar capacity installations continue accelerating under climate change initiatives and energy independence policies. According to silver price forecast analysis, the International Energy Agency projects substantial capacity additions through 2026, though per-panel silver content has declined with manufacturing efficiency improvements.
Solar Sector Demand Dynamics:
• High-conductivity requirements: Silver remains essential for optimal cell efficiency
• Capacity expansion: Global renewable energy installations driving volume growth
• Efficiency improvements: Reduced per-panel silver content partially offsetting volume gains
• Supply chain considerations: Silver availability affects solar panel production costs
Manufacturing optimisation efforts focus on reducing silver content per panel while maintaining performance standards, creating ongoing tension between cost control and electrical efficiency requirements.
Electric Vehicle Battery Technology and Electronics Integration
Electric vehicle manufacturing incorporates silver in multiple applications including battery management systems, charging infrastructure, and electronic control modules. Each EV typically contains 15-28 grams of silver compared to 15-18 grams in traditional internal combustion vehicles.
The expanding EV market creates incremental silver demand growth, though battery chemistry evolution may affect long-term consumption patterns. Solid-state battery development could alter silver requirements as technologies mature through 2026.
EV-Related Silver Applications:
• Battery management systems: Critical safety and performance monitoring
• Charging infrastructure: High-current electrical connections require silver conductivity
• Power electronics: Motor controllers and inverter systems
• Autonomous driving sensors: Advanced electronic systems in self-driving capabilities
5G Infrastructure Buildout and Telecommunications Expansion
Fifth-generation wireless network deployment requires extensive silver usage in base station equipment, antenna arrays, and signal processing components. Each 5G base station contains significantly more silver than previous generation equipment due to higher frequency requirements and signal processing complexity.
Global 5G infrastructure investments continue through 2026 as carriers expand coverage and capacity. Rural area deployments and industrial IoT applications drive additional equipment demand beyond initial urban installations.
5G Infrastructure Silver Requirements:
• Base station components: RF amplifiers and signal processing equipment
• Antenna arrays: Multiple-input multiple-output (MIMO) technology requires extensive silver wiring
• Network switching equipment: High-frequency signal routing and processing
• Edge computing infrastructure: Distributed processing nodes supporting low-latency applications
How Will Supply Constraints Affect Silver Prices?
Silver supply dynamics create structural price support through 2026 as production constraints interact with growing demand across multiple sectors. Understanding these supply-side factors becomes essential for accurate silver price prediction 2026 analysis.
Mine Production Deficit Analysis and Geological Realities
Global silver mining faces fundamental constraints that limit production growth regardless of price incentives. Primary silver mines represent only 30% of total production, with the majority emerging as byproducts from copper, lead, and zinc operations.
This byproduct dependency means silver production cannot respond quickly to price signals, as base metal miners optimise operations for their primary commodities rather than silver content. When copper or lead prices decline, associated silver production may decrease despite strong silver market fundamentals.
Production Constraint Factors:
• Byproduct dependency: 70% of silver production tied to base metal mining economics
• Geological depletion: Mature silver districts showing declining ore grades
• Permitting delays: Environmental regulations extending development timelines 3-7 years
• Capital requirements: New mine development requiring $500M-2B+ investments
Ore grade decline affects production costs and mine longevity across major silver-producing regions. Mexico, Peru, and China face particular challenges with aging deposits requiring deeper extraction and more complex processing methods.
Recycling Market Limitations and Recovery Constraints
Silver recycling cannot offset primary production shortfalls during strong demand periods. Unlike gold, which typically returns to above-ground supplies through jewellery recycling, silver's industrial applications often result in permanent consumption or difficult recovery processes.
Electronic waste represents the largest potential recycling source, but recovery rates remain below 20% due to complex extraction requirements and economic constraints. Medical and photographic applications typically result in complete consumption without recovery potential.
Recycling Challenges:
• Permanent consumption: Industrial applications often prevent silver recovery
• Economic thresholds: Recovery costs exceed silver value in many applications
• Technical complexity: Electronic waste requires sophisticated processing facilities
• Collection logistics: Distributed silver consumption complicates recovery efforts
Strategic Reserve Accumulation and Central Bank Diversification
Several nations have begun including silver in strategic metal reserves alongside traditional gold holdings. This trend reflects recognition of silver's industrial importance and potential supply security concerns during geopolitical tensions.
Central bank diversification away from purely fiat currency reserves includes precious metals allocation increases. While gold remains the primary focus, silver's accessibility and industrial applications attract institutional interest from sovereign wealth funds and pension systems.
Reserve Accumulation Trends:
• National strategic reserves: Countries recognising silver's industrial security importance
• Central bank diversification: Gradual allocation increases beyond traditional gold holdings
• Institutional positioning: Sovereign wealth funds exploring precious metals allocations
• Supply security concerns: Industrial nations ensuring adequate silver availability
India's recognition of silver as acceptable bank loan collateral beginning April 2026 could unlock approximately 25,000 tonnes of household silver reserves, creating unprecedented demand dynamics as families monetise stored silver while banks require additional supplies for lending operations.
What Macroeconomic Factors Support Higher Silver Prices?
Macroeconomic conditions through 2026 create multiple supportive catalysts for silver price appreciation. Understanding these broader economic forces helps evaluate silver price prediction 2026 scenarios within proper context of monetary policy, geopolitical developments, and currency dynamics.
Federal Reserve Policy Trajectory and Interest Rate Environment
Federal Reserve monetary policy represents the primary macroeconomic driver affecting precious metals valuations. Lower interest rate environments reduce opportunity costs associated with holding non-yielding assets like silver, while expansionary monetary policy raises inflation concerns that historically favour hard assets.
The December 2025 FOMC meeting provided potentially supportive policy signals for precious metals, according to market analysis conducted during the meeting period. Rate cut expectations and accommodative forward guidance typically correlate with precious metals strength.
Monetary Policy Implications:
• Opportunity cost reduction: Lower yields make precious metals more attractive relative to bonds
• Currency debasement concerns: Expansionary policy raises purchasing power preservation needs
• Inflation hedge positioning: Historical correlation between loose policy and precious metals performance
• Real interest rates: Negative real yields (nominal rates below inflation) support gold and silver demand
Dollar weakness typically accompanies accommodative Federal Reserve policy, creating additional tailwinds for dollar-denominated commodities like silver. International buyers benefit from currency translation effects during dollar decline periods.
Geopolitical Risk Premium and Safe Haven Dynamics
Global geopolitical tensions create risk premiums that benefit precious metals as portfolio insurance against various tail-risk scenarios. Silver captures both safe haven demand and industrial disruption concerns during international conflicts.
Supply chain security concerns affect silver differently than gold due to industrial consumption requirements. Countries recognise strategic metal importance during potential trade disputes or military conflicts that could disrupt normal commerce patterns.
Geopolitical Risk Factors:
• Trade relationship tensions: Tariff policies affecting global commerce flows
• Currency war potential: Competitive devaluations favouring hard assets
• Supply chain disruptions: Industrial silver availability during international conflicts
• Safe haven positioning: Portfolio insurance demand during uncertainty periods
Regional conflicts in major silver-producing areas create supply disruption risks that support price premiums even without actual production interruptions. Risk perception often drives precious metals demand ahead of fundamental supply impacts.
Central Bank Precious Metal Diversification Trends
Central banks worldwide continue diversifying reserves away from concentrated dollar holdings toward broader asset allocation strategies. While gold receives primary attention, silver's industrial characteristics attract interest from institutions focused on strategic metal security.
Central Bank Trends:
• Reserve diversification: Reducing dollar concentration through precious metals allocation
• Strategic metal recognition: Understanding industrial silver's economic security importance
• Monetary system evolution: Exploring alternatives to purely fiat currency reserves
• Institutional precedent: Major central bank purchases influencing smaller institutions
This institutional demand creates a structural bid for precious metals that supports prices during various market conditions. Central banks typically buy during weakness and hold through strength, providing price stability during volatile periods.
The next major ASX story will hit our subscribers first
Should Investors Consider Silver Mining Stocks for 2026?
Silver mining equities offer leveraged exposure to metal price appreciation while introducing additional operational and financial risks. Evaluating mining stocks for 2026 requires understanding both precious metals fundamentals and company-specific factors affecting individual producers.
GDX Technical Pattern Analysis and Mining Sector Outlook
The VanEck Gold Miners ETF (GDX) provides broad mining sector exposure that correlates with precious metals prices while exhibiting distinct technical characteristics. Christopher Muan's analysis identifies significant upside potential based on established chart patterns.
Current GDX technical patterns suggest targets around the $90 level, representing approximately 13% upside from December 2025 levels. Extended projections based on cup-and-handle formation analysis point toward potential $100+ targets if bullish patterns complete successfully.
GDX Technical Projections:
• Primary target: ~$90 level (13% upside potential)
• Extended target: $100+ based on cup-and-handle pattern completion
• Pattern characteristics: Bull flag formations similar to underlying metals
• Volatility expectations: Mining stocks exhibit amplified price movements versus metals
Christopher Muan explains the technical setup: "this kind of rounding formation. You could argue now this is kind of a little cup and a handle formation with built-in bull flags…about 30-31% if this pattern was to unfold going forward."
Furthermore, the gold-silver ratio insights suggest that mining stocks typically provide leverage to metal price movements, offering potentially higher returns during bull markets while creating greater downside risk during corrections.
Major Silver Producer Outlook and Company Analysis
Primary silver mining companies offer more direct exposure to silver price movements compared to diversified miners focused on other metals. However, individual company analysis requires evaluation of operational factors beyond metal price projections.
Key Evaluation Criteria:
• Production profiles: Annual silver output and growth trajectories
• Cost structures: All-in sustaining costs (AISC) and margin sensitivity to silver prices
• Geographic diversification: Political risk management across mining jurisdictions
• Development pipeline: Future production from exploration and expansion projects
• Financial strength: Balance sheet capacity to fund operations and growth investments
Silver streaming companies provide alternative exposure by purchasing future production at predetermined prices, offering different risk-return characteristics than traditional mining operations.
ETF vs. Physical Silver Considerations for Portfolio Construction
Investors face several options for silver exposure, each with distinct advantages and limitations affecting suitability for different investment objectives and portfolio construction approaches.
Physical Silver Advantages:
• Direct ownership: No counterparty risk or management fees
• Long-term storage: Permanent wealth preservation vehicle
• Privacy considerations: Transactions may offer greater privacy than financial instruments
• Crisis protection: Accessible during financial system disruptions
ETF Advantages:
• Liquidity: Easy buying and selling through brokerage accounts
• Storage elimination: No need for secure storage arrangements
• Fractional ownership: Lower minimum investment requirements
• Tax efficiency: Potential tax advantages versus physical ownership in some jurisdictions
Mining stocks provide leverage but introduce operational risks including production disruptions, regulatory changes, and company-specific management issues not present in direct metal exposure.
What Are the Downside Risks to Silver Price Predictions?
Comprehensive silver price prediction 2026 analysis requires honest evaluation of potential downside scenarios that could prevent bullish targets from materialising. Understanding these risks enables better portfolio construction and risk management decisions.
Economic Recession Scenarios and Demand Destruction
Severe economic recession could simultaneously reduce industrial silver demand while increasing selling pressure from investment holdings liquidated for cash needs. This dual impact creates particularly challenging conditions for precious metals despite traditional safe-haven characteristics.
Industrial demand represents approximately 50% of total silver consumption, making economic activity levels critical for fundamental price support. Manufacturing slowdowns in electronics, automotive, and renewable energy sectors could materially impact consumption patterns.
Recession Risk Factors:
• Industrial demand reduction: Manufacturing slowdowns affecting 50%+ of silver consumption
• Investment liquidation: Forced selling from leveraged positions and cash needs
• Credit market stress: Reduced access to financing for mining operations and inventory financing
• Consumer spending decline: Reduced jewellery and coin demand from discretionary spending cuts
Historical analysis shows precious metals can decline during initial recession phases before recovering as monetary policy responses create currency debasement concerns. Consequently, the silver crash recovery analysis demonstrates how such patterns have evolved over time.
Industrial Demand Slowdown Possibilities and Substitution Threats
Technological advancement could reduce silver requirements in key applications through improved efficiency or alternative materials development. Solar panel manufacturing and electronics represent areas where substitution research continues actively.
Substitution Risk Areas:
• Solar panel efficiency: Reduced silver content per panel through manufacturing improvements
• Electronics miniaturisation: Smaller components requiring less silver per device
• Alternative materials: Copper or aluminium substitution in specific applications
• Recycling improvements: Higher recovery rates reducing primary demand
However, silver's unique electrical and thermal conductivity properties make complete substitution difficult in most applications. Cost considerations typically drive substitution efforts rather than performance improvements.
Technological Substitution Threats and Market Evolution
Emerging technologies could disrupt traditional silver applications while creating new demand sources. Battery technology evolution, wireless power transmission, and advanced manufacturing techniques represent areas of uncertainty for long-term demand projections.
Quantum computing development could eventually reduce traditional electronics demand while potentially creating new silver applications in quantum processors and connectivity systems.
Technology Risk Assessment:
• Battery chemistry evolution: Solid-state batteries potentially altering silver requirements
• Wireless power systems: Reducing physical connection requirements in electronics
• 3D printing advancement: Potentially reducing silver waste and consumption requirements
• Nanotechnology applications: Creating new silver uses while reducing quantity requirements
The timeline for major technological disruptions typically spans 10-20 years, suggesting limited impact on 2026 silver price prediction scenarios.
How to Position for Silver's 2026 Performance?
Strategic positioning for silver price prediction 2026 scenarios requires disciplined approach combining technical analysis insights with proper risk management principles. Successful precious metals investing demands patience and systematic methodology rather than emotional decision-making.
Dollar-Cost Averaging Strategies and Systematic Accumulation
Dollar-cost averaging provides disciplined approach to precious metals accumulation that reduces timing risk while building positions during various market conditions. This methodology proves particularly effective for volatile assets like silver.
Dollar-Cost Averaging Implementation:
• Fixed schedule: Monthly or quarterly purchases regardless of price levels
• Fixed dollar amounts: Consistent investment amounts buying more ounces during price declines
• Automatic execution: Removing emotional decision-making from purchase timing
• Long-term perspective: Building positions over 12-24 month timeframes
This approach captures average prices over time while avoiding the impossible task of perfect market timing. Christopher Muan emphasises: "it's not about so much timing the market. It's about knowing what trajectory and trend it's on and then just taking advantage of it."
Technical Entry Points and Stop Loss Management
Technical analysis provides specific price levels for entry point optimisation and risk management through stop-loss orders. Understanding these levels improves risk-adjusted returns while maintaining discipline during volatile periods.
Strategic Entry Levels:
• Support zone purchases: $52-55 range during pullbacks based on Fibonacci analysis
• Breakout confirmation: Entries above $64 resistance level with momentum confirmation
• Volume validation: Ensuring adequate trading volume accompanies price movements
• Multiple timeframe confirmation: Daily and weekly chart alignment for higher probability setups
Risk Management Principles:
• Position sizing: Limited exposure to individual trades (2-5% of portfolio maximum)
• Stop-loss placement: Below key support levels identified through technical analysis
• Profit-taking discipline: Partial position reduction at technical target levels
• Trend following: Maintaining positions while uptrend remains intact across timeframes
Portfolio Allocation Recommendations and Risk Assessment
Financial advisors typically recommend 5-10% precious metals allocation within diversified portfolios, with silver comprising 25-40% of precious metals holdings due to industrial demand characteristics and higher volatility potential.
Allocation Framework:
• Conservative allocation: 3-5% total portfolio in precious metals
• Moderate allocation: 5-8% precious metals allocation for balanced risk tolerance
• Aggressive allocation: 8-12% for investors with higher risk tolerance and inflation concerns
• Silver proportion: 25-40% of precious metals allocation (remainder in gold)
Risk Tolerance Considerations:
• Conservative investors: Focus on physical silver and established ETFs
• Moderate risk investors: Combination of physical metals and quality mining stocks
• Aggressive investors: Higher mining stock allocation and potential options strategies
• Speculation capital: Separate allocation for higher-risk mining exploration companies
Portfolio construction should account for correlation with other assets during stress periods, as precious metals may not provide diversification benefits during certain market conditions.
What Does Expert Analysis Predict for Silver in 2026?
Silver's technical, fundamental, and macroeconomic outlook supports continued appreciation potential through 2026 while acknowledging substantial risks that could derail bullish scenarios. Investors must weigh these competing factors when making allocation decisions.
The technical analysis foundation provides $64-69 price targets based on established chart patterns and Fibonacci relationships. These projections represent reasonable extensions of current momentum rather than speculative scenarios requiring extraordinary circumstances. According to market insights from DeVere Group, such technical projections align with broader industry expectations for precious metals performance through 2026.
Industrial demand growth from solar energy, electric vehicles, and 5G infrastructure creates fundamental support for higher prices, though economic recession could temporarily reduce consumption. Supply constraints from mining production limitations provide additional price support during demand strength periods.
Macroeconomic conditions including Federal Reserve policy, geopolitical tensions, and currency dynamics generally favour precious metals through 2026. However, rapid economic growth with rising interest rates could reduce precious metals attractiveness relative to yielding assets.
Key Success Factors for Bullish Silver Price Prediction 2026:
• Technical momentum continuation: Breakout above $64 resistance with volume confirmation
• Industrial demand stability: Continued expansion in solar, EV, and technology applications
• Accommodative monetary policy: Federal Reserve maintaining lower interest rate environment
• Supply constraint persistence: Mining production unable to meet growing demand requirements
Primary Risk Factors:
• Economic recession impact: Simultaneous industrial demand reduction and investment liquidation
• Interest rate shock: Rapid monetary tightening making bonds more attractive than metals
• Technological disruption: Significant silver substitution in major applications
• Market speculation excess: Bubble formation leading to eventual correction
Christopher Muan's perspective emphasises patience and trend-following discipline: "you just have to ride the trend. We're in the perfect environment for precious metals to go higher…you just have to let it mature. It could take three weeks. It could take three months."
This measured approach acknowledges silver's explosive potential while maintaining realistic expectations about timing and risk management requirements for successful precious metals investing through 2026. Consequently, investors should consider both the substantial opportunities and inherent risks when positioning for silver's 2026 performance trajectory.
Want to Capitalise on Silver's 2026 Price Potential?
Discovery Alert's proprietary Discovery IQ model delivers instant notifications on significant ASX mineral discoveries, including precious metals opportunities that could benefit from silver's projected momentum. Explore how major mineral discoveries have historically generated substantial returns by visiting Discovery Alert's dedicated discoveries page, and begin your 30-day free trial today to position yourself ahead of the market.