
June 5, 2026
The complex dynamics driving silver price prediction models require careful examination of both industrial demand patterns and monetary policy influences that create unique volatility characteristics in precious metals markets. Furthermore, understanding these interconnected factors becomes essential for investors seeking to position portfolios effectively during potential multi-year market cycles.
Industrial consumption patterns reveal critical insights into silver's unique position within global supply chains, while central bank monetary policies continue reshaping precious metals valuations through liquidity injection mechanisms. Moreover, the silver market squeeze impact on global finance demonstrates how supply-demand imbalances can create amplified price movements across economic cycles.
What Drives Silver Price Volatility in Modern Markets?
Industrial Demand vs. Investment Speculation Balance
Silver's distinctive characteristics as both industrial commodity and store of value create price dynamics fundamentally different from pure precious metals. According to the Silver Institute's 2024 Market Report, industrial applications accounted for approximately 55% of global silver demand in 2023, with photovoltaic solar applications representing the fastest-growing segment at 26% of industrial demand.
The photovoltaic manufacturing sector consumed approximately 91 million ounces of silver in 2023, representing a year-over-year increase of 8-12% driven by continued global renewable energy deployment. Consequently, this industrial demand concentration creates both upside potential and vulnerability to economic downturns that could reduce capital expenditure on renewable infrastructure projects.
Key industrial consumption breakdown:
- Photovoltaics (PV): Primary end-use, utilizing 0.5-1.5 grams per solar cell
- Electronics and electrical contacts: Represents approximately 18% of industrial demand
- Jewelry and silverware: Comprises roughly 7% of total demand
- Photography and other uses: Remaining demand segments
The correlation between silver prices and solar installation rates demonstrates demand elasticity during economic stress periods. When capital becomes constrained, renewable energy projects face deferral risks, potentially creating temporary demand destruction scenarios that amplify silver's price volatility beyond investment-driven movements.
During 2020-2021, solar panel installations surged 23% globally despite pandemic disruptions, according to Trading Economics commodity data. This industrial demand expansion occurred simultaneously with investment demand, creating a dual-driver scenario that supported silver price appreciation throughout the monetary expansion period.
Central Bank Policy Impact on Precious Metal Valuations
Federal Reserve policy decisions continue influencing precious metals through multiple transmission mechanisms beyond traditional interest rate effects. The expansion of the M2 money supply from $16.7 trillion in 2021 to $20.8 trillion by 2024 represents a 24% expansion over 36 months, creating monetary base effects that support hard asset valuations.
Historical precedent analysis reveals consistent patterns between monetary expansion cycles and precious metals performance. Following the 2008 financial crisis, Federal Reserve balance sheet expansion from $900 billion to $4.5 trillion by 2014 coincided with:
- Gold appreciation of 260% ($750→$1,900) over seven years
- Silver appreciation of 440% ($9→$49.84) over seven years
- Both metals experiencing intermediate 40-50% corrections during this period
Current real yield conditions provide context for precious metals positioning. Ten-year TIPS yields approximately 1.5-2.0% represent significantly positive real returns compared to the negative real yield environment during 2021-2022, when inflation peaked at 6.0% while nominal yields remained suppressed.
Quantitative easing transmission effects include:
- Currency debasement pressures supporting alternative monetary assets
- Portfolio rebalancing toward inflation hedges during uncertainty periods
- Liquidity injection timing correlating with commodity sector rotations
- Central bank gold-silver dynamics affecting global dollar liquidity conditions
When big ASX news breaks, our subscribers know first
How Do Market Cycles Influence Silver Price Trajectories?
Four-Year Economic Cycle Analysis Framework
Economic cycle theory suggests predictable patterns in asset class performance, though empirical evidence reveals more complex relationships than simple four-year frameworks. The National Bureau of Economic Research documents that U.S. post-WWII economic cycles have averaged 69 months in length, with significant variation ranging from 18 months to 128 months.
Market analysts propose that stock market corrections trigger central bank policy responses, creating favorable conditions for commodity sector rotations. The most recent significant S&P 500 correction occurred in September-October 2022, representing a decline of approximately 27% from peak levels. Therefore, cyclical analysis suggests monitoring for potential policy responses during similar correction phases.
Wall of Worry maintenance principles:
- Periodic corrections preserve healthy scepticism within bull markets
- Parabolic phases typically indicate final stages before major reversals
- Public participation phases correlate with bull market maturation
- Sentiment extremes provide contrarian positioning opportunities
The preservation of periodic corrections rather than purely parabolic advancement extends bull market longevity through multiple mechanisms. Historical precious metals bull markets demonstrate this pattern, with the 2008-2011 gold bull market maintaining periodic 10-20% corrections while the 2015-2020 gold bull market experienced 8-15% interim pullbacks.
ABC correction pattern recognition involves:
- Wave A: Initial decline from intermediate peak
- Wave B: Bounce/recovery phase
- Wave C: Secondary decline, often breaching Wave A lows
Gold-Silver Ratio as Market Timing Indicator
The gold-silver ratio currently trades in the 65-75:1 range, significantly elevated compared to historical bull market compression levels. During previous precious metals bull market peaks, this ratio compressed to 20-30:1, indicating silver's outperformance during late-cycle phases.
Historical ratio benchmarks provide timing context:
- Bull market compression target: 20-30:1
- Pre-2000 baseline levels: 30-40:1
- Current elevated levels: 65-75:1
- Extreme stress readings: 80-100:1 (typically marking major lows)
Ratio compression scenarios suggest significant silver outperformance potential during bull market maturation phases. Mathematical relationships indicate that gold reaching $10,000 per ounce with ratio compression to 30:1 would target $333 silver, while compression to 20:1 would target $500 silver. Detailed gold-silver ratio analysis provides additional insight into these market timing indicators.
Strategic positioning based on ratio movements involves monitoring both absolute price levels and relative performance metrics. Risk management through ratio-based indicators provides objective criteria for profit-taking decisions during potential bubble phases.
What Are Professional Forecasts for Silver Prices Through 2026?
Conservative Institutional Consensus
Professional silver price prediction models reflect varying methodologies and assumption sets across institutional research platforms. The World Bank's "Commodity Markets Outlook" (October 2024) projects silver prices averaging $27-$32 per ounce through 2026, representing institutional consensus expectations based on supply-demand fundamentals.
Reuters polling of commodity analysts indicates consensus ranges significantly below bullish individual predictions:
- Short-term consensus (12 months): $28-$32/oz
- Medium-term consensus (24 months): $30-$35/oz
- Outlier bullish cases: $40-$50/oz by 2026
These institutional forecasts typically emphasise supply-demand balance analysis while incorporating economic growth assumptions and industrial demand projections. Conservative modelling approaches often underweight monetary policy impacts and potential bubble dynamics that could drive prices beyond fundamental valuation metrics.
Factors supporting institutional conservatism:
- Historical volatility creating wide confidence intervals
- Industrial demand sensitivity to economic cycles
- Supply response potential from higher price levels
- Regulatory and substitution risks in key applications
Bullish Analyst Scenarios and Rationale
Independent analysts present significantly more optimistic silver price prediction scenarios based on monetary and cyclical analysis frameworks. These projections incorporate potential supply deficits, monetary debasement effects, and technical breakout patterns that could drive prices substantially higher.
Supply deficit projections suggest:
- Annual production totaling 840 million ounces in 2023
- Industrial demand growth of 3-4% annually through 2026
- Solar PV installations driving 6-8% annual demand increases
- Secondary recycling capturing only 25-30% of available scrap
Primary silver production faces constraints as most silver emerges as byproduct of copper and zinc mining operations. New dedicated silver mining capacity requires substantial capital investment with multi-year development timelines, limiting supply response elasticity to higher price levels.
The Silver Institute projects demand growth driven by:
- Solar photovoltaic expansion: Primary growth driver
- Electronics sector recovery: Moderate growth expectations
- Photography decline continuation: Secular headwind
- Investment demand variability: Economic cycle dependent
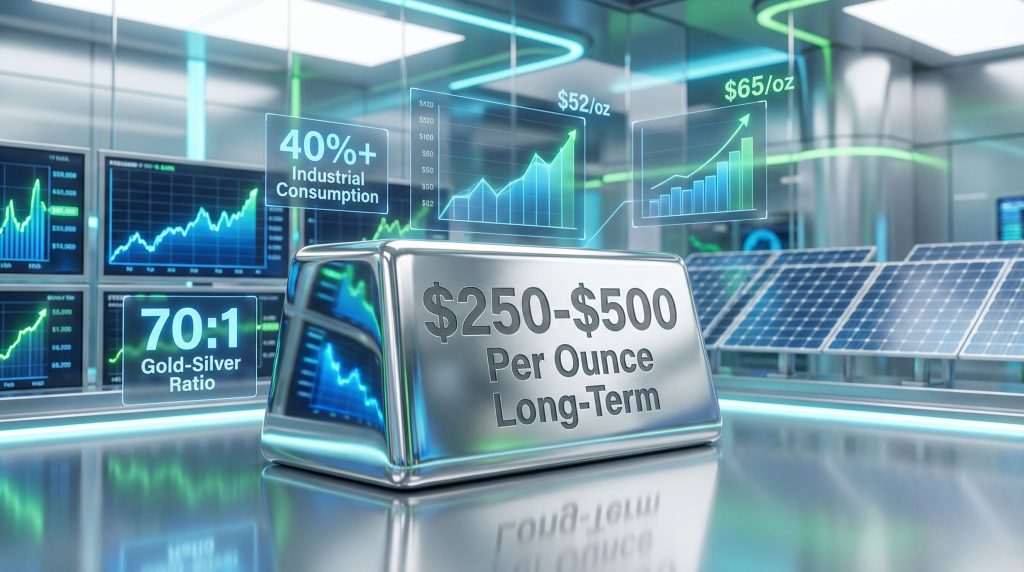
Could Silver Reach $250-$500 Per Ounce Long-Term?
Extreme Bull Market Scenario Analysis
Historical precious metals bubble analysis provides context for extreme price targets that exceed conventional fundamental analysis. Previous silver price peaks occurred during unique monetary system stress periods that created parabolic price movements extending far beyond industrial demand justification.
Peak nominal price comparisons:
- January 1980 (Hunt Brothers): $50.35/oz nominal ($188/oz in 2024 dollars)
- April 2011 (post-QE peak): $49.84/oz nominal ($83/oz in 2024 dollars)
- August 2024 (recent high): $32.70/oz
Parabolic price movement analysis reveals consistent duration patterns across historical precious metals bubbles. The 2008 gold rally's parabolic phase lasted 12-18 months ($300→$1,900), while the 1979-1980 silver squeeze extended 6-9 months ($6→$50), and the 2010-2011 gold rally required 14 months ($1,000→$1,900).
Mathematical relationship analysis supports extreme price scenarios under specific conditions. Gold reaching $10,000 per ounce combined with gold-silver ratio compression to 20-30:1 would mathematically support $333-$500 silver price levels. Understanding silver squeeze strategies becomes crucial for navigating these potential scenarios.
Required preconditions for extreme scenarios:
- Gold appreciation to $10,000+ levels
- Gold-silver ratio compression to 20-30:1
- Public participation phase activation
- Monetary system stress continuation
- 2-4 year timeline for scenario development
Monetary System Stress Testing
Currency debasement acceleration scenarios examine potential triggers for extreme precious metals valuations beyond historical precedent. Current monetary metrics provide baseline conditions for stress testing various debasement pathways and their potential precious metals market impacts.
Quantifiable debasement metrics include:
- M2 Money Supply: 24% expansion over 36 months (2021-2024)
- Core inflation: Currently 3.3% annually (November 2024)
- Real yields: 10-year TIPS yields 1.5-2.0%
- Dollar strength: U.S. Dollar Index stable at 100-105 throughout 2024
Central bank digital currency implementation represents a potential catalyst for hard asset demand acceleration. Programmable money characteristics could drive portfolio allocation shifts toward non-programmable assets, including precious metals, during monetary system transitions.
Inflation hedge demand activation requires:
- Sustained negative real yield environment
- Currency strength deterioration signals
- Portfolio rebalancing toward hard assets
- Institutional allocation policy changes
Extreme stress scenarios consider:
- Accelerated monetary expansion policies
- Geopolitical currency system challenges
- Energy price shock transmission effects
- Debt monetisation requirements
What Technical Indicators Signal Silver Market Direction?
Breakout Pattern Recognition
Silver's technical structure reveals key resistance and support levels that provide positioning guidance for intermediate-term price movements. The psychological $50 resistance level represents significant technical importance based on historical price action and round-number psychology effects.
Recent price action confirmed breakout above the $50 level, establishing potential support during correction phases. Technical analysis suggests that sustained trading above this level indicates structural strength, while failure to maintain support could signal deeper correction potential.
Volume confirmation requirements include:
- Breakouts occurring on 20-50% above 50-day average volume
- Pullbacks below breakout levels on declining volume
- Sustained trading above breakout levels for pattern validation
- Open interest changes confirming institutional participation
Cup and handle formation analysis:
- Rounded low formation establishing base structure
- Consolidation zone creating "handle" pattern
- Breakout above handle resistance level
- Volume expansion confirming pattern completion
COMEX open interest data reveals institutional positioning changes during key technical levels. High concentration of short positions at resistance levels followed by open interest decline during breakouts suggests short covering activity that can accelerate price movements.
Support level identification involves:
- Fibonacci retracement analysis: 38.2%, 50%, 61.8% of major moves
- Moving average convergence: 50-day, 200-day MA support zones
- Previous resistance becoming support: Role reversal principles
- Volume profile distribution: High-volume trading zones
Correlation Analysis with Gold and Equities
Silver's correlation relationships with gold and equity markets provide insight into risk-on versus risk-off positioning dynamics. During market stress periods, silver demonstrates leverage characteristics that amplify both upside and downside movements compared to gold.
Decoupling scenarios occur during:
- Industrial demand shocks independent of monetary factors
- Supply constraint situations affecting silver specifically
- Late-cycle bull market phases with ratio compression
- Risk asset correlation breakdown periods
The gold-silver ratio serves as a barometer for precious metals sector health and positioning preferences. Current ratios near 70:1 suggest silver underperformance compared to historical bull market standards, potentially indicating catch-up opportunity during favourable conditions.
Correlation monitoring metrics:
- Gold correlation coefficient: Typically 0.7-0.9 during trending phases
- Equity market correlation: Variable based on risk sentiment
- Dollar correlation: Inverse relationship during currency weakness
- Commodity complex correlation: Energy and base metals relationships
Safe haven demand triggers include:
- Geopolitical uncertainty escalation
- Banking system stress indicators
- Currency system instability signs
- Inflation acceleration beyond central bank targets
How Should Investors Position for Silver Price Volatility?
Physical vs. Leveraged Exposure Strategies
Strategic precious metals allocation requires balancing physical metal insurance positions with trading opportunities that capitalise on intermediate cycle movements. Professional portfolio management suggests 80% physical allocation for long-term wealth preservation combined with 20% leveraged exposure for intermediate cycle trading.
Physical metals positioning advantages:
- Wealth preservation: Protection against monetary system risks
- No counterparty risk: Direct ownership eliminates institutional dependencies
- Long-term holding capability: Ability to weather intermediate corrections
- Insurance characteristics: Portfolio diversification benefits
Leveraged trading considerations:
- Intermediate cycle timing: Entry during technical support levels
- Profit-taking discipline: Systematic exit during resistance zones
- Position sizing controls: Risk management through exposure limits
- Volatility preparation: Higher position volatility acceptance
ETF trading during intermediate cycle advances provides liquidity advantages while maintaining precious metals exposure. However, leveraged products require active management and position sizing discipline to avoid significant capital loss during correction phases.
Risk management protocols include:
- Stop-loss implementation: Technical level-based exit strategies
- Position sizing limits: Maximum exposure percentages per trade
- Correlation monitoring: Portfolio concentration risk assessment
- Rebalancing triggers: Predetermined allocation adjustment points
Market Timing Considerations
Market timing approaches for silver price prediction require understanding both technical pattern recognition and fundamental cycle analysis. ABC wave pattern recognition provides framework for identifying correction completion and subsequent entry opportunities.
Intermediate correction identification methods:
- Technical support violations: Breaking below key moving averages
- Volume analysis: Selling pressure versus buying interest
- Sentiment extreme readings: Contrarian positioning indicators
- Ratio relationship changes: Gold-silver ratio expansion signals
Contrarian positioning opportunities emerge during:
- Sentiment extremes: Excessive bullish or bearish consensus
- Technical oversold conditions: RSI readings below 30
- News-driven selling: Fundamental narrative-driven weakness
- Ratio extreme readings: Historical high or low ratio levels
Exit strategy development requires:
- Bubble identification criteria: Public participation phase signals
- Ratio compression targets: 20-30:1 gold-silver ratio levels
- Sentiment extreme recognition: Universal bullish consensus
- Technical pattern completion: Parabolic move exhaustion signals
The next major ASX story will hit our subscribers first
What Risks Could Derail Silver Price Predictions?
Supply Response and Substitution Threats
Silver supply elasticity represents a key risk factor for extended high-price scenarios, though response mechanisms face significant constraints due to byproduct production dependency. Most silver production emerges from copper and zinc mining operations, limiting dedicated silver capacity expansion potential.
Mining capacity expansion constraints:
- Capital intensity: New mine development requiring substantial investment
- Timeline extensions: Multi-year development periods for new capacity
- Byproduct dependency: Limited dedicated silver mining economics
- Environmental regulations: Permitting and compliance challenges
Recycling technology advancement could potentially increase secondary silver recovery rates beyond current 25-30% scrap capture levels. However, recycling expansion requires price incentives sufficient to justify collection and processing infrastructure investments.
Substitution threat analysis:
- Electronics applications: Copper and aluminium alternatives in some uses
- Solar panel efficiency: Reduced silver content through technological improvement
- Photography decline: Continued secular demand reduction
- Industrial innovation: Alternative materials development risks
Government strategic reserve policies could influence supply availability during price acceleration phases. Historical precedent suggests official sector sales during extreme price levels, though current reserve levels appear insufficient for major market impact. Additionally, tariff impacts on silver could significantly alter supply chain dynamics and pricing mechanisms.
Economic Recession and Demand Destruction
Economic recession scenarios present significant downside risks for silver through both industrial demand destruction and investment liquidation pressures. Silver's dual nature as industrial commodity and monetary metal creates vulnerability to economic cycle downturns.
Industrial demand collapse risks:
- Solar installation deferrals: Capital expenditure delays during credit constraints
- Electronics production reduction: Consumer discretionary spending weakness
- Infrastructure project delays: Government budget constraint impacts
- Automotive sector weakness: Electric vehicle production slowdowns
Investment demand volatility factors:
- Forced liquidation: Margin calls and portfolio rebalancing pressure
- Dollar strength cycles: Safe haven flows to USD during crisis periods
- Credit market stress: Liquidity preference shifts away from commodities
- Real yield increases: Opportunity cost changes for non-yielding assets
Historical analysis reveals that severe economic contractions can override monetary support for precious metals during initial phases. The 2008 financial crisis demonstrated this pattern, with gold and silver declining initially despite monetary expansion expectations.
Recession probability indicators:
- Yield curve inversion: Historical recession predictor signals
- Energy price spikes: Oil price shock transmission effects
- Credit spread widening: Corporate bond market stress indicators
- Employment data deterioration: Labour market weakness confirmation
Silver Market Outlook: Key Takeaways for 2025-2030
Base Case Scenario Projections
Conservative silver price prediction models suggest $30-$50 trading range establishment through 2026, supported by industrial demand growth and monetary policy backdrop. This range assumes continued economic growth with periodic corrections maintaining healthy market structure.
Supporting fundamental factors:
- Industrial demand growth: 3-4% annually driven by renewable energy expansion
- Supply constraints: Limited new capacity development timelines
- Monetary policy support: Continued expansionary bias from central banks
- Inventory dynamics: COMEX warehouse stock levels versus historical norms
According to Coin Codex silver forecasts, analysts expect continued volatility with potential for significant upside during favourable market conditions.
Near-term volatility expectations include:
- Periodic 15-25% corrections: Healthy bull market characteristic preservation
- Seasonal pattern recognition: Historical quarterly performance analysis
- Policy response anticipation: Central bank meeting outcomes and guidance
- Geopolitical event impacts: Risk-on/risk-off sentiment shifts
Intermediate targets through 2030:
- Conservative estimate: $50-$75 range maintenance
- Moderate bullish case: $75-$125 during favourable cycles
- Supply deficit scenario: $100-$150 if production constraints bind
- Monetary stress scenario: $150-$300 during currency system pressure
Risk-Adjusted Investment Approach
Professional precious metals portfolio construction requires diversification across physical and paper silver exposure while maintaining cycle-aware position management strategies. Risk-adjusted approaches balance maximum upside capture with downside protection during correction phases.
Portfolio construction principles:
- Core physical position: 60-80% allocation for wealth preservation
- Trading position allocation: 20-40% for intermediate cycle capture
- Diversification requirements: Geographic and form diversification
- Liquidity maintenance: Emergency access and transaction capability
Correlation monitoring protocols:
- Gold relationship tracking: Ratio analysis for relative positioning
- Equity market correlation: Risk-on sentiment impact assessment
- Dollar strength implications: Currency relationship monitoring
- Commodity complex positioning: Broader inflation hedge effectiveness
Exit strategy preparation involves:
- Bubble identification criteria: Public participation phase recognition
- Technical pattern completion: Parabolic exhaustion signal awareness
- Sentiment extreme indicators: Contrarian positioning requirement
- Fundamental change anticipation: Policy shift and economic transition signals
Risk management implementation:
- Position sizing discipline: Maximum exposure percentage controls
- Stop-loss methodology: Technical and time-based exit strategies
- Rebalancing triggers: Predetermined allocation adjustment points
- Opportunity cost assessment: Alternative asset class comparison analysis
Disclaimer: This analysis contains forward-looking statements and predictions that involve inherent risks and uncertainties. Silver price prediction involves significant volatility and potential for substantial losses. Historical performance does not guarantee future results. Investors should conduct independent research and consult qualified financial advisors before making investment decisions. The precious metals market can experience extreme volatility and prolonged periods of price decline. Investment strategies discussed may not be suitable for all investors and require careful consideration of individual financial circumstances and risk tolerance.
Ready to Position Yourself for the Next Silver Discovery?
Whilst silver price prediction models suggest significant potential through 2030, identifying ASX-listed silver explorers before major discoveries can offer superior returns compared to holding physical silver alone. Discovery Alert's proprietary Discovery IQ model delivers instant notifications when significant mineral discoveries are announced, transforming complex geological data into actionable investment opportunities and ensuring subscribers maintain a market-leading advantage during discovery-driven bull markets.