July 24, 2026
The Convergence of Monetary Policy and Precious Metal Valuations
The dramatic ascent of silver prices surpass $100 represents more than a psychological milestone—it reflects fundamental shifts in global monetary architecture that have been building for years. When central banks worldwide implement aggressive monetary easing policies, the opportunity cost of holding non-yielding assets like silver decreases substantially. This creates a powerful catalyst for precious metal appreciation that extends far beyond speculative trading, highlighting silver's emerging inflation hedge role in today's economic environment.
The Federal Reserve's significant interest rate reductions throughout 2025 and early 2026 have transformed the investment landscape entirely. Real interest rates—nominal rates adjusted for inflation—have turned decisively negative, making traditional savings instruments unattractive on an inflation-adjusted basis. According to Federal Reserve Economic Data, this environment historically drives institutional capital toward alternative stores of value that can preserve purchasing power during periods of currency debasement.
Central bank behavior provides another crucial indicator of this monetary shift. The World Gold Council's 2026 reports document continued precious metal accumulation by sovereign institutions, with central banks globally diversifying away from pure dollar-denominated reserves. This institutional demand creates a floor under precious metal prices that retail speculation alone cannot provide, as central banks typically hold positions for decades rather than quarters.
Supply Chain Disruptions and Geographic Concentration Risks
Industrial silver demand has intensified precisely when supply chains face their greatest constraints in decades. The U.S. Geological Survey's Mineral Commodity Summaries reveal that approximately 70% of global silver production occurs as a byproduct of copper, lead, and zinc mining operations. This dependency creates a unique supply dynamic where silver availability cannot increase independently of primary metal production decisions.
Geographic concentration compounds these supply risks significantly. Peru and Mexico combined account for approximately 40% of global primary silver production, according to USGS data. When labor disputes, energy constraints, or regulatory changes affect these major producing regions, global supply responds disproportionately. The mining sector's capital-intensive nature means production increases typically require 3-5 year lead times from exploration to commercial extraction.
Solar photovoltaic manufacturing alone now consumes approximately 8-9% of global silver supply annually, based on Silver Institute analysis. With renewable energy installations growing at 20-25% annually and each kilowatt of solar capacity requiring approximately 20 grams of silver, this demand category alone could absorb substantial additional supply even without other industrial growth. Furthermore, this industrial demand continues to drive the silver market squeeze that investors are closely monitoring.
Key Industrial Silver Demand Sectors:
• Solar panel manufacturing: 4,500-5,500 tonnes annually
• Electric vehicle electronics: 600-800 tonnes annually (growing 15-20% yearly)
• Medical and pharmaceutical applications: 1,200-1,400 tonnes annually
• Electronics and semiconductors: 3,000-3,500 tonnes annually
When big ASX news breaks, our subscribers know first
Historical Price Analysis Through Economic Cycles
Understanding silver prices surpass $100 requires historical context that extends beyond nominal price comparisons. Inflation-adjusted analysis reveals that current levels, while historically significant, remain below the 1980 peak when measured in real purchasing power terms. Additionally, examining the gold-silver ratio analysis provides crucial insights into current market valuations.
| Period | Nominal Peak | Inflation-Adjusted (2026) | Economic Context |
|---|---|---|---|
| 1980 | $49.45 | $178.20 | Volcker Fed anti-inflation policy |
| 2011 | $48.70 | $67.40 | Post-crisis quantitative easing |
| 2026 | $100.94 | $100.94 | Geopolitical tensions, rate cuts |
The 1980 silver peak occurred during an extraordinary confluence of factors including double-digit inflation, 20% federal funds rates, and the Hunt brothers' attempted market corner. That environment created demand for inflation hedges that exceeded even current conditions. However, according to Forbes analysis, today's silver milestone reflects more sustainable market fundamentals.
The 2011 rally followed different fundamentals entirely. Post-financial crisis quantitative easing created asset inflation fears, but within a lower real-yield environment than 1980. Silver reached $48.70 on May 3, 2011, according to COMEX data, before correcting 45-50% within months as European debt concerns shifted capital flows.
Current conditions blend elements from both prior cycles while introducing new factors. De-dollarisation trends, documented through sovereign wealth fund allocation shifts, create structural demand that didn't exist during previous rallies. Trade settlement mechanisms bypassing traditional currency systems add another layer of precious metal demand driven by geopolitical rather than purely monetary considerations.
Cross-Asset Performance and Market Structure Changes
The silver-to-gold ratio currently operates at historical extremes, with approximately 30-35 ounces of silver required to purchase one ounce of gold. This compares to the historical range of 40-80:1, suggesting either significant silver undervaluation or gold overvaluation relative to long-term norms.
When precious metals move simultaneously higher—as silver, gold, platinum, and palladium have throughout 2026—this typically indicates macro-driven rather than metal-specific demand. Institutional investors increasing precious metals allocations create synchronised buying pressure across the entire complex, distinguishing current conditions from single-metal supply disruptions.
Market Correlation Analysis:
• Silver-gold correlation during stress periods: 0.75-0.85
• Silver volatility premium over gold: 2.5-3.0x
• Industrial vs. investment demand ratio: approximately 60/40
Economic Indicators and Sustainability Analysis
Distinguishing between sustainable fundamental demand and speculative momentum becomes crucial when silver prices surpass $100. Multiple indicators suggest underlying support for elevated price levels, though short-term corrections remain probable given historical patterns. Consequently, investors are increasingly adopting comprehensive precious metals investment strategies to navigate this complex environment.
Investment demand through Exchange-Traded Funds (ETFs), bars, and coins reached approximately 200-250 million ounces annually in recent years, according to Silver Institute data. This represents institutional recognition of precious metals' portfolio diversification benefits, particularly when traditional fixed-income returns fail to compensate for inflation risk.
Physical market indicators support fundamental strength. Major trading centres report inventory drawdowns and extended delivery timeframes for substantial quantities. Unlike purely financial speculation, physical market tightness reflects actual supply-demand imbalances rather than leveraged position-taking.
Risk Framework and Scenario Planning
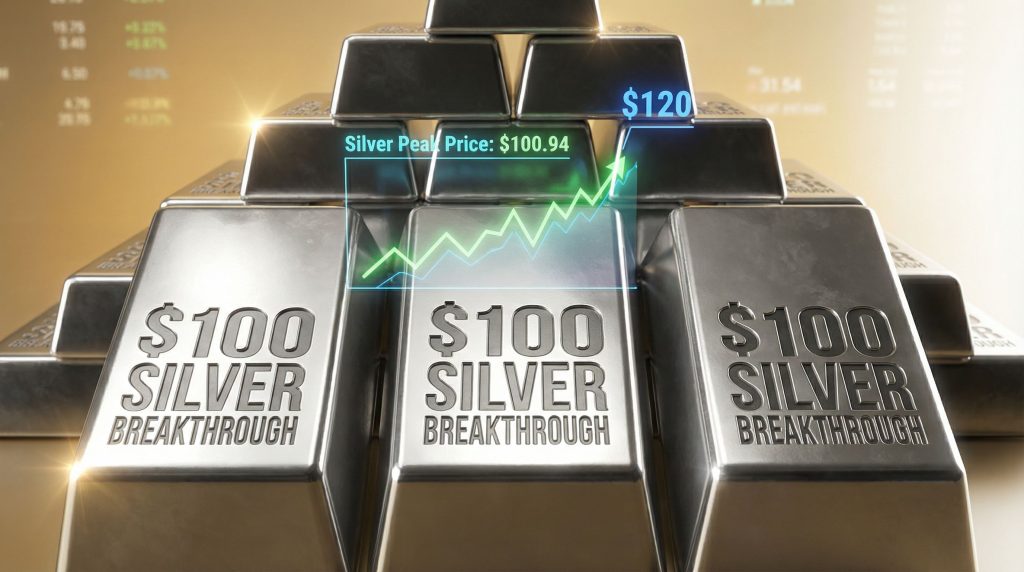
Technical analysis at current levels suggests multiple potential pathways for silver prices. Fibonacci extension projections based on prior major tops point toward $120 as the next significant resistance zone. However, historical precedent indicates profit-taking behaviours intensify at psychologically significant round numbers.
Probability-Weighted Price Scenarios:
| Target | Probability | Timeline | Key Catalysts |
|---|---|---|---|
| $120+ | 60% | 2-4 weeks | Momentum continuation, technical breakout |
| $80-90 | 35% | 1-2 months | Profit-taking, mean reversion |
| Sub-$60 | 5% | 6+ months | Major policy reversal, recession |
"The psychology of round-number price levels cannot be understated. While fundamentals support higher prices, decades of $100 silver speculation create natural profit-taking pressure at this threshold," notes market analysis from industry experts. Moreover, this market transformation in silver continues to reshape investor expectations.
Currency System Implications and De-dollarisation Trends
Silver prices surpass $100 against a backdrop of accelerating de-dollarisation initiatives by major economies. Danish pension funds' documented shifts away from U.S. Treasury holdings, reported in financial press, exemplify institutional recognition of currency concentration risks in portfolio management.
Central bank reserve composition changes favour hard assets when confidence in fiat currency stability wavers. While most central banks publish gold holdings transparently, silver accumulation remains less standardised in official reporting. However, the industrial nature of silver demand provides fundamental support independent of monetary considerations.
Currency System Stress Indicators:
• Negative real yields across major economies
• Accelerating sovereign debt accumulation
• Trade settlement bypassing dollar systems
• Commodity pricing in alternative currencies
Investment Strategy Implications and Portfolio Allocation
Institutional portfolio allocation models traditionally recommend 5-10% precious metals exposure for diversification benefits. When silver prices surpass $100, position sizing becomes critical as volatility typically increases with price levels. Risk management requires understanding that silver's industrial demand profile creates different correlation patterns than gold during economic stress.
Strategic Allocation Considerations:
• Conservative: 3-5% of portfolio in precious metals
• Moderate: 5-10% allocation with quarterly rebalancing
• Aggressive: 10-15% for high-risk tolerance investors
• Trading positions: Limited to 1-2% for speculation
Mining sector opportunities emerge when metal prices reach elevated levels. Large-cap producers benefit from expanded profit margins as production costs remain relatively stable while revenues increase proportionally. Junior exploration companies gain access to previously uneconomical deposits, though with correspondingly higher operational risks.
Technical Analysis and Market Structure Evolution
Chart pattern recognition at historic price levels reveals important structural changes in silver market behaviour. Long-term trend channel analysis, extending back decades, suggests current prices operate within established bullish parameters rather than representing speculative bubbles detached from fundamental support.
Volume analysis indicates institutional rather than purely retail participation in recent price advances. Large-block transactions and sustained buying pressure across multiple trading sessions differentiate current conditions from flash rallies driven by speculative position-taking. According to Economic Times analysis, this institutional involvement suggests greater market stability.
Technical Support Zones:
• Primary support: $85-90 range
• Secondary support: $75-80 range
• Long-term trend support: $65-70 range
• Crisis support: $50-55 range
Regulatory Response and Government Intervention Scenarios
Historical analysis of government responses to precious metal price surges provides context for potential policy interventions. The 1980 COMEX margin requirement increases that contributed to silver's collapse demonstrate how regulatory changes can rapidly alter market dynamics.
Tax policy implications become significant when silver prices surpass $100. Capital gains considerations affect both individual and institutional investment decisions, potentially creating temporal demand patterns as investors optimise tax efficiency through strategic timing.
Potential Regulatory Responses:
• Increased margin requirements on futures exchanges
• Transaction reporting threshold modifications
• Strategic reserve policy announcements
• International trade restriction considerations
The next major ASX story will hit our subscribers first
Long-term Economic Implications and Market Evolution
Manufacturing cost adjustments across silver-intensive industries become inevitable as prices sustain above $100 levels. Solar panel manufacturers, electronics producers, and medical device companies must either absorb higher input costs or pass them through to consumers, potentially affecting adoption rates in price-sensitive applications.
Recycling economics improve dramatically at current price levels. Secondary recovery from electronic waste, jewellery, and industrial applications becomes economically viable, though infrastructure development requires time to achieve meaningful supply impact.
Industry Adaptation Strategies:
• Material substitution research and development
• Supply chain diversification initiatives
• Vertical integration toward mining operations
• Enhanced recycling programme implementation
Geopolitical implications of concentrated mining operations gain strategic importance when silver prices surpass $100. Countries with substantial silver reserves may implement export restrictions to capture greater domestic value-added processing, similar to rare earth element policies implemented by major producing nations.
Future Market Dynamics and Investment Thesis Evolution
Risk-adjusted return expectations for precious metal allocations must account for increased volatility at elevated price levels. While potential returns may expand, correlation with traditional asset classes could increase during market stress, reducing diversification benefits precisely when needed most.
The industrial demand profile distinguishing silver from gold creates unique investment characteristics. Economic growth typically increases industrial consumption, while economic uncertainty drives investment demand—creating potentially offsetting forces that require careful analysis for long-term positioning.
"Market psychology at historic price levels often creates self-reinforcing cycles. Success breeds confidence, attracting additional capital that drives prices higher, until fundamental misalignment becomes unsustainable and corrections inevitably follow," observe market analysts studying current conditions.
Investment Thesis Evolution Factors:
• Industrial demand growth sustainability
• Monetary policy normalisation timelines
• Geopolitical tension resolution prospects
• Alternative technology development impacts
Silver prices surpass $100 represents a confluence of fundamental, technical, and psychological factors that have been building for years. While corrections remain probable given historical patterns, underlying supply-demand dynamics suggest elevated price levels may persist longer than previous cycles. Investors must balance opportunity recognition with risk management, understanding that precious metals serve portfolio roles extending beyond pure speculation into fundamental diversification and wealth preservation strategies.
Ready to Capitalise on the Next Silver Discovery?
Discovery Alert's proprietary Discovery IQ model delivers real-time notifications on significant ASX mineral discoveries, instantly empowering subscribers to identify actionable trading opportunities as precious metals continue their historic rally. Understand why major mineral discoveries can lead to substantial market returns by exploring Discovery Alert's dedicated discoveries page, and begin your 30-day free trial today to position yourself ahead of the market.