July 17, 2026

The Peculiar Geometry of a Market That Refuses to Follow Its Own Fundamentals
There is a scenario that challenges conventional commodity theory: a market recording its sixth consecutive annual supply deficit, with cumulative inventory drawdowns exceeding 762 million ounces since 2021, while prices simultaneously collapse by more than half from their all-time high. This is not a hypothetical stress test. It is the precise condition of the global silver market in mid-July 2026, and understanding why it exists is arguably more important for investors than knowing the deficit figures themselves.
The answer sits at the intersection of two incompatible timescales. Monetary policy operates on a quarterly decision cycle, recalibrating with each inflation print and employment release. Physical silver supply constraints, by contrast, are governed by geology, byproduct economics, regulatory frameworks, and multi-year capital investment cycles. When these two forces pull in opposite directions, the near-term financial market dynamic almost always wins. The July 28-29 FOMC meeting is where those two forces will next collide.
Why Silver Prices and the July FOMC Meeting Are Inseparable Right Now
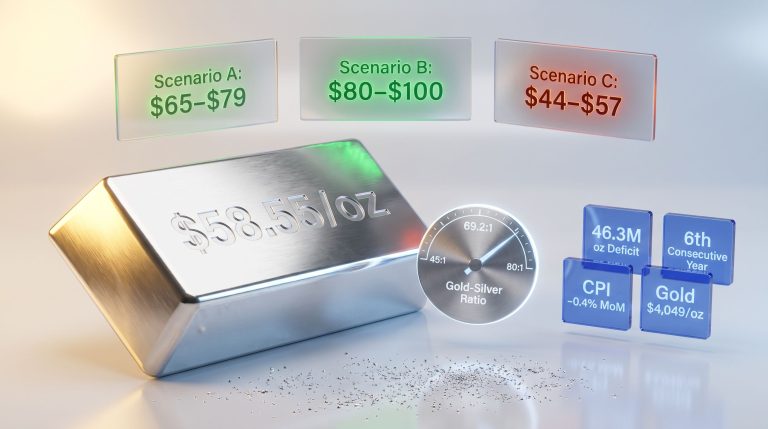
Silver prices and the July FOMC meeting have become the dominant analytical pairing for commodity investors in mid-2026. Silver spot prices traded in the $58-$59 per ounce range in mid-July 2026, representing a decline of approximately 52% from the January 2026 all-time high of $121.64-$121.78 per ounce. The Silver Institute's World Silver Survey 2026 simultaneously reported the sixth consecutive annual supply deficit, estimated at 46.3 million ounces for 2026, a 15% increase from the 40.3-million-ounce shortfall recorded in 2025. Understanding silver supply deficits of this scale helps contextualise why the price-fundamentals disconnect has become so analytically significant.
The mechanism behind this contradiction is the opportunity cost framework. The U.S. Federal Reserve held its benchmark policy rate at 3.50%-3.75% following the June 2026 meeting. Critically, the accompanying dot plot shifted toward signalling a potential 2026 rate hike rather than the previously anticipated rate cut. When real yields are elevated, the implicit cost of holding non-yielding assets like silver rises in lockstep. Financial market participants don't need to sell silver because fundamentals are weak. They sell because holding US Treasuries at 3.50%-3.75% is now a genuinely competitive alternative.
Gregory Shearer, Head of Base and Precious Metals Strategy at J.P. Morgan Global Research, has highlighted the amplification dynamic specific to silver: a 1%-2% decline in gold can translate into a 10%-15% decline in silver because silver lacks the sovereign central bank demand that provides structural price support to gold. This leverage works in both directions, meaning a reversal in monetary policy expectations would likely produce an outsized silver recovery relative to gold. Furthermore, silver's dual nature as both a precious and industrial metal amplifies these dynamics in ways that purely financial models often fail to capture.
The gold-silver ratio has become the most efficient real-time barometer of this dynamic. It expanded from 55:1 in May 2026 to approximately 69:1 by mid-July 2026, a quantifiable expression of how aggressively rate expectations have repriced silver relative to gold. Detailed gold-silver ratio analysis confirms that readings at this level have historically coincided with financial conditions dominating physical market fundamentals.
A gold-silver ratio above 65:1 has historically indicated that financial conditions are dominating commodity price discovery rather than physical supply-demand fundamentals. The current reading near 69:1 places the market firmly within that territory.
What the July 28-29 Meeting Is Actually About
The CME FedWatch Tool assigns approximately 89% probability to rates remaining unchanged at the July 28-29 meeting. This statistical near-certainty means the rate decision itself carries limited new information for silver pricing. The meeting's significance lies entirely in forward guidance language and the tone of Fed Chair Kevin Warsh's post-meeting commentary. For context on how markets have responded to similar meetings, the FOMC minutes reaction from comparable policy junctures offers useful historical reference points.
A September 2026 rate hike probability sitting near 51% represents a statistical coin flip, and that ambiguity is precisely what has silver range-bound between $55 and $65. The June 2026 CPI report, released July 14, is the most consequential pre-meeting data input. Meaningful deceleration in core inflation, particularly in energy components, would provide the Fed with analytical cover to soften its forward guidance without abandoning its stated inflation-fighting mandate.
| FOMC Scenario | Policy Signal | Silver Price Response | Gold-Silver Ratio Direction |
|---|---|---|---|
| Dovish Pivot | Rate hold + softened guidance | Recovery toward $64-$72; bulls target $90 | Compression toward 55-60:1 |
| Neutral Hold | Rate hold + unchanged guidance | Range-bound $55-$65 | Stabilizes near 65-70:1 |
| Hawkish Surprise | Rate hold + tightening bias | Pressure toward $50-$55 support | Expansion above 70:1 |
The Supply Architecture the Deficit Number Doesn't Fully Capture
The headline 46.3-million-ounce deficit is a significant figure, but it understates the effective supply constraint facing buyers and manufacturers operating outside China. Two compounding factors are responsible for this gap.
The Byproduct Problem: Why Higher Prices Don't Fix the Supply Deficit
Global silver mine production remained approximately flat at 844.1 million ounces in 2026 despite average silver prices rising 42% in 2025. This supply non-response is structural rather than cyclical. Approximately 74% of global silver production is extracted as a byproduct of copper, lead, and zinc mining. Those operations make capital allocation decisions based on base metal economics. Silver is essentially incidental revenue.
Oliver Turner, Executive Vice President of Corporate Development at Americas Gold and Silver, has articulated why this makes primary silver producers categorically different from the broader mining sector. Because the overwhelming majority of silver supply cannot respond to silver price signals, operations specifically designed to produce silver as a primary revenue source represent an increasingly scarce and strategically important component of global supply.
Americas Gold and Silver's Galena Complex in Idaho's Silver Valley illustrates how primary producers can materially increase output through targeted infrastructure investment. Phase 2 upgrades to the No. 3 Shaft increased average hoisting rates from 42 to 85 short tonnes per hour, expanding total hoisting capacity by 150% and removing the mine's primary production bottleneck. The simultaneous adoption of mechanised long-hole stoping increased underground productivity by more than 300%. These results are achievable precisely because the operation is designed around silver economics, not base metal throughput.
China's Export Architecture and the Invisible Deficit
China's silver export licensing framework, which took effect January 1, 2026, replaced the prior quota system with a whitelist of just 44 approved exporters. This policy effectively restricts an estimated 60%-70% of globally refined silver from reaching international markets. The global silver market impact of these overlapping trade and regulatory constraints has compounded the existing supply imbalance considerably.
The consequence for global price discovery is significant and underappreciated. The Silver Institute's 46.3-million-ounce deficit calculation reflects aggregate global supply and demand. It does not differentiate between silver circulating within China's domestic market and silver available to international buyers. Consequently, the export licensing framework means that buyers and manufacturers outside China face a materially tighter supply environment than the headline deficit implies.
This dynamic elevates the strategic importance of supply from Mexico and Peru as the primary alternative sources for internationally traded refined silver and concentrate, while simultaneously making both countries more vulnerable to demand concentration risk.
Peru's Compounding Risk Vectors
Peru's position in the global silver supply chain is more precarious than commonly understood. The country supplies approximately half of China's imported silver-bearing concentrate, meaning Peruvian supply disruptions create a feedback loop that constrains Chinese refining capacity in addition to reducing raw mine output.
Peru's Emergency Decree No. 003-2026, issued May 11, 2026 to address a nationwide energy shortage, combined with road blockades disrupting concentrate shipments from mines to ports, demonstrates how rapidly external shocks can compound. Critically, approximately 75% of Peru's silver projects are operated by small and mid-sized companies with limited balance sheet flexibility to absorb elevated energy costs. This financial fragility means the operational impact of energy price spikes is disproportionately severe compared to the same shock hitting a large diversified producer.
Mexico presents a distinct risk profile. Rising operating and financing costs, rather than energy supply disruptions, represent the dominant constraint. Security conditions add a further layer of risk that is difficult to quantify in conventional feasibility models. Vizsla Silver's Panuco project in Sinaloa experienced a severe security incident involving the kidnapping of ten workers linked to cartel activity, triggering a 50% decline in the company's share price despite no change to the underlying project economics. This event is analytically important because it quantifies, in real market terms, how jurisdictional risk can reprice a development-stage asset independently of resource quality or financial returns.
Evaluating Silver Investment Across the Value Chain
The combination of a persistent physical deficit, China's export restrictions, and rising jurisdictional risk in key producing nations creates differentiated opportunity across the silver investment spectrum. Each category carries a structurally distinct relationship between price exposure, downside protection, and upside potential.
Development-Stage Projects: The Conservative Base Case Advantage
Vizsla Silver's Panuco project illustrates a critical but underappreciated dynamic in development-stage silver asset valuation. The November 2025 Feasibility Study uses base-case prices of $35.50 per ounce for silver and $3,100 per ounce for gold, both substantially below current spot prices. Using those conservative assumptions, the study estimates an after-tax NPV of US$1.8 billion at a 5% discount rate, an internal rate of return of 111%, a seven-month capital payback period, and annual production of 17.4 million silver-equivalent ounces over a 9.4-year initial mine plan.
Even after silver's 52% correction from January's high, spot prices near $58-$59 per ounce remain well above the $35.50 feasibility base case, providing a meaningful buffer against further price declines. This gap between feasibility assumptions and realised spot prices is a risk management feature that is frequently overlooked when investors focus on headline price movements rather than project economics.
In June 2026, Vizsla awarded FLSmidth a major process plant equipment contract covering eight plant packages, with engineering already underway under a limited notice to proceed. This procurement milestone supports both the initial Phase 1 plant design and future Phase 2 expansion capacity, while remaining within the capital budget outlined in the Feasibility Study.
No production decision has been finalised for Panuco. Construction will proceed only after engineering completion, full financing closure, and receipt of all required permits and regulatory approvals. Investors should not treat procurement milestones as a substitute for a committed production decision.
Exploration-Stage Companies: Maximum Upside, Maximum Risk
GR Silver Mining's 78-square-kilometre Plomosas Project in Sinaloa represents the highest-risk, highest-potential-return category within the silver investment spectrum. As an exploration-stage company that has not yet published a feasibility study, NPV, or IRR, its valuation is driven by resource discovery and expansion momentum rather than fixed commodity price economics. Investors who are new to this sector may benefit from interpreting drill results before drawing conclusions from individual intercepts.
July 2026 drilling at the San Marcial SE Extension intersected 21.9 metres true width grading 168 grams per tonne silver and 1.41% zinc, confirming that mineralisation extends at least 150 metres beyond the boundary of the existing 2023 Mineral Resource Estimate. This result is strategically significant because it supports resource growth ahead of an updated Mineral Resource Estimate and Preliminary Economic Assessment expected within the next six to twelve months.
The company also experienced a leadership transition during the period. Eric Zaunscherb was appointed President and Chief Executive Officer on July 6, 2026, following the passing of founder Marcio Fonseca. Zaunscherb previously served as CEO from February 2022 to June 2025, providing institutional continuity at a pivotal stage of the exploration programme. Management continuity is a material but frequently underweighted variable in exploration-stage company valuation, particularly during active drilling programmes where geological interpretation and programme prioritisation depend heavily on institutional knowledge.
A particularly notable drill result from the programme includes hole SMS26-04, which returned 45.1 metres estimated true width at 1,623 grams per tonne silver from a dilation zone within the Parallel Breccia structure. Results of this grade from follow-up targets substantially increase the probability that the updated Mineral Resource Estimate will expand meaningfully beyond current boundaries.
| Investment Category | Price Sensitivity | Downside Protection | Upside Potential | Primary Risk |
|---|---|---|---|---|
| Primary Producers | High (direct revenue) | Moderate (operating leverage) | Strong at higher prices | Operational and jurisdictional |
| Development-Stage | Moderate (feasibility buffer) | Moderate (conservative base case) | High if financed and built | Permitting, financing, execution |
| Exploration-Stage | Low (pre-revenue) | Minimal | Highest (resource discovery) | Exploration failure, no cash flow |
The Asymmetry That Long-Term Investors Should Not Ignore
The distinction between monetary policy cycles and physical market cycles is not merely academic. It carries direct implications for how investors should frame their time horizon when evaluating silver exposure. Indeed, silver prices and the July FOMC meeting represent just one snapshot within a much longer structural story.
The Fed's rate path is a near-term, policy-driven, and fundamentally reversible variable. A single FOMC meeting, a single CPI release, or a material shift in employment conditions can alter the trajectory of rate expectations within weeks. The physical silver supply deficit, by contrast, is governed by factors that cannot be resolved within a single quarter. In addition, the post-FOMC selling pressure that has historically weighed on silver and gold following hawkish guidance further underscores how swiftly financial conditions can override physical market signals:
- Ore grade depletion at existing mines, which reduces output per tonne processed regardless of silver prices
- Byproduct production economics that tie 74% of global supply to base metal market conditions
- Permitting timelines for new primary silver projects that routinely span five to ten years
- Capital investment lead times for shaft upgrades, processing plant construction, and infrastructure development
- Geopolitical and regulatory constraints, including China's export licensing framework and jurisdictional instability in Peru and Mexico
The cumulative drawdown of 762.1 million ounces from above-ground silver inventories since 2021 represents a structural reduction in the market's capacity to absorb future supply shocks. Each additional year of deficit operation reduces the buffer available, compressing the potential time between an inventory threshold breach and a price response.
The longer the price-fundamentals disconnect persists, the more compressed and potentially violent the eventual realignment between price and physical scarcity is likely to be. Monetary policy creates the disconnect. Physics closes it.
The July 28-29 FOMC meeting will not resolve the six-year deficit. It will not replenish inventories, restart Peruvian mines, or remove China's export licensing restrictions. What it can do is alter the monetary policy premium currently embedded in the gold-silver ratio, creating the conditions for physical market fundamentals to exert greater influence on price discovery. For investors positioned across primary producers, development-stage projects, and exploration-stage companies, the relationship between silver prices and the July FOMC meeting is ultimately a short-term lens on a long-term structural imbalance — and understanding that distinction is the most important analytical framework in the silver market right now.
This article is intended for informational purposes only and does not constitute financial advice. Commodity price forecasts, feasibility study projections, and exploration results involve inherent uncertainty. Past performance and historical deficit data do not guarantee future price outcomes. Investors should conduct their own due diligence before making any investment decisions.
Want to Track the Next Major Silver Discovery Before the Market Does?
Discovery Alert's proprietary Discovery IQ model scans ASX announcements in real time, instantly identifying significant mineral discoveries across silver and more than 30 other commodities — transforming complex geological data into actionable investment insights before the broader market reacts. Explore how historic discoveries have generated substantial returns on Discovery Alert's dedicated discoveries page, and begin your 14-day free trial today to position yourself ahead of the next major find.