
July 10, 2026
The silver shortage in 2026 represents a convergence of structural factors that traditional supply-demand models struggle to resolve. Industrial demand continues reaching unprecedented levels across sectors, while silver supply deficits persist due to mining production constraints and extended development timelines. Furthermore, investment allocation shifts create additional pressure on an already strained physical market.
Mine production constraints represent the fundamental bottleneck driving current market conditions. Global silver extraction has plateaued around 820-835 million ounces annually, with new mining projects requiring 7-15 years from discovery to production. This extended development timeline prevents rapid supply responses to rising demand, creating structural imbalances that persist across multiple economic cycles.
Industrial Applications Driving Silver Shortage in 2026
Critical Infrastructure Requirements
Solar energy infrastructure represents the fastest-growing industrial silver application. Photovoltaic cells cannot function without silver's unique electrical conductivity properties, with each solar panel requiring approximately 20-25 grams of the metal. Global renewable energy expansion targets exceed 1,000 gigawatts of new solar capacity by 2030, translating to massive silver consumption increases that existing supply chains cannot adequately support.
Electronics manufacturing continues expanding silver usage across consumer devices and industrial applications. Smartphone production utilises 0.2-0.3 grams per device, while medical device manufacturing requires high-purity silver components for antimicrobial properties. Moreover, defense and aerospace applications maintain strategic demand levels that remain relatively price-inelastic, ensuring consistent consumption regardless of market volatility.
Key Industrial Demand Drivers:
• Solar panel manufacturing consuming 10,000-14,000 tonnes annually by 2030
• Electric vehicle production requiring 25-50 grams per vehicle
• 5G infrastructure deployment accelerating silver consumption
• AI data centers increasing electronic component demand
Mining Production Plateau Analysis
Global silver mine output faces significant structural constraints that limit supply expansion capabilities. Primary silver mines account for only 30% of total production, with the remaining 70% produced as by-products of copper, gold, and zinc operations. This dependency means silver supply cannot respond independently to price signals, creating persistent supply-demand imbalances.
Geopolitical risks in major producing regions compound supply constraints. Mexico, Peru, and Russia collectively account for over 40% of global mine production, making the silver market vulnerable to political instability, trade disputes, and sanctions regimes. Additionally, environmental permitting delays extend project development timelines by 3-7 years, while labour shortages in mining regions limit operational capacity expansion.
The mining industry trends reveal ongoing challenges that compound these supply constraints further.
Critical Supply Constraints:
• 7-15 year development timeline for new mining projects
• Environmental permitting delays extending 3-7 years
• Energy costs increasing operational break-even prices
• Labour shortages limiting operational capacity
| Year | Mine Production | Total Supply | Industrial Demand | Investment Demand | Deficit/Surplus |
|---|---|---|---|---|---|
| 2024 | 813M oz | 1.03B oz | 665M oz | 187M oz | -67M oz deficit |
| 2025 | 820M oz | 1.05B oz | 650M oz | 227M oz | -72M oz deficit |
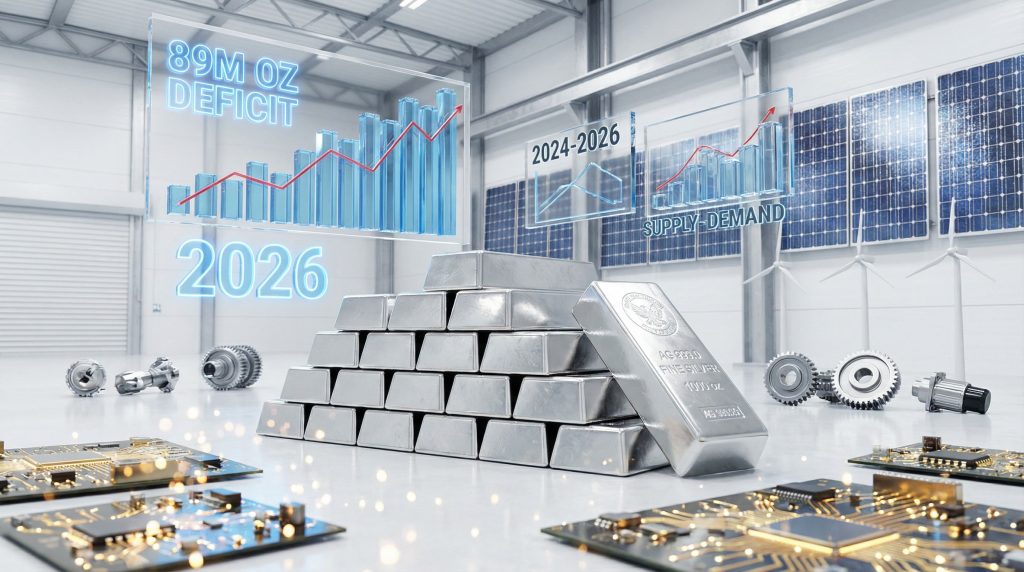
| 2026 | 825M oz | 1.06B oz | 655M oz | 240M oz | -89M oz deficit |
When big ASX news breaks, our subscribers know first
Supply Deficit Severity Assessment
Cumulative Inventory Depletion
The silver shortage in 2026 represents the culmination of sustained supply deficits spanning multiple years. Market analysis indicates six consecutive years of shortfalls totaling over 820 million ounces, equivalent to consuming one full year of global mine production from existing stockpiles. Consequently, this cumulative depletion accelerates market tightness as above-ground inventories approach critically low levels.
Exchange inventory data reveals concerning trends across major trading centres. COMEX registered silver stocks declined 31% within a few months, falling to approximately 86 million ounces by late February 2026. This represents deliverable silver available for immediate settlement, not total warehouse holdings that may include non-deliverable inventory.
The paper-to-physical coverage ratio reached 7.1:1, meaning 7.1 paper claims exist for every ounce of deliverable silver. Historical analysis suggests ratios exceeding 5:1 during inventory declines below 90-day supply coverage typically precede crisis pricing phases in precious metals markets.
The silver market squeeze dynamics demonstrate how these inventory pressures create systemic risks across financial markets.
Market Stress Indicator: When exchange inventories fall below 90-day supply coverage while paper claims exceed 5:1 ratios, precious metals markets historically enter accelerated repricing phases characterised by increased volatility and delivery pressure.
Physical Delivery Pressure Analysis
March 2026 delivery demands exceeded historical norms by substantial margins. First Notice Day saw over 52.6 million ounces standing for delivery, representing more than 60% of available registered inventory in a single day. Typical monthly delivery demand ranges between 10-20 million ounces, making March's figures extraordinary by historical standards.
December 2025 had already established concerning precedents with 46.6 million ounces delivered, then considered extreme. The March escalation suggests systematic changes in market behaviour, with participants increasingly demanding physical settlement rather than cash equivalents or contract rollovers.
Exchange Inventory Metrics:
• COMEX registered stocks: 86 million ounces (late February 2026)
• Inventory decline rate: 31% in recent months
• Paper-to-physical ratio: 7.1:1 coverage
• Days supply remaining: Approximately 131 trading days
Industry Vulnerability Rankings
Solar Energy Sector Exposure
Solar manufacturing represents the most vulnerable industry to silver shortages due to technical substitution limitations. Silver's unique electrical conductivity properties make it irreplaceable in photovoltaic cell production, despite ongoing research into alternative materials. Each solar panel requires 20-25 grams of silver, with global solar capacity expansion targeting over 1,000 gigawatts by 2030.
Thrifting efforts have reduced silver content per panel by approximately 15% over recent years through improved application techniques and recycling processes. However, these efficiency gains cannot offset the dramatic expansion in total panel production required to meet renewable energy targets. Supply chain disruptions could delay solar installations, potentially slowing renewable energy transitions across multiple countries.
Electronics Manufacturing Dependencies
Consumer electronics manufacturing faces differentiated silver shortage impacts based on application criticality. Smartphones utilise approximately 0.2-0.3 grams per device, representing minimal cost impact even with substantial silver price increases. However, high-performance computing applications, medical devices, and automotive electronics require significantly higher silver content per unit.
Defense and aerospace applications maintain strategic demand regardless of price levels, as silver's reliability in mission-critical systems cannot be compromised. These sectors typically secure multi-year supply contracts directly with mining companies, bypassing spot market volatility through long-term off-take agreements.
Industry Vulnerability Assessment:
• High vulnerability: Solar panel manufacturers, medical device producers
• Moderate vulnerability: Automotive electronics, consumer electronics
• Low vulnerability: Defense contractors with secured supply agreements
Investment Demand Dynamics
Investment demand represents a competing claim on physical silver supply that has intensified significantly. Indian market demand increased 20% year-over-year, while Western institutional investors resumed precious metals allocation after years of neglect. Central bank diversification away from dollar-denominated assets drives sustained institutional demand independent of industrial requirements.
Physical silver premiums expanded substantially as paper markets disconnect from physical availability. Retail investors increasingly prefer physical ownership over exchange-traded products, removing metal from industrial supply chains. This behavioural shift compounds industrial supply constraints by creating parallel demand streams that compete for the same finite physical inventory.
Price Projection Analysis
Institutional Forecasting Consensus
Major financial institutions have substantially revised their silver pricing strategies for 2026, reflecting recognition of structural supply constraints. J.P. Morgan projects silver averaging $81 per ounce in 2026, representing more than double the 2025 average price. This industry analysis acknowledges that previous models underestimated the severity of supply-demand imbalances.
| Institution | Conservative | Base Case | Optimistic |
|---|---|---|---|
| Bank of America | $135/oz | $200/oz | $309/oz |
| J.P. Morgan | $75/oz | $81/oz | $85/oz |
| Metals Focus | $50/oz | $57/oz | $60/oz |
| Independent Analysts | $100/oz | $150/oz | $200/oz |
The dramatic variation in institutional forecasts reflects uncertainty about how quickly supply constraints will manifest in pricing. Conservative estimates assume demand destruction at higher price levels, while optimistic projections model scenarios where industrial demand remains relatively price-inelastic due to silver's irreplaceable properties in critical applications.
Macro-Economic Price Drivers
Federal Reserve monetary policy uncertainty contributes to precious metals allocation as portfolio diversification. Inflation expectations consistently exceeding 3% annually drive real asset demand, while currency debasement concerns support safe-haven allocation trends. Furthermore, geopolitical tensions maintain elevated precious metals premiums across international markets.
The gold-silver ratio insights show compression from historical extremes above 90:1 to current levels around 63:1, suggesting continued relative value opportunities in silver. Historical patterns indicate silver typically outperforms gold during precious metals bull markets, with ratio compression potentially accelerating if gold prices advance further.
Price Driver Analysis:
• Federal Reserve independence concerns
• Inflation expectations exceeding 3% annually
• Currency diversification strategies
• Geopolitical risk premiums
Technical Market Structure
Futures market backwardation indicates immediate supply tightness, with near-term contracts trading at premiums to future delivery months. This structure reflects willingness to pay premiums for immediate physical access rather than waiting for future delivery. Options market skew favours upside price movements, suggesting institutional positioning for continued appreciation.
Momentum indicators support sustained bull market conditions despite short-term volatility. The January 2026 peak at $121.62 per ounce established new technical resistance levels, while the subsequent correction to $72 per ounce created potential support zones for future price movements.
Mining Industry Response Strategies
Production Expansion Challenges
Global mining companies face substantial obstacles expanding silver production capacity. Capital expenditure requirements for major projects typically exceed $2-5 billion, with extended payback periods that discourage speculative development. Environmental permitting processes delay project initiation by 3-7 years, while community relations and indigenous rights negotiations add additional complications.
Labour shortages in remote mining regions limit operational capacity even at existing facilities. Energy costs continue rising, increasing break-even prices for marginal deposits. Mining companies must balance silver expansion against other metal priorities, as most silver production occurs as by-products of copper, gold, and zinc operations.
Expansion Constraints:
• Capital requirements: $2-5 billion for major projects
• Environmental permitting: 3-7 year delays
• Labour availability: Critical shortages in mining regions
• Energy costs: Rising operational expenses
Strategic Resource Allocation
Primary silver miners prioritise high-grade deposit development to maximise returns per ounce produced. Gold producers optimise by-product silver recovery rates through improved processing techniques, while recycling operations expand capacity to capture secondary supply from electronic waste and industrial applications.
Exploration budgets increased 15-25% specifically for silver-focused projects, though results require years to materialise in production increases. Companies increasingly negotiate long-term off-take agreements with industrial users, securing revenue streams that justify expansion investments while reducing spot market exposure.
Investment Consideration: Mining companies with existing silver production capacity and proven reserves may experience significant valuation premiums as supply constraints intensify through 2026-2028, particularly those with low-cost operations and expansion optionality.
Long-Term Market Implications
Technology Sector Adaptation
Industrial users accelerate substitution research for non-critical silver applications while accepting higher costs for essential uses. Recycling technology improvements now recover 85% or more of industrial silver content, though recycled supply cannot replace primary production entirely. Strategic stockpiling by major manufacturers creates additional demand layers that compete with investment and industrial consumption.
Supply chain diversification reduces single-source dependencies, with electronics manufacturers increasingly negotiating direct relationships with mining companies. These off-take agreements bypass traditional commodity markets, creating parallel distribution channels that may persist beyond current shortage conditions.
Monetary System Considerations
Silver's historical monetary role gains renewed attention as currency instability drives private wealth preservation strategies. Central bank policies affecting precious metals demand include reserve composition changes and regulatory frameworks for digital currencies. International cooperation frameworks for critical mineral sharing may emerge as strategic resource security becomes more important.
Geopolitical Resource Dynamics:
• Critical minerals designation increasing government involvement
• Strategic reserve considerations for technology-dependent economies
• Trade policy implications for silver-producing nations
• International cooperation frameworks for resource sharing
The next major ASX story will hit our subscribers first
Investment Positioning Strategies
Physical vs. Paper Silver Analysis
Physical silver ownership eliminates counterparty risk while requiring storage and insurance considerations. Direct ownership provides protection against potential delivery failures in paper markets, though liquidity differs significantly from exchange-traded alternatives. Tax implications vary by jurisdiction and holding structure, with some regions offering preferential treatment for physical precious metals.
Storage costs typically range from 0.5-1.5% annually for professional vault services, while insurance adds additional expenses. However, recent market stress analysis demonstrates the value of eliminating intermediary risks, particularly when exchange inventories face systematic pressure.
Portfolio Allocation Framework
Risk-adjusted return expectations for precious metals exposure suggest allocation ranges between 5-20% of total portfolio value, depending on individual risk tolerance and investment objectives. Correlation analysis shows silver maintains low correlation with traditional asset classes during market stress periods, providing diversification benefits beyond absolute return potential.
Position sizing should account for silver's higher volatility compared to gold, with rebalancing triggers based on price momentum indicators rather than calendar periods. Dollar-cost averaging strategies help manage entry point risk during volatile market conditions.
Portfolio Considerations:
• Allocation range: 5-20% of total portfolio
• Volatility management through position sizing
• Rebalancing triggers based on momentum indicators
• Dollar-cost averaging for entry point management
Frequently Asked Questions
Will silver shortages affect consumer product availability?
Most consumer electronics use minimal silver quantities (0.1-0.5 grams), so the silver shortage in 2026 would likely increase costs by $1-5 per device rather than eliminate product availability entirely.
How long could the silver shortage in 2026 continue?
Based on current mine development timelines and demand growth projections, structural deficits may persist through 2028-2030 until significant new production capacity comes online.
Are there viable substitutes for silver in critical applications?
Copper, aluminium, and gold can substitute in some applications, but silver's unique electrical and antimicrobial properties make it irreplaceable in critical uses like solar cells and medical devices.
What would trigger an acute silver supply crisis?
A combination of major mine disruptions, accelerated industrial demand, and continued investment inflows could create severe shortages within 6-12 months of current conditions.
How does the silver shortage in 2026 compare to other critical mineral deficits?
Silver shortages appear more immediate than lithium or rare earth shortages due to lower recycling rates and concentrated production in politically unstable regions.
The silver shortage in 2026 represents a convergence of structural factors that may persist well beyond current market expectations. Industrial demand growth, mining production constraints, and investment allocation shifts create conditions that traditional supply-demand models struggle to resolve quickly. Understanding these dynamics provides crucial context for investment decisions and strategic planning across multiple sectors dependent on silver's unique properties.
Disclaimer: This analysis is for educational purposes only and should not be considered financial advice. Silver markets involve significant risk and volatility. Past performance does not guarantee future results. Consult qualified financial professionals before making investment decisions.
Ready to Position Yourself Ahead of the Silver Market Crisis?
Discovery Alert's proprietary Discovery IQ model delivers instant notifications on significant ASX mineral discoveries, including silver and precious metals opportunities that could benefit from this unprecedented market environment. Explore historic examples of major mineral discoveries that have delivered substantial returns to early investors, then begin your 14-day free trial today to gain the market-leading advantage you need during these critical shortage conditions.