June 24, 2026
The modern world's accelerating shift toward renewable energy infrastructure has created unprecedented demand patterns across specialised industrial materials. Among the most critical yet underappreciated components driving solar technology advancement is the strategic deployment of precious metals in photovoltaic systems. As global energy markets transition away from fossil fuels, the intricate engineering requirements of next-generation silver in solar cells reveal a complex dependency on specific conductive materials that determines both performance efficiency and manufacturing scalability.
Furthermore, the ongoing critical minerals energy transition highlights how silver has become indispensable to renewable energy infrastructure development.
Understanding Silver's Electrochemical Role in Solar Cell Architecture
Atomic-Level Conductivity Properties That Define Performance
Silver possesses the highest electrical conductivity of any metal at 63.0 megasiemens per meter, establishing it as the optimal material for electron transport in photovoltaic applications. This atomic-level property becomes critical when considering that solar cells must minimise resistance losses to maximise energy conversion efficiency. In crystalline silicon photovoltaic systems, even minor increases in series resistance can reduce power output by 2-3%, making material selection a fundamental engineering constraint.
The conductivity advantage of silver over alternative materials is substantial. While copper achieves approximately 59.6 MS/m and aluminium reaches only 37.7 MS/m, silver's superior electron mobility at operating temperatures (25-85°C) ensures minimal resistive losses during current collection. This performance differential becomes increasingly important as cell designs move toward higher current densities exceeding 10 amperes per cell.
Silicon-Silver Interface Engineering in Modern PV Systems
The metallisation process creates a critical interface between silver paste and silicon wafer surfaces, where electron transfer efficiency determines overall cell performance. Modern silver pastes contain precisely engineered glass frits that facilitate ohmic contact formation during thermal processing. These formulations achieve contact resistivity values below 1 milliohm-cm², enabling efficient electron extraction from the silicon substrate.
Interface recombination velocity represents another crucial parameter, with optimised silver contacts achieving values below 100 cm/s. This specification ensures that the metallisation system enhances rather than degrades the electrical characteristics of the underlying silicon. Temperature coefficient effects must also be considered, as silver contacts maintain stable resistance characteristics across the -40°C to +85°C operating range typical of field installations.
Resistance Minimisation Through Metallisation Design
Contemporary solar cell designs employ sophisticated grid patterns to balance collection efficiency against optical losses. The finger width has evolved from 80-100 micrometers in early designs to 40-60 micrometers in current manufacturing, reducing silver consumption whilst maintaining adequate current-carrying capacity. This optimisation requires precise control of screen printing parameters and paste rheology to achieve consistent line formation.
Multi-busbar configurations have emerged as the dominant architecture, with cells incorporating 9-16 busbars compared to traditional 3-busbar designs. This approach reduces series resistance by 15-25% whilst distributing current collection more uniformly across the cell surface. The tradeoff involves increased silver consumption but delivers measurable improvements in fill factor and overall conversion efficiency.
When big ASX news breaks, our subscribers know first
How Do Different Solar Cell Technologies Impact Silver Requirements?
PERC Technology Silver Consumption Patterns
Passivated Emitter and Rear Cell (PERC) technology represents the established baseline for silver consumption analysis, requiring approximately 10 mg per watt of installed capacity. This architecture applies silver exclusively to the front surface through screen-printed metallisation, with the rear contact system utilising aluminium paste with localised silver contacts for cell interconnection.
PERC manufacturing processes operate with firing peak temperatures of 750-850°C and utilise silver pastes with 65-75% metal content by weight. The thermal profile must be carefully controlled to ensure proper contact formation whilst avoiding damage to the passivation layers. Screen printing typically achieves line widths of 50-70 micrometers with aspect ratios optimised for current collection efficiency.
TOPCon Cell Architecture and Enhanced Silver Demand
Tunnel Oxide Passivated Contact (TOPCon) technology has emerged as the current industry standard, requiring approximately 13 mg per watt of silver content. This 30% increase over PERC results from the necessity of applying silver metallisation to both front and rear cell surfaces. The tunnel oxide layer, typically 1.5 nanometers thick, requires specialised paste formulations that maintain contact integrity without compromising the passivation properties.
TOPCon cells achieve conversion efficiencies of 24-25% in mass production, compared to 22-23% for PERC technology. This efficiency improvement justifies the increased silver consumption from an economic perspective, as the additional power output typically compensates for higher material costs. Manufacturing yields for TOPCon have reached 95-97%, comparable to mature PERC processes.
Heterojunction Technology's Silver-Intensive Design
Heterojunction (HJT) technology represents the most silver-intensive commercial cell architecture, requiring approximately 22 mg per watt. This 120% increase over PERC stems from several technical requirements:
- Low-temperature silver paste application on both surfaces
- Enhanced conductivity requirements due to reduced firing temperatures
- Specialised paste formulations compatible with amorphous silicon layers
- Higher finger density to compensate for reduced paste conductivity
HJT cells achieve laboratory efficiencies exceeding 26% and production efficiencies of 24-25%. The technology requires processing temperatures below 200°C to preserve the heterojunction interface, necessitating silver pastes with alternative curing mechanisms compared to conventional high-temperature formulations.
What Drives the Manufacturing Cost-Efficiency Balance in Silver Usage?
Finger and Busbar Grid Optimisation Strategies
Modern grid design optimisation involves complex tradeoffs between electrical performance and material consumption. Finger width reduction from 60 micrometers to 40 micrometers can decrease silver usage by 20-25% but increases line resistance proportionally. Manufacturers employ sophisticated modelling software to determine optimal grid patterns for specific cell architectures and target performance specifications.
| Design Parameter | Conservative | Optimised | Advanced |
|---|---|---|---|
| Finger Width (μm) | 60-70 | 45-55 | 35-45 |
| Finger Spacing (mm) | 2.0-2.5 | 1.8-2.2 | 1.5-1.8 |
| Busbars | 3-5 | 9-12 | 12-16 |
| Silver Usage (mg/W) | 12-15 | 10-12 | 8-10 |
| Fill Factor Impact | Baseline | +1-2% | +2-3% |
Busbar optimisation presents additional complexity, as increasing busbar count reduces series resistance but increases silver consumption and optical shading. The optimal balance typically occurs at 12-16 busbars for standard cell formats, though this varies with cell size and efficiency targets.
Silver Paste Formulation and Application Methods
Silver paste composition critically affects both performance and material consumption. Modern formulations contain:
- 65-80% silver particles by weight
- 8-15% glass frit for contact formation
- 5-12% organic binder system
- 3-8% solvent and rheology modifiers
Particle size distribution affects conductivity and printing characteristics, with optimal silver particle sizes ranging from 0.5-5 micrometers. Spherical particles provide better packing density and conductivity compared to flake-type particles but may require different processing parameters.
Screen printing precision has advanced significantly, with modern equipment achieving:
- Line width control: ±3 micrometers
- Thickness uniformity: ±10%
- Registration accuracy: ±25 micrometers
- Print speed: 3000-4000 cells per hour
Quantifying Global Silver Demand from Photovoltaic Manufacturing
Historical Consumption Trajectory Analysis (2014-2024)
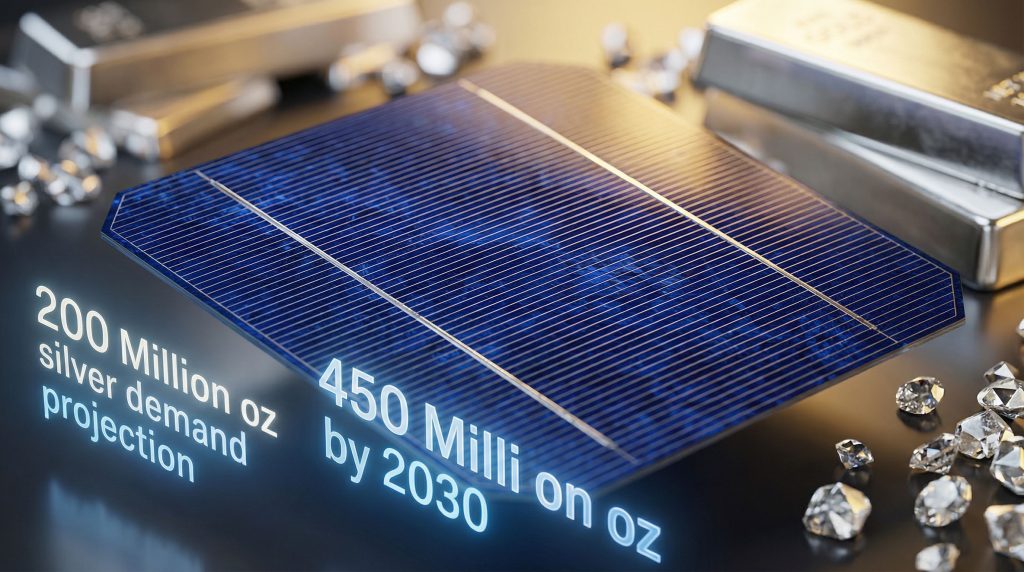
The solar photovoltaic sector has transformed from a minor industrial silver consumer to a dominant demand driver within a single decade. In 2014, solar applications consumed approximately 75 million ounces of silver, representing only 11% of total industrial silver demand. This baseline period coincided with PERC technology dominance and relatively modest global solar installation volumes.
| Year | Solar Silver Demand (Million oz) | Industrial Share (%) | Technology Driver | Global PV Installations (GW) |
|---|---|---|---|---|
| 2014 | 75 | 11% | PERC dominance | 45 |
| 2016 | 95 | 14% | Capacity expansion | 76 |
| 2018 | 125 | 17% | Efficiency improvements | 104 |
| 2020 | 140 | 19% | Technology transition | 138 |
| 2022 | 165 | 23% | TOPCon introduction | 191 |
| 2024 | 200 | 29% | TOPCon adoption | 346 |
The acceleration from 2020-2024 reflects both increased installation volumes and the technology transition toward TOPCon cells requiring 30% more silver per watt. This period witnessed solar's emergence as the largest growth driver in industrial silver demand, with annual consumption increases of 15-25 million ounces during peak adoption years.
Additionally, this dramatic growth has contributed to a broader silver market squeeze affecting global financial markets and industrial applications beyond photovoltaics.
Regional Manufacturing Distribution and Silver Flow
Global solar cell production remains heavily concentrated in Asia-Pacific regions, with China accounting for approximately 85% of worldwide manufacturing capacity. This concentration creates distinct regional patterns in silver consumption:
China: Approximately 170 million ounces annual consumption (2024)
- Dominates TOPCon production with 200+ GW annual capacity
- Leading HJT development with 50+ GW projected capacity by 2025
- Integrated supply chains from polysilicon to finished modules
Southeast Asia: Approximately 20 million ounces annual consumption
- Focus on PERC and TOPCon production for export markets
- Malaysia, Vietnam, and Thailand as primary manufacturing hubs
- Capacity expansion driven by trade policy considerations
Rest of World: Approximately 10 million ounces annual consumption
- European manufacturing focused on specialised applications
- North American capacity rebuilding through policy incentives
- India expanding domestic production capability
Supply Chain Bottlenecks and Material Sourcing Challenges
The rapid expansion of solar silver demand has created several supply chain stress points. Silver paste manufacturers must secure consistent metal supplies whilst maintaining quality specifications required for photovoltaic applications. The purity requirements for solar silver typically exceed 99.9%, with strict controls on contaminants that could affect contact formation or long-term reliability.
Supply Chain Insight: Major silver paste manufacturers including Heraeus, DuPont, and Monocrystal maintain strategic silver inventories equivalent to 60-90 days of production to buffer against price volatility and supply disruptions.
Lead times for specialised silver pastes have extended from 4-6 weeks to 8-12 weeks during peak demand periods, forcing solar manufacturers to increase working capital investment in raw materials. This dynamic has prompted vertical integration strategies, with several major solar manufacturers developing in-house paste production capabilities.
Can Alternative Materials Replace Silver in Solar Applications?
Copper Electroplating Technology Assessment
Copper electroplating has emerged as the most commercially advanced alternative to silver metallisation, with several major manufacturers conducting production-scale trials. LONGi Green Energy Technology has reported successful implementation of copper-plated contacts achieving 90-95% of silver-equivalent performance in laboratory conditions.
The electroplating process involves:
- Seed layer deposition (typically nickel or silver)
- Electrochemical copper deposition to 5-15 micrometer thickness
- Optional protective coating to prevent oxidation
- Reduced material cost: 60-80% lower than silver-based systems
However, field durability remains a significant concern. Accelerated aging tests reveal potential degradation mechanisms including:
- Copper oxide formation reducing conductivity
- Thermal cycling stress from coefficient of thermal expansion mismatch
- Moisture ingress leading to galvanic corrosion
- Potential for 1-2% annual power degradation over 25-year service life
Nickel-Based Contact Systems Research
Nickel-based metallisation systems offer moderate conductivity improvements over aluminium whilst maintaining cost advantages versus silver. Research initiatives focus on nickel-copper alloy systems achieving:
- Conductivity: 20-25% of silver performance
- Material cost: 40-50% of silver equivalent
- Thermal stability: Superior to pure copper systems
- Corrosion resistance: Enhanced compared to copper alternatives
Laboratory results demonstrate contact resistivity values of 2-5 milliohm-cm², approximately 3-5 times higher than optimised silver contacts. This performance gap translates to 0.5-1.0% cell efficiency reduction, which may be acceptable for cost-sensitive applications.
Conductive Polymer and Hybrid Solutions
Emerging research explores conductive polymer systems and hybrid metal-polymer composites for specialised applications. These approaches target niche markets where conventional metallisation faces technical limitations:
- Flexible solar cells: Polymer systems maintain conductivity during mechanical flexing
- Transparent contacts: Selective transparency for tandem cell applications
- Low-temperature processing: Compatible with plastic substrates
- Printed electronics integration: Simplified manufacturing processes
Current performance limitations include:
- Conductivity: 1-5% of silver performance
- Stability: Degradation under UV exposure and thermal cycling
- Contact resistance: 10-50 times higher than silver systems
- Commercial readiness: 5-10 years from mass production viability
What Are the 2030 Demand Projections and Market Implications?
Scenario Modelling for Solar Silver Consumption
Peer-reviewed analysis published in Resources, Conservation and Recycling provides comprehensive 2030 demand projections ranging from 321 to 450 million ounces annually. These scenarios reflect different technology adoption rates and global installation growth trajectories.
Conservative Scenario (321 million ounces):
- Annual solar installations: 400-500 GW globally
- Technology mix: 60% TOPCon, 30% PERC, 10% HJT
- Silver intensity improvements: 10-15% reduction through design optimisation
- Market growth rate: 8-10% CAGR from 2024 baseline
Base Case Scenario (385 million ounces):
- Annual solar installations: 600-700 GW globally
- Technology mix: 40% TOPCon, 20% PERC, 40% HJT
- Silver intensity: Stable at current levels
- Market growth rate: 12-15% CAGR from 2024 baseline
Aggressive Growth Scenario (450 million ounces):
- Annual solar installations: 800+ GW globally
- Technology mix: 20% TOPCon, 10% PERC, 70% HJT
- Silver intensity: Increased due to HJT dominance
- Market growth rate: 15-18% CAGR from 2024 baseline
Price Elasticity and Supply Response Mechanisms
Historical analysis reveals that solar silver demand exhibits relatively low price elasticity in the short term. Price increases of 50-100% typically result in demand reductions of only 5-15% within 12-18 months, reflecting the technical difficulty of material substitution and long product development cycles.
This demand pattern aligns with broader gold-silver ratio analysis trends, where industrial applications increasingly drive silver's value proposition independently from precious metals market dynamics.
Supply response mechanisms include:
Primary silver mining expansion:
- New project development timelines: 5-7 years from discovery to production
- Capital requirements: $200-500 million for major projects
- Grade sensitivity: Economic deposits require 100-200 g/t silver equivalent
Secondary silver recovery:
- By-product production from copper, lead, zinc operations: 70% of supply
- Recycling from electronic waste: 10-15% of supply
- Solar panel recycling potential: 5-10% by 2035
Strategic Implications for Solar Industry Growth
The projected 2030 demand scenarios present significant strategic challenges for solar industry stakeholders. At 450 million ounces annual consumption, solar would claim approximately 40-45% of global silver supply, creating potential bottlenecks that could constrain industry growth.
Manufacturing implications:
- Vertical integration of silver supply chains
- Strategic stockpiling to buffer price volatility
- Accelerated development of alternative materials
- Geographic diversification of silver sources
Investment priorities:
- R&D funding for material efficiency improvements
- Silver mining project development
- Recycling infrastructure expansion
- Alternative metallisation technology commercialisation
The next major ASX story will hit our subscribers first
How Does Silver Recycling from End-of-Life Panels Address Supply Constraints?
Current Recovery Rates and Processing Methods
Silver recovery from end-of-life solar panels remains in early development stages, with current recycling rates below 5% of potential supply. The challenge stems from both technical and economic factors, as solar panels installed before 2010 are only beginning to reach end-of-life status in significant volumes.
Mechanical separation techniques:
- Glass-silicon layer delamination: 70-85% recovery efficiency
- Metallisation layer separation: 50-70% silver recovery
- Processing cost: $8-15 per panel
- Silver content per panel: 5-15 grams depending on technology
Chemical extraction processes:
- Acid leaching systems: 85-95% silver recovery
- Precious metal refining: 99%+ purity achievable
- Processing cost: $15-25 per panel
- Environmental compliance requirements increase costs
Circular Economy Integration Strategies
The development of comprehensive panel recycling infrastructure requires coordination across multiple stakeholder groups. Current initiatives focus on establishing collection networks and processing facilities in regions with significant installed capacity. Moreover, this development aligns with broader renewable energy mining transformation trends toward sustainable material recovery systems.
Europe leads regulatory development:
- WEEE Directive mandates panel recycling
- Producer responsibility programmes establish funding
- Target: 85% recovery rate by weight by 2030
- Silver-specific recovery mandates under development
Asia-Pacific capacity expansion:
- China installing 50+ MW annual recycling capacity
- Japan developing automated disassembly systems
- South Korea implementing extended producer responsibility
Future Recycling Infrastructure Requirements
Projections indicate that by 2035, annual panel waste volumes could reach 8-10 million tonnes globally, containing approximately 500-800 tonnes of recoverable silver. This volume would represent 15-25% of current annual solar silver demand, providing meaningful supply augmentation. Recent research from Newcastle University demonstrates promising advances in fast recovery methods for high-grade silver from decommissioned panels.
Infrastructure investment requirements:
- Processing facilities: $2-5 billion global investment needed
- Collection networks: $1-2 billion for logistics infrastructure
- Technology development: $500 million – $1 billion R&D investment
- Workforce training: 10,000+ specialised technicians required
What Manufacturing Innovations Could Reduce Silver Intensity?
Nano-Scale Metallisation Techniques
Advanced manufacturing processes enable precise silver deposition at the nanoscale, potentially reducing consumption by 20-40% whilst maintaining equivalent electrical performance. These techniques include:
Inkjet printing systems:
- Line width capability: 20-30 micrometers
- Material utilisation: 95%+ (compared to 60-70% for screen printing)
- Processing speed: 1500-2500 cells per hour
- Capital cost: 2-3 times conventional screen printing equipment
Electrohydrodynamic printing:
- Sub-20 micrometer line width capability
- Reduced silver paste viscosity requirements
- Enhanced aspect ratio control
- Commercial deployment: 2026-2028 timeframe
Selective Emitter and Contact Design Advances
Selective emitter technology enables localised high-conductivity regions beneath metallisation contacts whilst maintaining optimal surface passivation elsewhere. This approach can reduce total silver consumption by 15-25% whilst improving cell efficiency by 0.3-0.5%.
Implementation requirements:
- Laser processing for selective doping: $1-2 million per production line
- Advanced paste formulations: 10-20% higher material costs
- Process control systems: Enhanced quality monitoring required
- Yield optimisation: 6-12 months typical ramp-up period
Next-Generation Cell Architecture Developments
Perovskite-silicon tandem cells represent the most promising pathway for dramatic efficiency improvements whilst potentially reducing silver intensity. Early research demonstrates:
- Conversion efficiency potential: 35%+ (compared to 26% for silicon)
- Silver intensity: 50-70% of current HJT requirements
- Commercial readiness: 2028-2032 for mass production
- Manufacturing challenges: Stability, scalability, cost optimisation
Back-contact architectures eliminate front-side metallisation entirely, reducing silver consumption by 40-60% whilst improving optical performance:
- Efficiency potential: 25-27% in mass production
- Manufacturing complexity: 2-3 times higher than conventional cells
- Capital requirements: $100-200 million per GW production line
- Market introduction: 2025-2027 by leading manufacturers
Industry Investment and Strategic Positioning Around Silver Supply
Vertical Integration Strategies for Solar Manufacturers
Leading solar manufacturers are pursuing vertical integration to secure silver supply chains and control material costs. These strategies involve direct investment in mining operations, paste manufacturing, and recycling infrastructure. This trend reflects broader mining sustainability trends emphasising supply chain resilience and environmental responsibility.
JinkoSolar partnerships:
- Strategic agreements with silver paste suppliers
- Joint venture investments in recycling technology
- Long-term silver supply contracts: 3-5 year terms typical
- Risk management through commodity hedging
LONGi Green Energy initiatives:
- In-house silver paste production development
- Alternative metallisation research programmes
- Supply chain diversification across 15+ countries
- Material inventory targets: 90-120 days of production
Mining Sector Response to Solar Demand Growth
Silver mining companies are responding to projected solar demand growth through capacity expansion and exploration investment. However, project development timelines of 5-7 years create potential supply-demand imbalances during periods of rapid solar growth.
Primary silver projects in development:
- 15-20 major projects globally with 2025-2030 production targets
- Combined potential output: 50-75 million ounces annually
- Capital requirements: $3-5 billion aggregate investment
- Geographic distribution: Mexico, Peru, Canada, Australia primary regions
By-product silver expansion:
- Copper mine expansions add 20-30 million ounces annual capacity
- Lead-zinc operations contribute 15-25 million ounces additional supply
- Gold mine by-product potential: 10-15 million ounces annually
Financial Market Implications and Risk Management
The solar industry's emergence as a major silver consumer has attracted financial market attention, creating new investment vehicles and risk management products.
Market developments:
- Solar-specific silver ETF products under development
- Commodity hedging products tailored to solar manufacturers
- Long-term supply agreements with inflation adjustment mechanisms
- Silver streaming agreements linking mining output to solar demand
Risk management strategies for manufacturers:
- Forward contracts covering 6-18 months of consumption
- Options strategies to limit upside price exposure
- Strategic inventory management: 30-90 days typical holdings
- Alternative material development as natural hedge
Strategic Outlook for Silver in Solar Energy Infrastructure
The analysis reveals that silver's role in photovoltaic technology extends beyond simple material consumption to represent a critical constraint on renewable energy deployment scalability. The projected increase from 200 million ounces (2024) to potentially 450 million ounces (2030) would fundamentally alter global silver market dynamics and require unprecedented supply chain coordination.
Technology roadmap synthesis indicates that whilst alternative materials show promise in laboratory conditions, the combination of electrical performance, manufacturing scalability, and long-term reliability requirements maintains silver's irreplaceable position for the next 5-10 years. HJT technology's superior efficiency justifies its 120% higher silver consumption compared to PERC, creating a structural shift toward more silver-intensive manufacturing.
Supply-demand balance outlook suggests potential bottlenecks emerging by 2027-2028 if aggressive solar deployment scenarios materialise without corresponding mining capacity expansion. The 5-7 year lead time for major silver mining projects creates a critical window where supply constraints could impact solar industry growth rates or force accelerated adoption of alternative metallisation technologies.
Strategic recommendations for industry stakeholders emphasise the importance of parallel development across multiple pathways: securing traditional silver supplies through vertical integration and long-term contracts, advancing alternative materials research with realistic timelines for commercial deployment, and establishing recycling infrastructure to create circular material flows. The solar industry's successful navigation of this materials challenge will significantly influence the pace of global energy transition and the long-term economics of renewable electricity generation.
Disclaimer: This analysis is based on current technology trends and market projections. Actual demand patterns may vary based on technological breakthroughs, regulatory changes, and macroeconomic factors affecting global solar deployment rates. Investors and industry participants should conduct independent research and consider multiple scenarios when making strategic decisions regarding silver supply chains and alternative metallisation technologies.
Ready to Invest in the Next Major Mineral Discovery?
Discovery Alert instantly alerts investors to significant ASX mineral discoveries using its proprietary Discovery IQ model, turning complex mineral data into actionable insights. Understand why historic discoveries can generate substantial returns by visiting Discovery Alert's dedicated discoveries page, showcasing historic examples of exceptional outcomes, and begin your 30-day free trial today to position yourself ahead of the market.