June 13, 2026
The Hidden Mechanics Behind a Commodity Market Under Siege
Most investors encounter silver as a price chart, a portfolio hedge, or a historical curiosity. Few understand the layered industrial, geological, and financial architecture that sits beneath the spot price. When that architecture fractures, the result is not a gradual adjustment but a rapid, disorderly repricing that catches reactive market participants on the wrong side of a historic move. The silver squeeze and physical silver shortage that unfolded in 2026 was not a random market event. It was the predictable outcome of structural forces that had been accumulating for years, visible to those who understood how the system actually functions.
When big ASX news breaks, our subscribers know first
Why Silver Supply Cannot Simply Keep Up With Demand
The Byproduct Problem Most Investors Overlook
A widely misunderstood characteristic of silver production is that approximately 70% of all silver mined globally is extracted as a byproduct of other mining operations, primarily lead, zinc, and copper. This means silver output is fundamentally governed by the economics of entirely different metals. When copper prices fall and copper mines scale back operations, silver output falls too, regardless of what silver is doing on its own.
This structural dependency severs the normal feedback loop between commodity prices and supply responses, leaving silver uniquely vulnerable to prolonged deficits. Understanding silver's dual role as both a precious metal and an industrial commodity helps explain why this byproduct dynamic has such far-reaching consequences for supply stability.
Mine Plans, Permitting, and the Decades-Long Blueprint
A silver mine does not respond to a price spike the way a manufacturer responds to higher product demand. Every operational mine operates from a long-term extraction plan built years in advance, defining what material is mined, in what sequence, and through what processing pathway, based on the geology of the ore body and the economics established at the time of development. These plans cannot be rewritten quickly. Permitting alone can take years.
Labour recruitment, equipment procurement, and the physical sequencing of ore extraction impose hard constraints on output that persist even when spot prices triple. The same rigidity applies in reverse. When silver prices fall, mines cannot simply scale back without disrupting the entire operation. This asymmetry, the inability to increase or decrease supply in meaningful response to short-term market movements, is precisely what allows deficits to persist long enough to create squeeze conditions.
Mine output in 2026 actually fell by approximately 2% despite silver prices reaching historical highs, a counterintuitive reality that becomes entirely logical once the structural constraints of mining are properly understood.
The Exploration Investment Gap
Years of suppressed silver prices prior to 2021 discouraged exploration investment. Discovering and developing a new silver deposit, even one with high-grade ore, requires a decade or more from initial discovery to first production under realistic permitting and financing timelines. The absence of exploration investment during the low-price years has translated directly into a constrained future supply pipeline, meaning the current deficit environment is unlikely to be resolved by new mine supply within any meaningful investment horizon.
Six Years of Deficit: Quantifying the Scale of the Physical Silver Shortage
How Above-Ground Stockpiles Masked the Growing Imbalance
To understand why silver did not squeeze in 2021 despite entering deficit, it is necessary to understand the role of above-ground stockpiles. In prior surplus years, production exceeded demand, and the excess accumulated as stored inventory across exchanges, vaults, refineries, and dealer networks. These reserves act as a buffer. When annual demand exceeds annual production, the gap is bridged by drawing on existing stockpiles rather than immediately through price rationing.
This buffering mechanism explains a counterintuitive dynamic: silver can remain in structural deficit for multiple consecutive years without producing a price crisis, provided accumulated reserves are sufficient to cover the shortfall. The crisis emerges when those reserves deplete to levels where exchange availability becomes critically constrained, lease rates spike, and the market cannot source physical metal where and when it is needed.
The Cumulative Deficit Picture Since 2021
The scale of the drawdown that preceded the 2026 squeeze is significant. According to data compiled by Metals Focus and the Silver Institute, the silver market has registered the following estimated annual deficits:
| Year | Estimated Annual Deficit (Million Oz) |
|---|---|
| 2021 | ~40 |
| 2022 | ~100+ |
| 2023 | ~150+ |
| 2024 | ~117 |
| 2025 | ~117 |
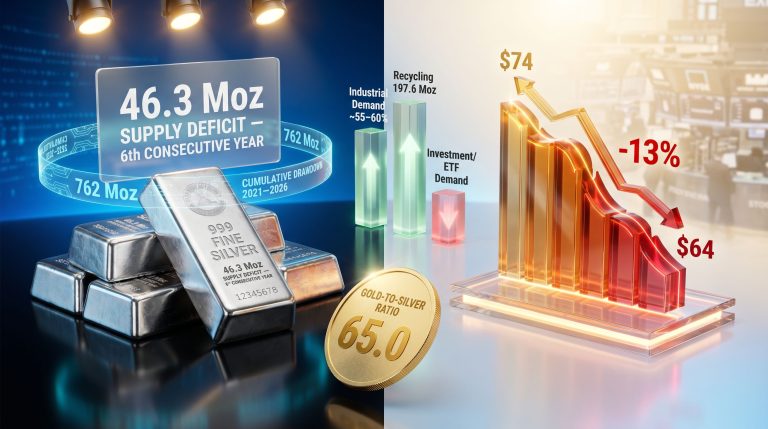
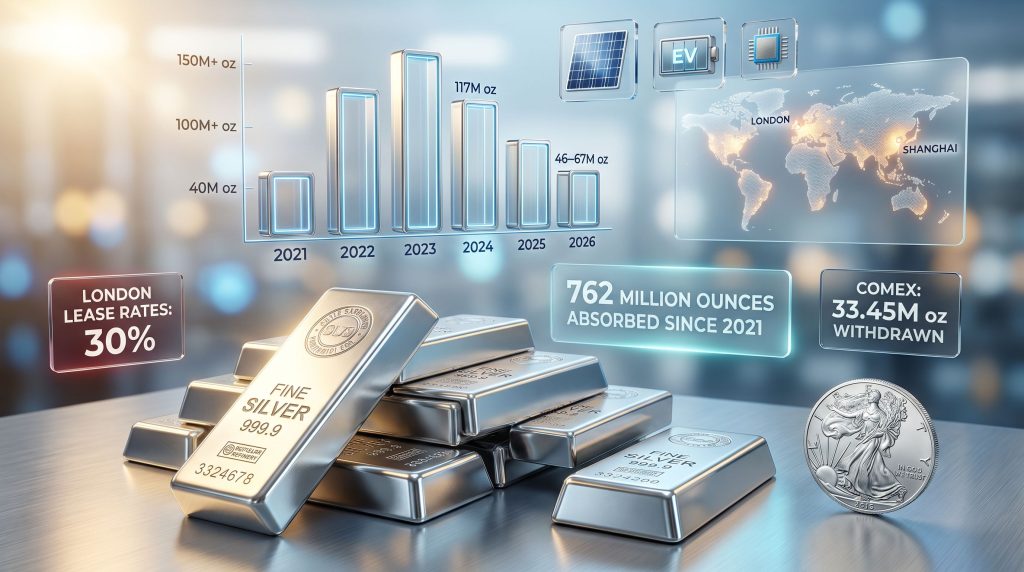
| 2026 (Projected) | ~46–67 |
Sources: Metals Focus; The Silver Institute; industry consensus estimates. These figures represent market estimates and are subject to revision as final annual data becomes available.
These consecutive silver supply deficits have collectively absorbed an estimated 762 million ounces from global above-ground stocks since 2021. That drawdown was not evenly distributed, and its consequences concentrated most severely in exchange-held inventory, which represents the most liquid and directly market-relevant form of physically available silver.
Exchange Inventory as the Canary in the Coal Mine
The most reliable real-time stress indicators during a physical silver shortage are exchange inventory levels and silver lease rates. These two metrics interact in a feedback loop that, once initiated, tends to accelerate. As available physical silver drains from exchanges:
- Entities requiring physical delivery find fewer counterparties willing to lend metal
- Lease rates rise to compensate holders of physical silver for scarcity risk
- Higher lease rates signal to the broader market that physical availability is tightening
- Rising prices attract speculative participation, amplifying the demand side of the equation
- Premiums on physical metal over paper spot prices widen, signalling genuine scarcity
During the peak stress of the 2026 squeeze, this dynamic produced extreme readings across every metric. COMEX registered inventory saw a withdrawal of 33.45 million ounces in a single week in January 2026. London silver lease rates spiked to 30%, a threshold not breached since the Hunt Brothers episode in 1980. Freely circulating supply in London vaults was estimated at below 130 million ounces, and Shanghai inventories had declined by approximately 90% from their 2021 peak levels.
Exchange inventory availability dropped to just 17% of registered silver being freely deliverable at the height of the squeeze, a level that made systemic stress essentially inevitable given the sustained demand environment.
The $120 Per Ounce Event: What Converged and Why
Industrial Demand as the Structural Engine
Unlike previous silver price spikes, which were driven primarily by monetary demand or speculative cornering, the 2026 event was anchored in genuine industrial consumption that cannot be quickly substituted away. Furthermore, silver as a critical mineral has seen its industrial importance grow materially over the past decade, creating a demand base that is both large and relatively inelastic in its own right.
| Industrial Sector | Role in Silver Demand Growth |
|---|---|
| Solar Photovoltaics | Largest single industrial consumer; elevated demand despite sector-level fluctuations |
| Electric Vehicles | Rising silver content per unit as EV adoption accelerates globally |
| Artificial Intelligence Infrastructure | Data centres and power management systems increasing silver consumption |
| Nuclear Power | Emerging demand vector as energy transition technology mix diversifies |
Each photovoltaic cell contains silver paste used in electrical contacts. As global solar installation capacity has expanded dramatically since 2020, the cumulative silver demand from this sector alone has shifted the overall supply-demand balance materially. Electric vehicle production adds a distinct vector: modern EVs contain meaningfully more silver per unit than conventional internal combustion vehicles due to power electronics, battery management systems, and charging infrastructure. The growth of AI data centre infrastructure has introduced yet another demand stream through high-performance power delivery systems.
Regional Dynamics: China's Import Surge
One of the more consequential factors contributing to geographic supply stress was a substantial surge in Chinese silver imports alongside export restrictions that created regional premiums of 10 to 14% over Western paper prices. With China accounting for a large share of global solar manufacturing and EV production, its appetite for physical silver has a disproportionate influence on available global supply.
When Chinese demand accelerates at the same time Western exchange inventories are already depleted, the geographic arbitrage that would normally equalise prices becomes operationally constrained by refining capacity and logistics timelines. According to Reuters, silver faces its sixth consecutive year of deficit, with stock drawdowns raising squeeze risks well into 2026 and beyond.
Options Market Amplification: The Gamma Squeeze Overlay
Layered over the structural fundamental story was a technical market dynamic that amplified price moves beyond what underlying supply-demand metrics alone would predict. Options dealers who had sold call options to market participants were forced to hedge their short gamma exposure by purchasing the underlying silver as prices rose.
This mechanical buying, triggered by price movement itself, created a self-reinforcing acceleration dynamic in which rising prices forced additional buying, which forced further price rises. This phenomenon, widely observed in equity markets, operates with particular intensity when the underlying physical market is already constrained and dealers cannot easily source hedging material at prevailing prices.
The Correction to $80/oz: What It Actually Revealed
Following the $120 peak, prices corrected sharply to approximately $80 per ounce. The mechanisms behind this correction are instructive. Exchange operators implemented margin requirement increases, forcing leveraged positions to close rapidly. Simultaneous profit-taking by institutional participants, many of whom had entered before the squeeze intensified, accelerated the sell-off.
Crucially, however, this correction was a financial market event, not a physical market normalisation. The underlying supply-demand imbalance that produced the silver squeeze and physical silver shortage did not resolve during the correction. Lease rates remained elevated relative to historical norms, and industrial demand continued.
How Silver Actually Moves: Understanding the Physical Supply Chain
The Step-by-Step Flow from Retail to Exchange
The path that silver travels from a retail seller to exchange-registered inventory is layered and involves multiple intermediaries, each with their own commercial constraints:
- Retail investors sell silver to local dealers, who are motivated to move inventory quickly to avoid financing costs on dead inventory
- Local dealers consolidate holdings and sell to refineries, maintaining cash flow and avoiding carrying costs on illiquid stock
- Refineries receive diverse incoming silver, melt it to the required purity levels, and recast it into large-format good-delivery bars meeting exchange specifications
- Good-delivery bars are sold to institutional buyers and registered at exchanges, where they become part of the deliverable inventory that underpins spot pricing
- Exchange-registered inventory availability determines lease rates, liquidity conditions, and the baseline price discovery process
The Refinery Bottleneck: A Critical Chokepoint
During the 2026 squeeze, the sheer volume of silver being sold back into the system created a processing bottleneck at refineries. This is a lesser-understood vulnerability in the silver supply chain. Refinery capacity is finite and cannot be quickly scaled. When retail and institutional selling surges simultaneously, refineries face triage decisions about which incoming material to prioritise.
During peak 2026 stress periods, refineries deprioritised lower-purity silver, including sterling silver and constitutional (junk) silver, in favour of high-purity material that could be processed and converted to good-delivery bars more rapidly. This meant that holders of lower-purity silver faced longer processing timelines and reduced access to market liquidity precisely when they most wanted to transact.
This refinery prioritisation dynamic partly explains how exchange availability moved from 17% to an estimated 28% within months of the peak: as high-purity material worked through the refinery system efficiently, exchange-registered inventory rebuilt, lease rates stabilised, and the immediate crisis pressure moderated.
What Lease Rates Reveal That Spot Prices Do Not
Understanding Lease Rates as a Forward Stress Indicator
Silver lease rates represent the cost of borrowing physical silver from those who hold it, expressed as an annualised percentage. Under normal market conditions, lease rates are low, reflecting the relative abundance of loanable physical metal. When physical availability tightens, holders of physical silver demand higher compensation to part with it temporarily, driving lease rates higher. This makes lease rates a forward-looking stress indicator rather than a coincident one.
The historical comparison with the 1980 Hunt Brothers episode is worth examining directly:
| Metric | 1980 Hunt Brothers | 2026 Silver Squeeze |
|---|---|---|
| Peak Lease Rate | Extreme spike | ~30% |
| Primary Driver | Speculative market cornering | Structural industrial deficit |
| Exchange Inventory Stress | Severe | Severe |
| Physical vs. Paper Divergence | Significant | Significant |
| Regulatory Response | Rule changes (silver rule) | Margin hikes, no structural intervention |
Note: Historical lease rate data for 1980 is derived from market participant accounts and academic research on the Hunt Brothers episode. Direct numerical comparison should be treated with caution due to differences in market structure and data availability.
The critical distinction in the table above carries significant implications for investors. The 1980 event was artificial and corrected completely once the speculative position was unwound. The 2026 event was rooted in genuine multi-year structural deficits, meaning the resolution of the financial market squeeze does not eliminate the underlying imbalance. For a deeper examination of these dynamics, the silver market squeeze dynamics of recent years offer important context.
The next major ASX story will hit our subscribers first
Three Scenarios for What Comes Next
Scenario A: Deficit Persists and Inventories Drain Again
Analysts project the 2026 deficit to widen by approximately 15%, driven by continued lack of mining exploration investment and sustained industrial demand. If this trajectory continues:
- Exchange-held silver continues declining toward the critical thresholds that triggered the 2026 event
- Lease rates re-escalate as freely available silver falls below market-function thresholds
- The conditions for a repeat squeeze become structurally probable rather than merely possible
Scenario B: Demand Weakens and the Gap Narrows
Several legitimate risk factors could reduce demand pressure materially:
- A meaningful global economic contraction reducing industrial silver offtake across all sectors
- Underperformance in the solar sector driven by policy reversal or competition from alternative technologies
- Volatility in retail investment demand, which has historically been among the most unpredictable components of silver consumption
- Inventory restocking by institutional participants reducing the urgency of physical acquisition
Scenario C: Supply Response Partially Closes the Gap
Over a longer horizon, elevated prices can incentivise marginal mine development, though the timeline for any supply response is measured in years, not months. Simultaneously:
- Higher prices increase the economic viability of secondary silver recovery, potentially expanding recycling volumes
- Above-ground stocks could partially rebuild if industrial demand softens or recycling accelerates
- New discoveries and development projects could eventually contribute, though meaningful production is unlikely within a five-year window
None of these three scenarios eliminates structural deficit risk in the near-to-medium term. The underlying imbalance between inelastic supply and structurally entrenched industrial demand has not been resolved by the 2026 price event or the subsequent correction.
Positioning Strategies: What the 2026 Squeeze Taught Investors
Why Timing Ahead of Stress Outperforms Reactive Buying
The 2026 cycle made one investment principle empirically clear: investors who attempted to acquire physical silver during the peak of the squeeze faced materially worse outcomes than those who had positioned ahead of it. Peak periods brought significantly widened premiums over spot prices, extended delivery times as refineries processed backlogs, and reduced product availability across dealers. Attempting to chase momentum at the peak meant paying more for metal with less certainty about when it would arrive.
Product Liquidity Under Stress: Not All Silver Is Equal
One of the most practically valuable insights from the 2026 squeeze concerns the liquidity hierarchy among physical silver products when market stress is at its highest:
| Product Type | Liquidity Under Stress | Spread Behaviour | Refinery Acceptance |
|---|---|---|---|
| Government-Minted Coins (e.g., Silver Eagles) | High | Remained relatively stable | Prioritised |
| High-Purity Generic Bars | Moderate-High | Widened under peak demand | Generally accepted |
| Sterling / Constitutional Silver | Low | Significantly widened | Deprioritised |
US Mint products such as Silver Eagles demonstrated notably strong liquidity throughout the squeeze, remaining easier to sell when it mattered most. While generic bars may carry slightly tighter spreads under normal conditions, the value of liquidity under stress conditions became concretely apparent in 2026. The key principle is that widely recognised, high-purity products traded on global markets carry a liquidity premium that is largely invisible in calm conditions but becomes highly consequential during disorderly market episodes.
The Long-Run Return Context
Even setting aside squeeze scenarios entirely, silver's historical average annual return of approximately 8% provides a baseline that supports a disciplined, long-term allocation rationale. The speculative potential of a squeeze environment can make it easy to lose sight of the underlying investment case. However, the combination of structural industrial demand growth, constrained supply, and reasonable long-run returns creates a framework that does not depend on extreme events to justify positioning. In addition, gold-silver ratio analysis can provide further context for evaluating silver's relative value within a broader precious metals allocation.
Furthermore, as Stone X Bullion notes, understanding the mechanics of a silver squeeze and how it impacts markets is increasingly essential for investors navigating today's structurally tighter supply environment.
Frequently Asked Questions: Silver Squeeze and Physical Silver Shortage
What exactly is a silver squeeze?
A silver squeeze occurs when the gap between physically deliverable silver and paper claims on silver becomes so wide that the pricing mechanism breaks down. Physical metal is not available at the spot price, premiums widen dramatically, and prices are forced sharply higher until the scarcity is resolved or demand is rationed through price.
How is the 2026 squeeze different from the 1980 Hunt Brothers event?
The 1980 episode was driven by two brothers attempting to corner the silver market by accumulating an enormous position in physical and futures silver. The squeeze ended when regulatory bodies changed the rules and the position was unwound. The 2026 event was driven by genuine multi-year structural deficits and sustained industrial demand growth, meaning the resolution of the financial market stress does not eliminate the underlying imbalance.
Why did prices correct so sharply after reaching $120?
Exchanges implemented margin requirement increases that forced leveraged positions to close rapidly. Simultaneous profit-taking by institutional participants who had entered early accelerated the sell-off. The correction to approximately $80 per ounce reflected financial market mechanics, not a fundamental improvement in physical market conditions.
Can the silver squeeze happen again?
The structural conditions that produced the 2026 event, including persistent multi-year deficits, inelastic mine supply, growing industrial demand, and depleted exchange inventories, have not been fundamentally resolved. A repeat requires only that inventories continue to drain and demand remains elevated. While no specific outcome can be predicted with certainty, the structural prerequisites for a repeat remain in place.
Why does silver have a critical minerals designation in the United States?
The United States formally classified silver as a critical mineral in 2025, reflecting its strategic importance to energy transition infrastructure, defence applications, and advanced manufacturing. This classification reflects the industrial reality of silver's role in photovoltaic cells, electric vehicles, and electronics, though it should not be interpreted as project-specific support for any individual mining operation.
Is the physical silver shortage uniform across all regions?
No. The shortage has been most acute in London and across Asian markets, with regional premiums of 10 to 14% over Western paper prices observed at the peak. Geographic constraints on refining capacity and logistics prevent complete price equalisation across regions, meaning investors in different markets may experience materially different conditions during stress periods.
Key Structural Takeaways at a Glance
- Six consecutive years of deficits have drawn approximately 762 million ounces from global above-ground stocks since 2021
- 70% of silver supply comes as a byproduct of other metals, making it uniquely insulated from price-signal-driven supply responses
- Exchange lease rates and registered inventory availability are the most reliable leading indicators of squeeze conditions
- Industrial demand from solar, EVs, AI infrastructure, and nuclear power is structurally entrenched and not easily displaced by price increases
- Mine output fell approximately 2% in 2026 despite record prices, demonstrating the hard ceiling on supply responsiveness
- Product selection matters under stress: government-minted, widely recognised products maintained liquidity when lower-purity and less standardised silver did not
- Positioning ahead of squeeze conditions has consistently outperformed reactive acquisition during peak market stress
Disclaimer: This article is for informational and educational purposes only and does not constitute financial or investment advice. Commodity markets involve significant risk, including the potential loss of capital. The forward-looking scenarios, deficit projections, and price forecasts referenced in this article are drawn from industry sources and market estimates, which are subject to material revision. Past performance and historical patterns are not reliable indicators of future outcomes. Readers should conduct their own research and consult qualified financial professionals before making investment decisions.
Want to Catch the Next Major ASX Mineral Discovery Before the Market Does?
Discovery Alert's proprietary Discovery IQ model delivers real-time alerts on significant ASX mineral discoveries, translating complex geological and commodity data into clear, actionable insights for both short-term traders and long-term investors — begin your 14-day free trial today and see why early positioning consistently outperforms reactive decision-making, or explore Discovery Alert's dedicated discoveries page to understand the kind of historic returns that major mineral discoveries have delivered.