July 31, 2026
The Paradox at the Heart of Precious Metals: When Physical Scarcity and Monetary Policy Collide
Commodity markets operate on a deceptively simple premise: when supply falls short of demand, prices rise. Yet silver's behaviour in mid-2026 has exposed a fundamental flaw in that assumption. Fed rate expectations pressure silver despite a sixth straight supply deficit, creating a market environment where the laws of physical scarcity appear temporarily suspended by the gravitational pull of monetary policy.
This disconnect is not a market malfunction. It reflects a well-documented tension between the physical and financial dimensions of silver's dual role — one part industrial commodity, one part monetary asset — and understanding which dimension is currently dominant is critical for investors trying to interpret near-term price action against a long-term structural backdrop.
When big ASX news breaks, our subscribers know first
Why Silver Fell Nearly 2% While Its Supply Deficit Was Widening
Silver declined 1.89% to $57.60 per ounce as futures markets priced in roughly a one-in-three probability of a Federal Reserve rate increase. The move pushed silver toward the lower boundary of its established $55 to $61.30 trading range, a range that itself sits dramatically below silver's 2026 record high above $100.
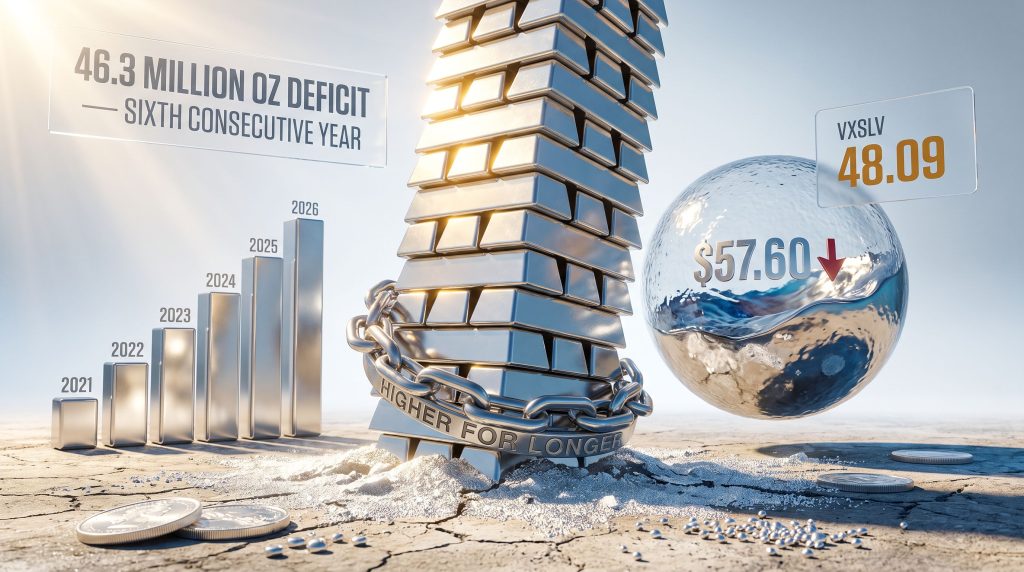
What makes this price action analytically interesting is the simultaneous release of data confirming that the physical silver market is tightening, not loosening. The World Silver Survey projected a 2026 annual supply deficit of 46.3 million ounces, up 14.9% from the 40.3 million ounce shortfall recorded in 2025. By any conventional commodity market framework, silver supply deficits of this magnitude should support prices. Instead, rate expectations are proving more powerful in the short term.
The reason comes down to silver's fundamental nature as a non-yielding asset. Unlike Treasury bonds, which generate interest income that rises in value alongside interest rates, silver produces no cash flow. When the Federal Reserve signals tighter monetary conditions, the opportunity cost of holding silver increases in direct proportion, and institutional capital reallocates accordingly.
Understanding the Three Transmission Channels From Fed Policy to Silver Prices
The pathway from Federal Reserve rate expectations to silver price pressure operates through three distinct but interconnected mechanisms, each of which compounds the others when hawkish signals emerge.
Channel 1: Dollar Strengthening
A hawkish Fed outlook typically lifts the US Dollar Index. Because silver is priced in US dollars globally, a stronger dollar makes the metal more expensive for buyers using other currencies, reducing international demand and applying direct downward price pressure.
Channel 2: Real Yield Expansion
When nominal interest rates rise faster than inflation expectations, real yields increase. Silver's inability to generate yield makes it comparatively less attractive as real returns on bonds improve, triggering position liquidation by yield-sensitive institutional investors.
Channel 3: Risk Appetite Compression
Rate hike expectations frequently compress broader risk appetite across markets. This often triggers simultaneous selling across commodity classes, with silver caught in the crossfire regardless of its specific supply-demand fundamentals.
Citadel Securities anticipated the Federal Reserve would raise rates as part of Chairman Kevin Warsh's emphasis on restoring inflation credibility. This interpretation reflects a broader market assessment that the Warsh-led Fed operates with a lower tolerance for above-target inflation than its predecessors, introducing a structurally higher baseline probability of rate action into precious metals pricing. Furthermore, those considering shorting precious metals in this environment should weigh the structural deficit carefully before committing to bearish positions.
The combination of dollar strength, real yield expansion, and compressed risk appetite can override months of physical supply support within a single trading session, highlighting why short-term silver price action requires a macro overlay on top of fundamental analysis.
The Six-Year Deficit Trajectory: What the Numbers Actually Reveal
The persistence of silver's supply deficit across six consecutive years represents a structural signal that goes well beyond cyclical market noise. Below is the trajectory of the imbalance since it began in 2021:
| Year | Deficit Status | Key Driver |
|---|---|---|
| 2021 | Deficit begins | Post-pandemic industrial demand recovery |
| 2022 | Widening | Solar manufacturing acceleration |
| 2023 | Continued | EV production scaling globally |
| 2024 | Continued | 5G infrastructure buildout adds demand layer |
| 2025 | 40.3 million oz | Structural demand growth outpaces mine supply |
| 2026 (Projected) | 46.3 million oz | Sixth consecutive annual shortfall |
The cumulative effect of these consecutive shortfalls has been a sustained drawdown in above-ground silver inventories. Measurable above-ground stocks have contracted by an estimated 762.1 million ounces since 2021, a figure that reflects genuine physical consumption rather than financial positioning changes.
This distinction matters enormously. Inventory drawdowns driven by financial speculation can reverse quickly when sentiment shifts. Drawdowns driven by industrial consumption — where silver is consumed in solar cells, EV components, and electronics manufacturing and cannot be easily recovered or recycled from those end uses — create a fundamentally different supply picture.
Industrial Demand: The Structural Engine Sustaining the Deficit
Silver's industrial demand profile is more complex than most investors appreciate. The five primary categories sustaining structural consumption growth include:
- Solar photovoltaic manufacturing uses silver paste as a conductor in solar cells, with each panel requiring measurable silver content that cannot currently be replaced by cheaper alternatives without sacrificing efficiency
- Electric vehicle production incorporates silver in charging infrastructure, battery management systems, and onboard electronics, with per-vehicle silver content growing alongside EV sophistication
- 5G telecommunications infrastructure relies on silver's superior electrical conductivity in high-frequency applications where signal integrity is paramount
- Medical and antimicrobial applications have expanded post-pandemic, with silver-based materials increasingly specified in healthcare environments
- Defence and precision electronics require silver in connectors, switches, and circuit boards where reliability under extreme conditions is non-negotiable
An important and underappreciated aspect of silver's industrial demand is its inelastic nature. Unlike investment demand, which can evaporate when prices rise or macro conditions change, industrial users need silver to manufacture their products. They cannot easily substitute it out, and they cannot defer purchases indefinitely. This creates a demand floor that persists through monetary policy cycles.
Mapping Silver's Price Architecture: Key Levels and Volatility Context
Understanding silver's price structure requires more than knowing where the metal is trading. The levels at which buyers and sellers have historically engaged provide a framework for interpreting where price is likely to find support or face resistance.
| Price Level | Market Significance |
|---|---|
| ~$54.00 | Strategic accumulation floor; identified downside correction target |
| $55.00 | Primary technical support; lower boundary of trading range |
| $56.81 | Near-term support tested ahead of Fed decision |
| $57.60 | Recent spot price following 1.89% decline |
| $61.30 | Upper resistance of current trading range |
| $65.00 | Next major resistance; approximately 13% above recent spot |
| $100+ | 2026 record high; prior cycle peak reference |
The Silver Volatility Index (VXSLV) closed at 48.09 ahead of the Federal Reserve decision, an elevated reading relative to historical norms. To contextualise this figure: volatility index readings above 40 typically indicate that options market participants are pricing in above-average price swings, often reflecting institutional hedging activity around binary macro events.
A reading of 48.09 suggests the market is treating the Fed decision as a genuine binary event with meaningful implications for silver's near-term price direction. Importantly, elevated volatility readings can compress quickly once the uncertainty resolves, which itself creates a post-decision trading dynamic where silver's physical fundamentals may reassert dominance.
Geopolitical Context: How the US-Iran Dynamic Fits Into Silver's Macro Picture
US-Iran diplomatic engagement contributed to lower oil prices ahead of the Fed decision, easing near-term inflation expectations at the margin. For silver, this created a modest tailwind through two pathways: reduced input costs for silver mining operations (which are energy-intensive), and slightly reduced pressure on the Fed to raise rates aggressively to combat energy-driven inflation.
However, President Trump's concurrent warning that military action remained a possibility maintained a residual geopolitical risk premium across commodity markets broadly. Neither development materially altered silver's physical supply-demand balance. The projected deficit of 46.3 million ounces exists independently of oil prices and geopolitical outcomes.
Geopolitical developments can shift the macro context around silver's monetary properties without touching its industrial supply-demand equation. Investors who conflate the two risk misreading both the risk and the opportunity.
The next major ASX story will hit our subscribers first
The Disciplined Accumulation Framework: Strategy Over Reaction
When monetary policy creates temporary price dislocations in commodities with structural supply deficits, the question for investors is not whether the discount represents value, but whether they have a framework for acting on it without being caught by further downside.
A disciplined approach to silver in this environment involves staged positioning across a defined price corridor rather than concentrated entry at any single level. The $54 to $61 zone has been identified as a strategic accumulation range by experienced silver market participants, with the lower end representing a level where physical buyers have historically stepped in to absorb macro-driven selling.
One documented approach to silver equity positioning illustrates the leverage dynamics involved. A silver mining equity position that reached gains of 217% at peak was partially liquidated at that level, with the net return after profit-taking recorded at 167%. This example highlights both the amplified return potential of silver equities relative to spot silver during recovery phases, and the importance of having pre-defined exit levels rather than allowing greed to erode realised gains.
Practical risk management considerations for silver exposure:
- Staged entry across the $54 to $61 range reduces average cost basis and limits the damage from continued near-term weakness
- Pre-defined profit targets at resistance levels ($65, and ultimately $100+) ensure gains are captured rather than surrendered in eventual reversals
- Instrument selection carries meaningful implications: physical silver, ETFs, CME futures contracts (each covering 5,000 troy ounces), CFDs, and mining equities each carry different leverage profiles, liquidity characteristics, and tax treatments
- The VXSLV reading at 48.09 serves as a real-time signal for position sizing, with elevated readings suggesting smaller initial positions ahead of the binary Fed event
Three Scenarios for Silver After the Fed Decision
The Federal Reserve's policy decision and accompanying guidance language will determine which of three trajectories silver follows in the near term.
Scenario 1: Fed Holds Rates (Dovish Outcome)
The dollar likely weakens, real yield expansion stalls, and market attention rotates back toward silver's unresolved structural deficit. A move toward the $65 resistance level, approximately 13% above the recent $57.60 spot price, becomes the primary target. The VXSLV likely compresses below 40 as uncertainty resolves.
Scenario 2: Fed Raises Rates (Hawkish Outcome)
Dollar strength and real yield expansion intensify downward pressure on silver. The $55 support level faces a genuine test, with risk of a move toward the $54 strategic accumulation zone. Physical buyers, who have demonstrated willingness to absorb supply at lower prices throughout the six-year deficit period, may provide a floor that limits the downside extension.
Scenario 3: Fed Holds With Hawkish Guidance (Mixed Outcome)
Short-term volatility spikes as markets parse the language of the policy statement for forward guidance signals. Silver likely remains range-bound between $55 and $61.30 in the immediate aftermath. Over a four-to-eight week horizon, the physical supply deficit re-emerges as the primary price driver as macro uncertainty fades.
The Fed's statement language will carry more market-moving weight than the rate decision itself. Markets that have already priced a one-in-three probability of a hike are sensitive to guidance that either confirms or undermines that probability for subsequent meetings.
Silver vs. Gold: Why the Deficit Matters More for One Than the Other
A comparison of silver and gold reveals why silver's supply deficit carries greater analytical weight for long-term price formation. Monitoring the gold-silver ratio during periods of macro-driven pressure can provide additional context for relative value positioning between the two metals.
| Metric | Silver | Gold |
|---|---|---|
| Industrial demand share | ~50%+ of total demand | ~10% of total demand |
| Consecutive supply deficits | 6 years | No comparable deficit |
| Volatility profile | Higher (VXSLV ~48) | Lower |
| Leverage to economic recovery | High | Moderate |
| Historical outperformance in recovery phases | Typically outperforms gold | Baseline precious metals return |
| Substitute availability in industrial uses | Very limited | Not applicable |
Silver's higher industrial demand component means its deficit is harder to resolve through demand destruction alone. Gold's demand is more discretionary: jewellery buyers and central banks can reduce purchases when prices rise. Silver's industrial consumers largely cannot.
This asymmetry explains why six consecutive years of silver deficits represent a more structurally significant condition than a comparable period of gold deficit would. It also explains why silver has historically delivered amplified returns relative to gold when precious metals recover from macro-driven corrections, and why the current rate-driven weakness, while real, does not alter the medium-to-long-term supply thesis.
What the Mine Supply Picture Cannot Fix
One dimension of silver's structural deficit that receives insufficient attention is the inability of the mining industry to respond rapidly to price signals. Silver production faces several constraints that limit supply-side correction even when prices are high enough to incentivise new development:
- Project development timelines from discovery to production typically span ten to fifteen years, meaning new supply decisions made today will not reach market until the mid-2030s at the earliest
- Declining ore grades at existing operations reduce the silver recovered per tonne of ore processed, meaning production volumes can fall even when mine throughput remains constant
- Byproduct dependency complicates silver supply dynamics: approximately 70-75% of silver production globally comes as a byproduct of lead, zinc, copper, and gold mining rather than from primary silver mines, meaning silver output is partially hostage to base metal economics
- Permitting and regulatory timelines in major silver-producing jurisdictions add further delays to supply-side responses
The byproduct dynamic is particularly underappreciated. When lead and zinc prices fall, primary metal producers reduce output, and silver production falls with it regardless of silver's own price level. This structural feature means the silver market cannot rely on its own price signal to fully correct a supply deficit, making the six-year shortfall — and the broader reality that Fed rate expectations pressure silver despite a sixth straight supply deficit — more entrenched than surface-level analysis would suggest.
Disclaimer: This article is intended for informational purposes only and does not constitute financial advice. Silver markets involve significant price volatility, and leveraged instruments including futures contracts and CFDs carry the risk of losses exceeding initial capital. Investors should conduct their own due diligence and consult a qualified financial adviser before making investment decisions. Forecasts and projections referenced herein, including World Silver Survey deficit estimates, represent analytical projections subject to revision.
Ready to Capitalise on the Next Major Mineral Discovery Before the Broader Market?
Discovery Alert's proprietary Discovery IQ model delivers real-time alerts on significant ASX mineral discoveries, transforming complex mineral data into clear, actionable insights for both short-term traders and long-term investors — explore the historic returns major discoveries have generated and begin your 14-day free trial at Discovery Alert to position yourself ahead of the market.