June 19, 2026
The Byproduct Problem: Why Silver Cannot Fix Its Own Supply Crisis
Most commodity markets possess a self-correcting mechanism. When prices rise, producers respond by opening new mines, accelerating drilling campaigns, and increasing output. Within a few years, the additional supply dampens the price signal that created it. Textbook commodity economics. The silver supply deficit and solar thrifting dynamic, however, tells a very different story.
Silver does not work this way. That structural quirk sits at the centre of one of the most misread stories in the metals market right now: the idea that a 19% reduction in solar silver demand is somehow bearish for silver's long-term outlook. It is not. To understand why, it helps to start not with the demand side of the equation but with the supply architecture that makes silver fundamentally different from other industrial materials.
Approximately 75% of all silver produced globally arrives as a byproduct of copper, lead, and zinc mining operations. Silver mine output is therefore governed by base metal economics, not by silver price signals. When the silver price climbs, primary silver miners benefit directly. However, they represent only a quarter of global supply. The other three-quarters of the market responds to copper demand cycles, zinc project economics, and lead ore grades — none of which have any mechanistic relationship to silver's price trajectory.
Primary silver mines are rare, capital-intensive, and subject to the same decade-long development timelines as any other hard rock mining project. The result is a supply structure that is inherently inelastic: it cannot surge when price demands it, and it cannot pivot when industrial consumption shifts direction. Furthermore, global silver mine supply is structurally constrained in ways that distinguish it from almost every other industrial commodity.
When big ASX news breaks, our subscribers know first
Six Years of Deficit: Reading the Cumulative Drawdown Correctly
Against that supply backdrop, the following data sequence deserves careful attention.
| Year | Annual Deficit (Moz) | Notable Driver |
|---|---|---|
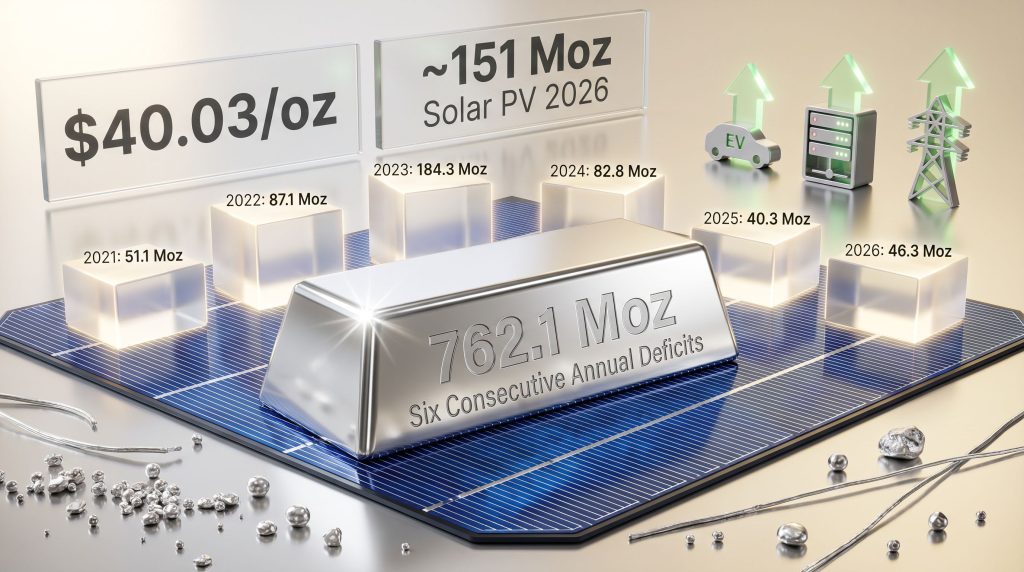
| 2021 | 51.1 | Post-pandemic industrial recovery |
| 2022 | 87.1 | Energy transition acceleration |
| 2023 | 184.3 | Peak solar silver demand |
| 2024 | 82.8 | Mine supply stabilisation |
| 2025 | 40.3 | Record recycling partially offsets gap |
| 2026F | 46.3 | Solar thrifting + supply contraction |
Source: Silver Institute / Metals Focus, World Silver Survey 2026 (April 15, 2026). 2026 figure is a forecast.
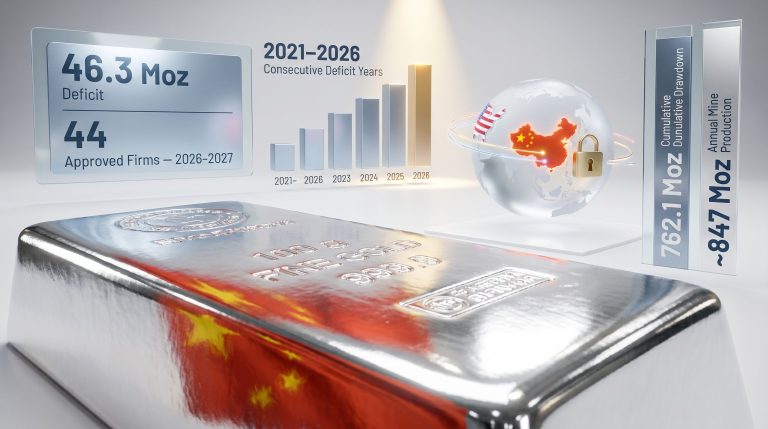
The World Silver Survey 2026, published by the Silver Institute and Metals Focus on April 15, 2026, confirms on page 17 that the global silver market has drawn down a cumulative 762.1 million ounces from above-ground stocks between 2021 and 2026 to cover these consecutive annual shortfalls. That figure is approaching a full year of total global mine output. It has no modern precedent in the silver market's recorded history.
The persistent silver supply deficits across this period make 2026 analytically interesting — not because the deficit exists, but because it is widening despite falling demand. The projected shortfall grows to 46.3 million ounces from 40.3 million ounces in 2025, even as solar manufacturers cut their silver consumption by roughly 35 million ounces year-on-year. That outcome requires explanation, and the explanation lies entirely on the supply side.
In 2025, total silver supply rose approximately 7%, benefiting from mine production gains and a 13-year high in recycling volumes as elevated prices incentivised scrap collection. In 2026, both of those dynamics are reversing simultaneously. Supply is contracting by roughly 2%. Demand is also falling by approximately 2%. When both sides of the ledger shrink at the same pace, the annual gap does not close. It widens.
Core Insight: The 2026 silver deficit is not a demand story. It is a supply story wearing demand's clothes. The headline solar reduction is real, but it is being outpaced by a supply contraction that receives far less analytical attention.
Silver Supply Deficit and Solar Thrifting: Understanding the Mechanism Behind the Headline
The term solar thrifting is frequently misunderstood, often conflated with substitution, and almost always misread as structurally negative for silver. Getting the definition right matters because the analytical conclusion changes entirely depending on which mechanism is actually occurring.
Thrifting vs. Substitution: A Definitional Framework
-
Thrifting refers to a process of using progressively less silver per unit of production. In photovoltaic manufacturing, this involves applying thinner conductive paste layers to each cell, tightening screen-printing tolerances, and redesigning contact geometry to achieve equivalent electrical performance with reduced material volume. Silver remains a core functional component. It is simply deployed more efficiently.
-
Substitution describes the replacement of silver with a chemically different material, such as copper or nickel-based pastes. In true substitution, silver exits the product architecture entirely and does not return regardless of price movements.
These are fundamentally different mechanisms with fundamentally different long-term implications. The 2026 solar reduction is classified as thrifting, not substitution. Silver remained the primary conductive material in the vast majority of commercially produced solar cells throughout 2026. Indeed, silver's dual demand profile as both an industrial and monetary metal adds further complexity to how markets interpret these signals.
Why Manufacturers Were Economically Compelled to Thrift
The economic rationale is straightforward. Silver paste has historically accounted for 10 to 20% of total solar cell manufacturing costs, according to the World Silver Survey 2026. As silver averaged $40.03 per ounce in 2025, representing a 42% year-on-year price increase, the incentive to reduce per-cell silver loading became intense.
The result was the largest single-year reduction in solar silver demand on record. According to PV industry analysts, PV silver consumption fell from approximately 186.6 million ounces in 2025 to roughly 151 million ounces in 2026, a decline of around 35 million ounces. That is a meaningful volume loss. However, it is also exactly what commodity price theory predicts: buyers economise when input costs rise sharply. The market functioned as designed.
Analytical Framework: When the price of a critical industrial input rises sharply, buyers adapt by using less per unit. That adaptation is evidence that the market is working, not evidence that the material is obsolete. The 2026 solar reduction reflects rational price response, not structural disengagement from silver.
Can Copper Fully Replace Silver in Solar Cells? The Technical Barriers Examined
The genuine structural risk to solar silver demand is not thrifting but full copper substitution, and that distinction matters considerably for the timeline of any demand impact.
The TOPCon Architecture Problem
The dominant solar cell design in mass commercial production is TOPCon (Tunnel Oxide Passivated Contact). This architecture operates at elevated processing temperatures and under high-voltage field conditions that create reliability challenges for copper-based conductive pastes. Copper oxidises more readily than silver under these conditions, forming resistive oxide layers at contact points that progressively reduce cell efficiency over its operating lifetime. Silver, by contrast, is chemically stable under these conditions, which is a primary reason it became the industry standard in the first place.
Some manufacturers are making genuine progress toward copper-paste commercialisation:
-
Longi Green Energy has targeted mass production of copper-paste solar cells from mid-2026, representing one of the more advanced timelines in the industry
-
Aiko Solar has already introduced silver-free cells into select market segments, demonstrating technical feasibility in specific cell architectures
Despite these advances, industry analysts tracking PV cell architecture place commercially viable, mass-scale copper substitution in TOPCon cells at 2028 to 2030. The unresolved engineering barrier is not whether copper can conduct electricity effectively in a fresh cell, but whether copper-paste cells can maintain their rated efficiency and reliability over a 25-year operating lifespan under real-world thermal cycling and electrical stress conditions.
Until that question is answered at scale, silver remains structurally embedded in the manufacturing economics of the dominant cell technology. As mining.com notes, solar thrifting alone is simply not sufficient to curb the broader trajectory of silver demand.
Three Demand Pools Growing as Solar Economises
The roughly 35 million ounces of silver leaving the solar sector in 2026 are not vanishing from industrial circulation. Three independent demand categories are expanding structurally and partially absorbing that volume.
Electric Vehicles: More Silver Per Vehicle, at Scale
Battery electric vehicles consume substantially more silver per unit than the vehicles they are replacing. According to the Silver Institute and Oxford Economics Silver, The Next Generation Metal report (December 2025):
-
A conventional internal combustion engine vehicle uses approximately 15 to 28 grams of silver
-
A battery electric vehicle uses roughly 25 to 50 grams, representing 67% to 79% more silver per unit
Silver is deployed across battery management systems, power electronics modules, motor control units, charging interfaces, and electrical contact points throughout the vehicle's architecture. As global EV production scales toward 15 million units projected in 2026, the aggregate silver volume is structurally meaningful.
The Silver Institute forecasts that EVs will account for 59% of total automotive silver demand by 2031 and will overtake internal combustion vehicles as the primary source of automotive silver demand as early as 2027. That transition represents a demand shift that compounds year-on-year rather than cycling with any single technology's price response.
AI Infrastructure and Data Centres: A Demand Signal Measured in Gigawatts
Silver possesses a combination of physical properties unmatched by any other element: it is simultaneously the best electrical conductor and the best thermal conductor of any known metal. In reliability-critical infrastructure where failure is not an acceptable outcome, those properties make silver the default engineering choice.
The scale of AI-driven infrastructure buildout translates this physical property advantage into a structural demand signal. According to the Silver Institute and Oxford Economics Silver, The Next Generation Metal report (December 2025), total global IT power capacity grew approximately 53 times between 2000 and 2025, from under 1 gigawatt to nearly 50 gigawatts. That represents a 5,252% increase in the volume of computing hardware, switchgear, power distribution units, and relay contacts in active deployment, all of which contain silver at critical connection points.
| Demand Category | 2025 Estimated Volume | 2026 Direction | Key Driver |
|---|---|---|---|
| Solar PV | ~186.6 Moz | Down |
Thrifting response to higher silver prices |
| Electric Vehicles | Growing | Structural increase | 25-50g per BEV; 67-79% more than ICE |
| AI Data Centres | Growing | Structural increase | 53x IT power capacity growth since 2000 |
| Grid Infrastructure | Growing | Structural increase | Multi-decade high grid investment (US/EU) |
| Total Industrial Fabrication | ~670 Moz (2025) | Down |
Solar decline outpaces other sector growth |
Sources: World Silver Survey 2026 (Silver Institute / Metals Focus); Silver, The Next Generation Metal (Silver Institute / Oxford Economics, December 2025)
Grid Infrastructure: The Overlooked Demand Pool Scaling With the Energy Transition
Every megawatt of renewable energy generation connected to an electrical grid requires transformers, switching gear, transmission hardware, and protection systems — all of which depend on silver at contact points where electrical conductivity cannot be compromised. Grid investment in both the United States and Europe is operating at multi-decade highs, driven simultaneously by the need to integrate renewable generation, supply the charging infrastructure for EV fleets, and feed the power-hungry data centres being constructed at scale.
Grid infrastructure silver demand carries a distinctive characteristic: it scales proportionally with the energy transition itself, not with any single technology category. Whether that transition is being driven by solar, wind, nuclear, or storage, the transmission and distribution infrastructure connecting generation to consumption remains silver-intensive throughout.
Physical Liquidity and the Gap Between Headline Inventory and Actual Availability
One of the least-discussed aspects of the silver supply deficit and solar thrifting debate is the distinction between reported above-ground inventory and physically available, unencumbered silver. These are materially different quantities, and the physical silver tightness observed in recent months underscores why this distinction matters.
In September 2025, available silver in London vaults fell to a historic low of 17% unencumbered. The remaining stock was committed to existing forward contracts, leasing arrangements, and other obligations. That tightness triggered a physical liquidity squeeze that sent silver lease rates to levels not previously recorded, reflecting genuine scarcity of metal available for immediate delivery rather than aggregate stock depletion.
That situation has moderated heading into 2026 but has not structurally resolved. The cumulative drawdown of 762.1 million ounces from above-ground stocks since 2021 represents irreplaceable depletion, not a temporary shift in warehouse location. When the reserve buffer narrows across multiple consecutive years, the relationship between headline inventory figures and actual physical liquidity diverges in ways that paper-market analysis consistently underweights.
Market Psychology Insight: Investors tracking reported inventory levels may significantly underestimate physical tightness when a large proportion of stated stocks are already encumbered. The 17% unencumbered figure recorded in September 2025 is a more accurate measure of available supply than total reported inventory would suggest.
The next major ASX story will hit our subscribers first
What the Sixth Consecutive Deficit Actually Signals
A single annual deficit in a commodity market is an event. Two consecutive deficits suggest a trend. Six consecutive deficits, accumulating to a drawdown approaching a full year of global mine output, represent a qualitatively different market condition: a structural mismatch between supply architecture and demand reality that cannot be resolved through normal market mechanisms.
Silver's byproduct mining structure means the industry cannot respond to this imbalance the way a primary commodity producer would. There is no switch to flip, no drilling campaign to accelerate, no inventory release that would materially alter the supply trajectory over a one-to-three-year horizon. Furthermore, the recognition of silver as a critical mineral in multiple jurisdictions has yet to translate into the policy-driven supply responses that such designations typically trigger. The inelasticity is geological and economic, not a function of industry reluctance.
Meanwhile, the demand side is diversifying rather than contracting. Solar is economising through thrifting, which is a rational price response with a finite floor determined by the minimum silver loading required to maintain cell electrical performance. Electric vehicles are adding silver demand that compounds with each production year. AI infrastructure is building out at a pace that the silver content of its hardware components translates into durable, structurally growing consumption. Grid investment provides a base layer that scales with the energy transition regardless of which generation technology leads.
The confluence of an inelastic supply structure, a six-year deficit sequence drawing down a finite reserve buffer, and three independently growing demand pools partially offsetting the one sector that is economising does not describe a market in structural retreat. It describes a market in which the headline noise and the underlying mechanism are pointing in opposite directions.
Understanding that distinction is the analytical work that separates informed structural positioning from reactive interpretation of individual data points. The silver supply deficit and solar thrifting story of 2026 is not a bearish signal dressed in bullish clothing. It is a structural case that becomes more legible, not less, when the mechanism behind the headline is properly understood.
Disclaimer: This article is for informational and educational purposes only and does not constitute financial or investment advice. All data referenced is sourced from publicly available reports including the World Silver Survey 2026 (Silver Institute / Metals Focus, April 15, 2026) and Silver, The Next Generation Metal (Silver Institute / Oxford Economics, December 2025). Forecasts and projections involve inherent uncertainty and may not reflect actual future outcomes. Readers should consult a qualified financial adviser before making any investment decisions.
Want to Stay Ahead of the Next Major Mineral Discovery?
Discovery Alert's proprietary Discovery IQ model scans ASX announcements in real time, instantly identifying high-potential opportunities across silver and more than 30 other commodities — turning complex market signals into clear, actionable insights for both traders and long-term investors. Explore how historic mineral discoveries have generated significant returns on Discovery Alert's dedicated discoveries page, and begin your 14-day free trial today to position yourself ahead of the broader market.