June 12, 2026
When Commodity Cycles and Structural Reform Collide: Reading South Africa's 2026 Mineral Revenue Story
Resource economies operate in cycles, but not all upswings are created equal. Some revenue surges reflect temporary price spikes that mask deteriorating volumes underneath. Others represent genuine operational recoveries where both price and production momentum align simultaneously. Understanding which category a given revenue acceleration falls into is the difference between informed capital allocation and misreading a short-term signal as a structural shift.
South Africa's mining sector in early 2026 is presenting investors, policymakers, and industry observers with exactly this analytical challenge. The numbers are striking, the commodity mix is broad, and the production data is corroborating the revenue story. However, the conditions sustaining this performance are not unconditional, and the policy environment surrounding the sector carries its own set of unresolved constraints.
When big ASX news breaks, our subscribers know first
South Africa April Mineral Sales Surge: The Numbers Behind the Headline
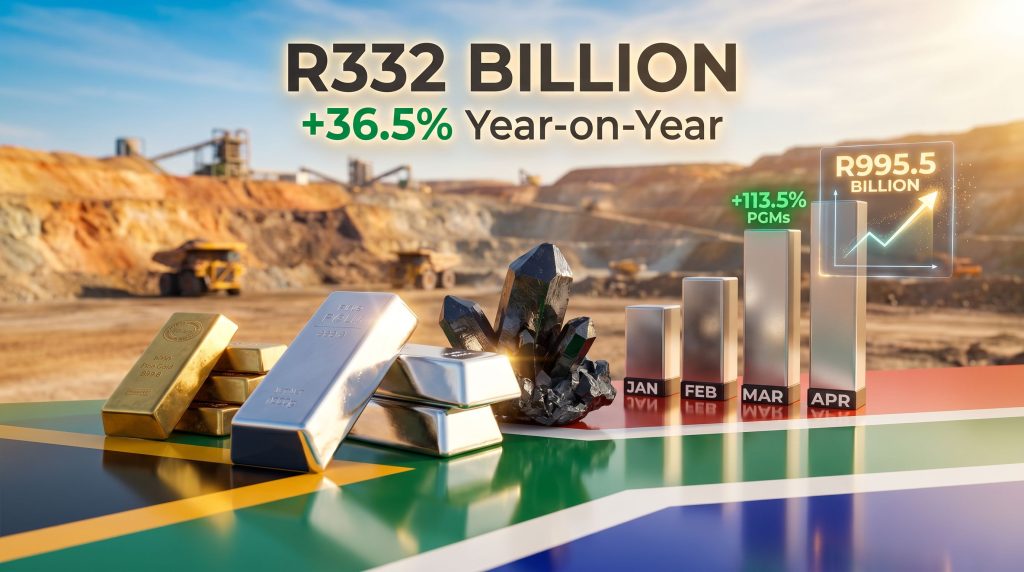
The Minerals Council South Africa has reported that total mineral sales for the four months from January to April 2026 reached R332 billion, representing a year-on-year increase of R89 billion, equivalent to 36.5% growth compared with the same four-month window in 2025.
This is not a one-quarter anomaly. The momentum was already evident in the Q1 2026 figures, where mineral sales reached R242.4 billion, reflecting 38.5% year-on-year growth. March 2026 alone recorded R82.4 billion in mineral sales, up 30.2% year-on-year. April's contribution extended the run.
The Minerals Council has projected that if this trajectory holds, South Africa April mineral sales surge momentum could carry full-year 2026 mineral sales toward R995.5 billion, a figure that would represent an extraordinary annual milestone for the sector.
| Metric | Value | Year-on-Year Change |
|---|---|---|
| Total mineral sales (Jan-Apr 2026) | R332 billion | +36.5% |
| Year-on-year revenue increase | R89 billion | vs. Jan-Apr 2025 |
| Q1 2026 mineral sales | R242.4 billion | +38.5% |
| March 2026 mineral sales | R82.4 billion | +30.2% |
| April 2026 mining production | Volume data | +8.2% y/y |
| Full-year 2026 projection | R995.5 billion | Conditional |
A critical analytical distinction applies here: mineral sales figures measure the rand value of commodities transacted in the market, while production output data from Statistics South Africa captures physical extraction volumes. When both indicators move upward at the same time, it signals a compounding effect where genuine operational output growth is amplifying price-driven revenue gains rather than one masking weakness in the other.
Which Commodities Are Powering the South Africa April Mineral Sales Surge?
Platinum Group Metals: The Standout Performer
No single commodity category has contributed more dramatically to the 2026 mineral sales acceleration than platinum group metals. PGM sales recorded a 113.5% year-on-year increase in March 2026, making them the largest positive contributor to the January-to-April cumulative figure by a considerable margin. Furthermore, the platinum and palladium dynamics at play globally are reinforcing South Africa's structural advantage as the world's dominant producer of these metals.
South Africa's dominance in this space is structural, not incidental. The country holds approximately 75% of global platinum reserves and is the world's leading producer of the platinum group suite, which includes platinum, palladium, rhodium, iridium, ruthenium, and osmium. This concentration of reserve endowment means that when global PGM prices move, South Africa's rand-denominated revenue impact is disproportionately large relative to other producer nations.
What makes the 2026 PGM picture particularly interesting is the demand-side complexity. Autocatalyst applications, which convert harmful exhaust gases in internal combustion vehicles, have historically been the dominant demand driver for platinum and palladium. However, hydrogen fuel cell technology is emerging as an additional demand vector, particularly for platinum. Fuel cells use platinum as the catalyst in the electrochemical reaction that generates electricity from hydrogen, and as green hydrogen infrastructure scales globally, this demand pathway is expected to grow in strategic importance alongside the traditional automotive channel.
Gold: Elevated Spot Prices Amplifying Rand Revenue
Gold sales rose 51.7% year-on-year in March 2026, establishing the metal as the second major contributor to the four-month aggregate. With global gold spot prices above $4,195 per ounce as of mid-June 2026, the translation into rand-denominated sales figures has been substantial. In addition, understanding the broader gold market outlook helps contextualise why elevated prices are persisting rather than retreating.
The relationship between gold's US dollar price and South African mining revenue involves a currency dimension that is often underappreciated. When the rand weakens against the dollar, rand-denominated gold revenue increases even if the dollar price holds steady. The current exchange rate environment, with the rand trading around R16.30 to the US dollar, means South African producers are capturing elevated gold prices through a lens that further amplifies the local currency value of every ounce sold.
Chromium Ore: Industrial Recovery in the Numbers
Chromium ore sales increased 38.6% year-on-year in March 2026, positioning chromium as the third major contributor to the four-month revenue figure. South Africa holds the world's largest known chromite ore reserves, primarily concentrated in the Bushveld Igneous Complex, the same geological formation that hosts the country's PGM endowment.
Chromium's demand story in 2026 is being shaped by two partially competing forces. The traditional stainless steel demand pathway, which accounts for the majority of global chromium consumption, is recovering from the demand weakness of prior years. Simultaneously, chromium's emerging role as a battery material in certain lithium-ion chemistries is adding a new demand layer that analysts are watching closely for its long-term volume implications.
Coal: Export Revenue Persisting Amid Transition Headwinds
Coal remains among the top four positive contributors to the January-to-April aggregate, though its trajectory carries more structural uncertainty than the other three commodity categories. Asian export markets, particularly in India and Southeast Asia, continue to absorb South African thermal and metallurgical coal. However, Transnet Freight Rail's capacity constraints at Richards Bay Coal Terminal remain a persistent ceiling on achievable export volumes, meaning that revenue performance in coal is operating below its potential output ceiling.
| Commodity | March 2026 YoY Sales Growth | Aggregate Contribution Rank |
|---|---|---|
| Platinum Group Metals | +113.5% | 1st (largest) |
| Gold | +51.7% | 2nd |
| Chromium Ore | +38.6% | 3rd |
| Coal | Not separately disclosed | 4th |
Production Data Confirming the Sales-Side Story
Statistics South Africa's April 2026 mining production data reported an 8.2% year-on-year increase in physical output volumes, with PGMs, manganese, and chrome identified as the primary drivers. According to Engineering News, this production-side confirmation matters analytically because it eliminates the possibility that the revenue surge is purely a price phenomenon masking flat or declining volumes.
However, investors should understand the lag mechanics involved. Production increases recorded in April do not immediately convert into equivalent sales figures for the same calendar month. Processing timelines, logistics lead times, and contract settlement periods typically create a four-to-eight week lag between extraction and sales recognition. This means April's strong production figures are likely to flow into May and June sales data rather than appearing in full within the April sales numbers themselves, creating a sequential tailwind that may sustain momentum into Q3 2026.
The Fiscal Multiplier: Mining's Contribution Beyond Revenue
The Minerals Council South Africa has highlighted that the projected increase in corporate tax contributions from mining in 2026 reinforces the sector's dual role: it is simultaneously a direct revenue generator for the national fiscus and a catalytic enabler of broader economic activity.
Mining's fiscal contribution flows through multiple channels:
- Corporate income tax paid on mining profits
- Royalties levied on mineral extraction volumes and values
- Pay-as-you-earn tax collected from mining sector employees
- Indirect contributions through supply chain expenditure and community economic activity
The fiscal multiplier effect extends further than direct tax receipts. Mining expenditure activates upstream supply chains covering explosives, reagents, equipment, fuel, and engineering services. It sustains downstream processing industries. And it generates community-level economic circulation in regions where alternative employment options are limited. This is the basis on which the Minerals Council argues that mining functions as a catalyst for sustainable economic growth rather than simply a commodity export mechanism.
The Policy Enablement Gap: Where Revenue Potential Meets Structural Constraint
The Minerals Council South Africa has been explicit in calling for enabling policy frameworks that support and attract investment across the entire mining value chain. This is a strategically significant statement because it identifies policy architecture, not commodity prices, as the primary variable separating South Africa's current revenue performance from its long-term investment potential. Consequently, the South Africa mining decline narrative of recent years serves as a useful benchmark against which this recovery must be assessed.
Several structural policy areas require attention:
- Permitting timelines: Delays in environmental authorisations and mining right renewals extend project development timelines and increase capital uncertainty for investors
- Regulatory consistency: Frequent amendments to the Mineral and Petroleum Resources Development Act create planning uncertainty that weighs on long-cycle investment decisions
- Beneficiation incentives: South Africa exports significant volumes of unprocessed or minimally processed minerals, losing the value addition that would occur through domestic refining, smelting, and manufacturing
- Infrastructure access: Equitable access to Transnet rail and port infrastructure remains a constraint on independent and junior miners seeking to export at scale
The Minerals Council's position is that policymakers must implement conditions not only to sustain existing investment flows but to actively attract new capital across the full mining value chain, from greenfield exploration through to downstream processing and refining.
The energy supply dimension has improved materially in 2026. The reduction in load-shedding frequency relative to 2024 and 2025 has lowered operational costs for energy-intensive mining and processing operations, particularly PGM smelters and chrome ferrochrome producers. This improvement, while not a policy intervention directed at mining specifically, has had a measurable positive effect on operational margins across the sector.
The next major ASX story will hit our subscribers first
Scenario Analysis: Three Pathways for H2 2026
The Minerals Council's R995.5-billion full-year projection carries explicit conditionality, citing Middle East geopolitical tensions and elevated fuel costs as the two primary risk variables. A structured scenario framework helps clarify the range of outcomes.
Scenario 1: Base Case (Trend Continuation)
Current commodity price levels hold, Transnet logistics performance remains stable, no material escalation of geopolitical disruptions. The R995.5-billion projection is achievable, and corporate tax contributions from mining increase materially relative to 2025.
Scenario 2: Upside Case
PGM prices strengthen on additional hydrogen economy momentum, gold holds above $4,000 per ounce, Transnet rail throughput improves following ongoing rehabilitation investments, and additional foreign direct investment commitments are announced. Full-year mineral sales potentially exceed R1 trillion for the first time in the country's history.
Scenario 3: Downside Case
Middle East conflict escalates into a broader energy market disruption, oil prices spike materially, fuel costs compress mining operating margins, and global industrial demand softens. The full-year figure falls short of the R995.5-billion projection, with PGMs and gold remaining resilient while coal and chrome face greater pressure.
Key Metrics to Monitor Through H2 2026
- Monthly Stats SA mining production releases for May and June
- Platinum, palladium, and rhodium spot price trajectories
- Gold price performance relative to US dollar strength and Federal Reserve policy signals
- Transnet Freight Rail coal and chrome throughput data from Richards Bay and Saldanha Bay
- South African Reserve Bank commodity export earnings reports
- Any legislative amendments affecting mining rights, environmental compliance timelines, or beneficiation obligations
Furthermore, the broader context of critical minerals demand driven by the global energy transition will continue to shape the medium-term outlook for several of South Africa's key export commodities, particularly PGMs and chromium.
Frequently Asked Questions: South Africa's 2026 Mineral Sales Performance
What Drove the South Africa April Mineral Sales Surge in Early 2026?
The acceleration was primarily driven by exceptional year-on-year gains across four commodity categories: platinum group metals (up 113.5% in March), gold (up 51.7%), chromium ore (up 38.6%), and coal. Both price elevation and improved production volumes contributed, making this a compound revenue event rather than a price-only phenomenon.
Why Are PGMs the Dominant Revenue Contributor?
South Africa holds approximately 75% of global platinum reserves and produces the majority of the world's PGMs. When global platinum and palladium prices rise, the revenue impact on South Africa's mining sector is structurally disproportionate relative to any other producer nation. Improved operational performance at major PGM mining operations in early 2026 compounded the price effect.
What Risks Could Prevent the R995.5-Billion Full-Year Projection from Being Achieved?
The Minerals Council identifies Middle East geopolitical conflict escalation and persistently high fuel costs as the two primary downside risks. Both variables can simultaneously compress operating margins and reduce global commodity demand, creating a dual-sided revenue headwind.
How Does Mining Contribute to South Africa's Government Revenue?
Through corporate income tax, mineral royalties, and employee PAYE contributions. The projected increase in corporate taxes from mining in 2026 is cited as evidence of the sector's ongoing and growing fiscal significance to the South African government.
Disclaimer: This article contains forward-looking projections and scenario analyses based on publicly available data and industry commentary. All financial projections, including the Minerals Council South Africa's R995.5-billion full-year estimate, are conditional on assumptions that may not be realised. Nothing in this article constitutes financial or investment advice. Readers should conduct independent due diligence before making any investment decisions.
For ongoing coverage of South Africa's mineral sector statistics and production data, Mining Weekly at miningweekly.com provides regular reporting on commodity sales figures, policy developments, and operational updates across all major mining categories.
Want to Capitalise on the Next Major Mineral Discovery Before the Broader Market?
South Africa's 2026 mineral sales surge illustrates how swiftly commodity momentum can compound returns — and Discovery Alert's proprietary Discovery IQ model ensures subscribers receive real-time alerts on significant ASX mineral discoveries the moment they are announced, turning complex mineral data into actionable insights. Explore historic examples of exceptional discovery outcomes and begin your 14-day free trial today to position yourself ahead of the market.