June 16, 2026
The Hidden Cost Multiplier Reshaping South Africa's Mining Sector
Few forces in resource economics are as underappreciated as the compounding effect of energy cost inflation on heavily capitalised, operationally intensive industries. When crude oil prices surge due to geopolitical disruption, the downstream impact on mining operations is rarely linear. It arrives in layers: higher diesel costs at the pump, elevated haulage rates from logistics contractors, increased generator fuel bills at remote processing facilities, and inflated maintenance costs for fuel-dependent equipment. For South Africa's mining sector in 2026, all of these layers have arrived simultaneously.
Understanding why South Africa mining fuel prices have become one of the sector's most critical cost variables requires examining three intersecting systems: the structure of the country's regulated fuel pricing mechanism, the commodity-specific margin profiles of its major mining segments, and the external geopolitical forces now feeding directly into domestic operational economics. Furthermore, the South Africa mining decline narrative from 2025 provides essential context for understanding how the sector arrived at this inflection point.
When big ASX news breaks, our subscribers know first
South Africa's Fuel Pricing Architecture: A System Built for Cost Transmission
Most mining operators globally have some ability to hedge energy costs through forward contracts, deregulated supply agreements, or fuel-switching. South Africa's structure limits these options significantly for pump-price diesel. The country's Department of Mineral and Petroleum Resources administers a tightly regulated monthly pricing cycle, with adjustments applied on the first Wednesday of each calendar month.
The formula feeding this cycle is multilayered. At its core sits the Basic Fuel Price (BFP), which converts international crude oil benchmarks into rand-denominated costs at the prevailing exchange rate. Surrounding this core are fixed and variable components that stack additional costs onto every litre dispensed at a mine site:
- The Basic Fuel Price derived from international crude converted at the rand/USD exchange rate
- Government fuel levy applied as a fixed per-litre charge
- Road Accident Fund levy as a statutory per-litre contribution
- Wholesale and retail distribution margins built into the regulated structure
- Transport zone differentials reflecting distance from coastal refineries
- Customs and excise duties on refined product imports
A critically underappreciated element of this structure is the transport zone premium. Mining operations in Limpopo, Mpumalanga, and the Northern Cape are geographically remote from South Africa's coastal refineries at Durban and Cape Town. These inland locations attract a transport surcharge built into the regulated formula, meaning that mines in these provinces structurally pay more per litre than coastal pump prices would suggest. This inland premium can add meaningfully to the already elevated base price during periods of international crude oil escalation.
The combination of rand weakness and elevated crude prices creates a compounding effect within the BFP formula that is particularly punishing for inland mining provinces. Neither variable needs to be extreme in isolation; their simultaneous movement in the same direction amplifies the cost impact substantially.
The Geopolitical Catalyst and Its Transmission to South African Mine Sites
The geopolitical conflict involving Iran and regional actors in West Asia has driven sustained upward pressure on international crude oil benchmarks throughout early 2026. Because South Africa imports refined petroleum products and relies on international crude pricing to set the BFP, these developments thousands of kilometres away translate with mathematical precision into higher costs at mines across the country's interior.
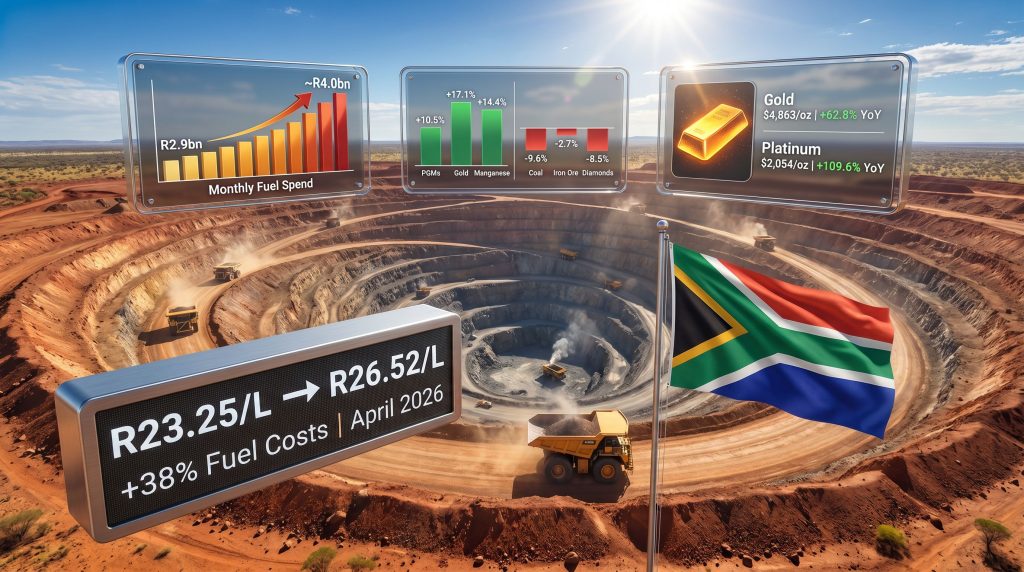
The scale of this transmission is visible in the petrol price trajectory from April to May 2026: unleaded 93 petrol rose from R23.25 per litre on 1 April 2026 to R26.52 per litre by 6 May 2026, an increase of more than 14% within a single monthly adjustment cycle. For diesel-dependent mining operations running fleets of haul trucks, underground loaders, and drilling rigs, this pace of escalation compresses operational margins in real time.
The aggregate financial impact is stark. According to the Minerals Council South Africa (MCSA), the sector's average monthly fuel expenditure rose from R2.9 billion in 2025 to approximately R4.0 billion in April 2026, representing a year-on-year increase of roughly 38%.
| Period | Estimated Monthly Sector Fuel Spend |
|---|---|
| 2025 Annual Average | R2.9 billion |
| April 2026 | ~R4.0 billion |
| Year-on-Year Change | +38% |
What makes this particularly challenging from an operational planning perspective is the one-month lag built into the BFP adjustment cycle. Mine operators know that price changes are coming but have limited ability to adjust output or procurement in the narrow window between international price movement and domestic application.
Production Performance in March 2026: A Sector Splitting at the Seams
The fuel cost surge has not hit all mining segments equally, and the March 2026 production data reveals a sector fracturing along commodity-specific fault lines. Overall year-on-year production growth decelerated sharply to 2.5% in March 2026, down from 9.7% in February and 4.6% in January, pointing to accelerating cost pressure as fuel price increases accumulated.
Commodities Sustaining Growth
The segments collectively representing 43.2% of the total mining production basket managed positive year-on-year growth:
-
Platinum Group Metals (PGMs): +10.5%, contributing 2.6 percentage points to the overall index. Improved operational stability relative to the prior year combined with a base effect from recovering internal combustion engine (ICE) vehicle demand supported output. This is a nuanced dynamic: the long-term electrification narrative pressures PGM demand, but near-term ICE vehicle production recovery has provided a counterbalancing floor.
-
Gold: +17.1%, contributing 1.6 percentage points. Gold reached $4,863 per ounce in March 2026, a 62.8% year-on-year increase, creating powerful economic incentives to maximise output at existing operations. Geopolitical uncertainty has historically reinforced gold safe-haven demand, and 2026 is providing a textbook demonstration of that dynamic.
-
Manganese: +14.4%, contributing 1.1 percentage points. Chinese import demand has been the primary driver, with China's manganese ore imports surging 38% month-on-month to 3.2 million tonnes in March 2026. South Africa's direct exports to China climbed from 1.4 million tonnes to 2.2 million tonnes year-on-year, reflecting the country's dominant position in global manganese supply.
Commodities Under Structural Pressure
The segments representing 44.8% of total mining production contracted year-on-year:
-
Coal: -9.6%, subtracting 2.5 percentage points. This marks the sixth consecutive month of year-on-year output decline. A critical and often overlooked dimension of South Africa's coal market is that domestic demand accounts for more than two-thirds of total consumption, predominantly through power generation. Even as export volumes grew 9.8% year-on-year and shipments to India climbed 19.7% following a 71.8% surge in February, the domestic demand softening is sufficiently large to override export gains at the aggregate production level.
-
Iron Ore: -2.7%, subtracting 0.5 percentage points. The fourth production decline in five months. A single mine entering care-and-maintenance status in November 2025 after losing its only domestic customer created a base effect that has weighed on the aggregate figure. Notably, export volumes grew 21.3% year-on-year and shipments to the China iron ore market increased 29.4%, underlining that this is a domestic demand problem rather than a competitiveness failure on global markets.
-
Diamonds: -8.5%, subtracting 0.5 percentage points. Following a brief February recovery of 13.1%, the downward trajectory has resumed. The MCSA is actively engaging with industry stakeholders to explore potential relief frameworks, reflecting the depth of pressure facing this segment.
Revenue Performance Tells a Different Story
The cost pressure narrative sits in stark contrast with the sector's revenue performance, creating an unusual situation where mining companies are simultaneously experiencing record income and record cost inflation. Year-to-date mineral sales through March 2026 reached R242 billion, up R67.4 billion (39%) compared to the same period in 2025.
The commodity price movements driving this outcome are extraordinary, particularly across the precious metals complex:
| Commodity | March 2026 Price | Year-on-Year Change |
|---|---|---|
| Platinum | $2,054/oz | +109.6% |
| Rhodium | $11,285/oz | +105.7% |
| Gold | $4,863/oz | +62.8% |
| Palladium | $1,556/oz | +62.4% |
| Coal | $111.1/tonne | +24.9% |
| Iron Ore | $107.6/tonne | +3.8% |
PGM sector sales in March 2026 alone reached R25 billion, up 113.5% year-on-year, while gold sector sales of R15.3 billion represented a 51.7% increase. The revenue buffer created by these price gains is substantial for precious metals producers, but it is critically uneven. Coal and iron ore operators are absorbing the same fuel cost escalation with only modest commodity price support, creating a growing divergence in financial resilience across the sector.
The extraordinary precious metals price cycle of 2026 is masking underlying structural vulnerabilities in South Africa's bulk minerals segments. When commodity prices eventually normalise, the accumulated cost inflation in fuel and other energy inputs will become far more visible in mining company financial results.
The Diesel Substitution Problem: Why Mining Cannot Simply Switch Fuels
A question frequently raised by investors and analysts is why South Africa's mining sector cannot accelerate its shift away from diesel dependency. The answer involves both technical and economic constraints that are often underappreciated outside the industry.
In stationary power applications such as processing plant generators, the transition to grid electricity or renewable energy in mining alternatives is technically feasible and actively underway across several large operations. However, mobile mining equipment presents a fundamentally different challenge:
-
Large haul trucks operating in open-pit mines typically have diesel engines with power outputs of 1,500 to 3,500 kilowatts, requiring energy storage or transmission systems that battery technology cannot yet match at competitive total cost of ownership.
-
Underground mining equipment faces the additional constraint that electrification requires extensive fixed infrastructure investment, including trolley line systems or battery-swap networks, with payback periods that may not align with remaining mine life projections.
-
The capital cycle for heavy mining equipment typically runs 10 to 15 years, meaning that even where next-generation electric equipment exists, fleet replacement cannot be accelerated quickly without stranded asset write-offs.
This structural inertia means that South Africa mining fuel prices will remain a primary operating cost variable for the majority of the sector's production base throughout the foreseeable planning horizon. Consequently, the broader mining energy transition will need to accelerate significantly if operators are to meaningfully reduce diesel dependency over the medium term.
The next major ASX story will hit our subscribers first
Regional Competitiveness Implications
South Africa's fuel price escalation carries consequences beyond its borders, influencing how the country competes with peer African mining jurisdictions for future capital allocation decisions.
| Country | Fuel Cost Context | Mining Investment Climate |
|---|---|---|
| South Africa | Regulated monthly pricing; inland transport premium | Established infrastructure; rising operational costs |
| Zambia | Partially subsidised fuel for key industries | Copper belt operations benefit from cost support |
| Tanzania | Moderate and partially regulated pricing | Competitive for greenfield development |
| Ghana | Market-linked pricing with currency volatility risk | Active gold sector; import-dependent fuel supply |
| DRC | Variable; logistics costs often dominant burden | Rich mineral endowment; infrastructure constrained |
The competitive dynamic is not simply about pump prices. South Africa offers infrastructure advantages including rail, port, and processing capacity that frontier jurisdictions cannot match. However, as the fuel cost gap between South Africa and peers widens, the threshold calculation for directing marginal capital into new projects shifts incrementally in favour of lower-cost alternatives.
Forward Outlook and Scenario Framework
The MCSA projects a 0.3% quarter-on-quarter increase in mining production for Q1 2026 under baseline assumptions. The trajectory from this point depends heavily on two variables: international crude oil price direction and rand performance against the US dollar. According to recent government announcements, policymakers are actively monitoring these dynamics and their downstream effects on industry.
| Scenario | Key Conditions | Production Outlook |
|---|---|---|
| Base Case | Crude stabilises; rand holds current levels | +0.3% to +1.5% QoQ growth |
| Downside Case | Oil escalates further; rand weakens past R20/USD | Output curtailment in coal and iron ore; margin contraction |
| Upside Case | Geopolitical de-escalation; crude falls below $75/bbl | Fuel relief restores margins; production accelerates across segments |
The policy interventions under active discussion within the MCSA framework include:
- Expanded diesel rebate mechanisms for qualifying mining operations
- Accelerated permitting for renewable energy installations at mine sites
- Beneficiation incentive structures to increase domestic value retention
- Targeted relief measures for distressed commodity segments including diamonds
Whether these frameworks translate into meaningful cost relief within the current pricing cycle remains an open question. Investors should treat forward production forecasts with appropriate caution given the fluid geopolitical environment feeding into South Africa mining fuel prices.
This article contains forward-looking statements and projections based on data available as of the reporting period. Commodity prices, production volumes, and fuel costs are subject to rapid change. This content is intended for informational purposes only and does not constitute financial or investment advice. Readers should conduct their own due diligence before making any investment decisions.
Want To Identify The Next Major ASX Mineral Discovery Before The Market?
Discovery Alert's proprietary Discovery IQ model delivers real-time alerts on significant ASX mineral discoveries, transforming complex mineral data into actionable insights for both short-term traders and long-term investors — explore how historic discoveries have generated substantial returns and begin your 14-day free trial at Discovery Alert to gain a market-leading edge.