July 14, 2026
When Revenue Outpaces Output: Understanding South Africa's Mining Paradox
The relationship between what a mining sector produces and what it earns from selling that production is rarely straightforward. When those two metrics diverge sharply, it reveals something fundamental about the forces shaping sector performance at any given moment. In South Africa's case, the first quarter of 2026 has delivered exactly that kind of divergence, offering investors, analysts, and policymakers a nuanced picture that requires careful disaggregation to interpret correctly.
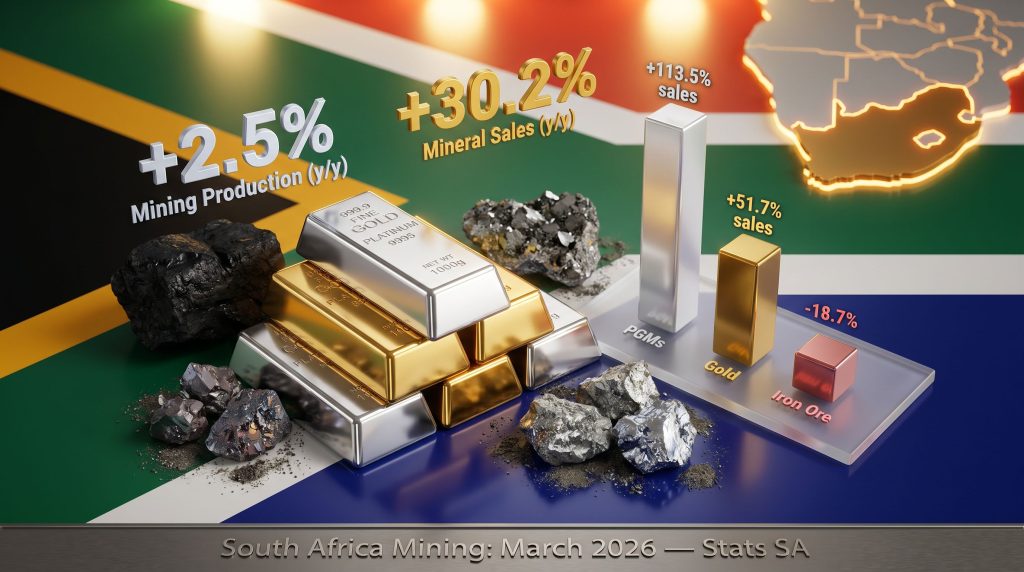
South Africa mining production and mineral sales in March present a striking contrast: output volumes grew by a measured 2.5% year-on-year, while mineral sales at current prices surged 30.2% year-on-year over the same period, according to Statistics South Africa (Stats SA). That is a gap of more than twelvefold between the two metrics, and the explanation for it lies not in operational breakthroughs or newfound productivity, but primarily in commodity price appreciation concentrated in a small number of metals.
Understanding this distinction is not merely academic. It shapes how the sector's apparent strength should be weighted, how capital allocation decisions are made, and what risks remain unresolved beneath the headline figures. Furthermore, the broader context of South Africa mining decline in recent years makes these mixed signals all the more significant to interpret carefully.
When big ASX news breaks, our subscribers know first
PGMs and Gold: Carrying the Sector on Their Shoulders
The standout story in March 2026 is the remarkable recovery of platinum group metals and gold, both of which reversed the underperformance that characterised their contributions in March 2025. In the prior year, these commodities were among the principal drags on sector-level production indices. Twelve months later, however, they have become the primary engines of growth.
PGM production expanded 10.5% year-on-year, contributing 2.6 percentage points to the overall production index. On the revenue side, the movement was far more dramatic: PGM sales jumped 113.5% year-on-year, contributing 21.0 percentage points to total mineral sales growth. This extraordinary revenue acceleration reflects not just improved mine output, but a confluence of elevated global prices for platinum, palladium, and rhodium driven by tight supply conditions and sustained industrial demand.
Gold mirrored this trajectory, albeit at a somewhat lower magnitude. Production increased 17.1% year-on-year, the highest growth rate among all tracked commodities, contributing 1.6 percentage points to total output. Revenue from gold sales rose 51.7% year-on-year, contributing 8.2 percentage points to the sales index. Considering the current gold price forecast, gold prices have been trading at historically elevated levels through early 2026, amplifying the revenue effect well beyond what volume growth alone would generate.
| Commodity | Production Change (y/y) | Production Contribution | Sales Change (y/y) | Sales Contribution |
|---|---|---|---|---|
| PGMs | +10.5% | +2.6 pp | +113.5% | +21.0 pp |
| Gold | +17.1% | +1.6 pp | +51.7% | +8.2 pp |
| Manganese ore | +14.4% | +1.1 pp | — | — |
| Chromium ore | — | — | +38.6% | +2.9 pp |
| Coal | -9.6% | -2.5 pp | — | — |
| Iron ore | — | — | -18.7% | -2.5 pp |
| Total sector | +2.5% | — | +30.2% | — |
Source: Statistics South Africa (Stats SA), Mining Production and Sales release, March 2026
Manganese ore also deserves recognition as a quiet achiever, with production rising 14.4% year-on-year and contributing 1.1 percentage points to overall output growth. Chromium ore added 2.9 percentage points to mineral sales growth on a 38.6% year-on-year revenue increase, placing it third among positive sales contributors.
The PGM Price Premium: Why Revenue Growth Wildly Exceeds Volume Growth
To understand why PGM sales revenues can rise by 113.5% while production only grows by 10.5%, it is important to appreciate how spot-price sensitivity works in this commodity class. Platinum group metals, particularly rhodium and palladium, are characterised by extremely inelastic supply in the short term due to the capital intensity and geological complexity of South African mining operations.
South Africa holds an estimated 70% to 80% of global platinum reserves and produces a significant share of the world's palladium and rhodium. This geological concentration means global price cycles have an outsized revenue impact on South African producers even when volume changes are modest. A modest production rebound, when combined with a meaningful price uplift, can generate revenue multiples that appear disproportionate to the underlying operational improvement.
"When prices for a commodity you dominate globally move upward, even fractional volume gains translate into revenue surges. The mathematics of price leverage in high-concentration commodity markets are what make South Africa's PGM sales numbers appear extraordinary against otherwise measured production growth."
This dynamic also has implications for how investors should interpret earnings projections from South African PGM producers. Furthermore, gold as a strategic investment continues to attract institutional interest, meaning revenue figures that look exceptional in a high-price environment can contract sharply if precious metal prices normalise, regardless of whether production volumes hold steady.
Coal and Iron Ore: The Structural Drag That Won't Resolve Quickly
While PGMs and gold commanded attention with their outperformance, the simultaneous deterioration in coal and iron ore production reveals a less comfortable story about the structural health of South Africa's bulk commodity sector.
Coal production contracted 9.6% year-on-year in March 2026, making it the single largest negative contributor, subtracting 2.5 percentage points from the total production index. On a quarterly basis, coal output fell a further 3.4% in Q1 2026 relative to Q4 2025, contributing an additional 0.8 percentage points to the quarterly production drag.
The persistent coal production decline is not a demand-side anomaly in isolation. It reflects deep operational constraints linked to Transnet rail network limitations, which have severely hampered the movement of bulk commodities from inland collieries to the Richards Bay Coal Terminal. When export logistics fail to function at adequate capacity, producers face a compounding problem: not only do they lose revenue, but they frequently reduce output to avoid stockpile accumulation that creates operational and storage hazards at mine sites.
Iron ore tells a parallel story on the sales side. Revenue from iron ore sales fell 18.7% year-on-year in March, subtracting 2.5 percentage points from the total mineral sales index. On a quarterly production basis, iron ore output declined 6.6% in Q1 2026 versus Q4 2025, the largest single quarterly production drag across all commodities tracked. Understanding the iron ore demand prospects on a global scale helps contextualise why South African producers are facing such headwinds.
The iron ore weakness reflects a combination of factors:
- Softer global steel demand, particularly from China, which remains the dominant swing consumer of seaborne iron ore
- Ongoing port and rail logistics bottlenecks affecting export throughput from Saldanha Bay
- A higher comparison base from Q4 2025, when iron ore had briefly benefited from logistical improvements
Consequently, the China steel and iron ore market dynamic continues to exert significant downward pressure on South African export revenues from bulk commodities.
"The simultaneous production and revenue underperformance in coal and iron ore is a structural warning signal. South Africa's two highest-volume bulk commodity exports are both contracting, leaving PGMs and gold to carry disproportionate sector-level weight. This commodity concentration risk has material implications for long-term sector resilience."
Seasonally Adjusted Data: Reading Beneath the Year-on-Year Headlines
Month-on-month seasonally adjusted figures introduce significant caution around the year-on-year improvements. Mining production declined 5.1% on a seasonally adjusted month-on-month basis in March 2026, following consecutive gains of 3.0% in February and 3.5% in January. The mineral sales equivalent was even more pronounced, with a -8.6% month-on-month decline in March after a +9.0% gain in February.
| Indicator | January 2026 (m/m) | February 2026 (m/m) | March 2026 (m/m) |
|---|---|---|---|
| Seasonally adjusted mining production | +3.5% | +3.0% | -5.1% |
| Seasonally adjusted mineral sales | -8.4% | +9.0% | -8.6% |
These swings illustrate two important phenomena. First, intra-quarter volatility in both output and revenue remains high, suggesting the sector has not yet achieved operational stability sufficient to sustain a durable trend. Second, the strong year-on-year comparison for March 2026 is amplified by a depressed base from March 2025, when mining production had fallen 2.8% year-on-year and PGMs and gold were among the top negative contributors.
Base-effect amplification is a well-understood statistical phenomenon, but it is frequently underweighted in market commentary. Investors and sector analysts should apply appropriate discounting when interpreting the March 2026 headline figures, recognising that comparable year-on-year data in coming months may look considerably less impressive once the low-base tailwind diminishes.
Quarterly View: What Q1 2026 Tells Us About Recovery Durability
On a seasonally adjusted quarterly basis, mining production rose 0.6% in Q1 2026 compared to Q4 2025, while mineral sales increased 6.6% over the same period. The positive quarterly production reading has meaningful macroeconomic implications: a mining sector contribution to GDP growth, however modest, is a meaningful signal in the context of South Africa's broader economic challenges.
However, a 0.6% quarterly production gain is more indicative of a fragile stabilisation than a robust expansion cycle. The drivers of this quarterly improvement were again PGMs and gold, while iron ore and coal continued to subtract from aggregate output. The structural divergence between precious metals and bulk commodities at the quarterly level is consistent with and reinforces the March monthly picture.
The next major ASX story will hit our subscribers first
Energy Stability and Infrastructure: The Two Variables That Will Define the Outlook
Is energy availability finally improving for miners?
Two factors have arguably done more to shape Q1 2026 mining performance than any commodity price movement: energy availability and logistics infrastructure.
Reduced load-shedding frequency through late 2025 and into early 2026 provided a more stable operating environment for energy-intensive mining operations. Deep-level gold and PGM mining in particular require continuous, high-volume power supply for ventilation, pumping, hoisting, and processing operations. Even intermittent power disruptions carry disproportionate costs in these environments, not merely through lost production hours but through equipment stress, safety incidents, and extended restart procedures.
The improvement in grid stability has enabled operations that were previously running below optimal capacity to restore closer to nameplate throughput levels. This is likely a meaningful contributor to the gold and PGM production recovery observed in Q1 2026, beyond any market-driven investment decisions.
Will logistics constraints continue to cap bulk commodity recovery?
On the logistics side, the Transnet situation remains unresolved as a structural constraint. The rail network's inability to reliably transport bulk commodities continues to cap the upside potential for coal and iron ore, and prevents the sector from realising a more balanced multi-commodity recovery. Until rail throughput capacity is materially restored, the headline sector figures will remain disproportionately dependent on precious metals performance.
What This Means for Investors and Market Watchers
Several key takeaways emerge from a rigorous reading of South Africa mining production and mineral sales in March 2026:
-
Price-driven revenue inflation is not the same as operational recovery. The 30.2% mineral sales growth figure should be understood as primarily a function of commodity price cycles, not a signal that the sector has resolved its structural challenges.
-
PGM and gold concentration creates sector-level vulnerability. The degree to which sector-wide metrics depend on two commodity groups exposes aggregate indices to sharp reversals if platinum group metal or gold prices correct from current elevated levels.
-
Coal and iron ore weakness reflects infrastructure constraints as much as demand dynamics. Resolution of Transnet logistics limitations would materially improve the sector's volume trajectory and reduce commodity concentration risk.
-
The low base from March 2025 amplifies apparent year-on-year strength. Comparable-period data in subsequent months will likely show more moderate year-on-year performance as the base normalises.
-
Energy grid stability is an underappreciated enabling factor. Sustained improvements in load-shedding frequency have quietly supported the production recovery in energy-intensive mining operations.
Disclaimer: This article is intended for informational purposes only and does not constitute financial or investment advice. Forecasts, projections, and analytical commentary involve inherent uncertainty and should not be relied upon as predictions of future performance. Readers should conduct independent research and consult qualified financial advisors before making investment decisions.
For ongoing coverage of South Africa's mining production and mineral sales data and related sector developments, Mining Weekly provides regular reporting on Stats SA statistical releases and broader industry trends.
Want To Be First When The Next Major ASX Mineral Discovery Hits The Market?
Discovery Alert's proprietary Discovery IQ model scans ASX announcements in real time, instantly identifying significant mineral discoveries across gold, PGMs, and over 30 other commodities — turning complex data into clear, actionable investment opportunities. Explore historic discoveries and the exceptional returns they generated, then start your 14-day free trial at Discovery Alert to position yourself ahead of the broader market.