June 16, 2026
The Hidden Architecture of South Africa's Mineral Economy
Commodity supercycles have a habit of revealing economic truths that years of stable pricing tend to obscure. When prices rise sharply across multiple metals simultaneously, the fiscal architecture underpinning resource-dependent economies becomes visible in ways that quarterly GDP reports rarely capture. South African mining production and sales are back in the spotlight in 2026, and the implications extend far beyond a single month's production data.
The country's mining sector occupies a structural position in the national economy that most international investors systematically underestimate. Mining's contribution is not simply a direct GDP percentage. It operates through at least four simultaneous transmission channels: direct value-added output, corporate income tax receipts flowing to the National Treasury, foreign exchange earnings that support rand stability, and formal employment sustaining roughly half a million direct jobs. When all four channels strengthen at once, as they are doing in 2026, the macro effect compounds in ways that headline production figures alone cannot convey.
South Africa controls an exceptional share of global platinum group metal (PGM) reserves, accounting for approximately 70 to 75 percent of annual platinum mine supply worldwide. It also holds dominant positions in manganese, chromium, and vanadium. This diversified critical minerals demand basket is structurally different from the single-commodity dependency that characterises most African mining jurisdictions, and it creates a resilience profile that becomes particularly valuable during periods of commodity price divergence.
When big ASX news breaks, our subscribers know first
Why 2025's Contraction Was Deeper Than the Headline Numbers Suggested
Understanding the scale of the 2026 recovery requires an honest accounting of how severe the 2025 deterioration actually was. South Africa mining decline recorded four consecutive year-on-year quarterly declines during 2025, with the full-year growth figure of just 0.1% masking the depth of weakness concentrated in the middle months.
The Q1 2025 disruption was primarily weather-driven. Exceptionally heavy rainfall across major mining regions simultaneously impacted multiple commodity streams, a convergence that exposed the sector's vulnerability to climate-related operational risk. The knock-on effects were significant:
- PGMs output collapsed 24.1% year-on-year in April 2025 alone
- Coal production fell 1.7% during the same period
- Gold output contracted 2.5% year-on-year in April 2025
- These three commodities collectively represent more than 60% of South Africa's total mining production basket
The 2025 contraction was not a structural failure of South Africa's mining industry. It was a convergence of cyclical weather shocks, persistent infrastructure constraints, and commodity price softness that created an unusually deep statistical base from which 2026 figures would inevitably rebound.
This distinction matters enormously for investors. A sector that contracts due to temporary operational disruptions recovers differently than one experiencing geological depletion or sustained demand destruction. South Africa's 2025 weakness was overwhelmingly the former, which is precisely why the 2026 numbers have rebounded with such velocity.
Decoding the April 2026 Production and Sales Numbers
What the 8.2% Headline Figure Actually Contains
Statistics South Africa's April 2026 data confirmed that mining production expanded 8.2% year-on-year, following a 2.5% increase recorded in March 2026. To interpret this correctly, analysts need to decompose two distinct forces operating simultaneously: genuine operational volume improvement, and the statistical base effect created by April 2025's 7.7% year-on-year contraction.
Both forces are real, and both are contributing to the headline. The base effect is mathematically substantial, but dismissing the entire result as a statistical artefact would be an analytical error. The commodity-level breakdown reveals genuine volume recovery across several key streams.
Commodity-Level Production: Who Led, Who Lagged?
| Commodity | Year-on-Year Change (April 2026) | Contribution to Overall Growth |
|---|---|---|
| PGMs | +36.5% | +8.8 percentage points |
| Manganese Ore | +19.0% | +1.3 percentage points |
| Chromium Ore | +17.5% | +1.1 percentage points |
| Coal | -5.8% | -1.5 percentage points |
PGMs, manganese, and chromium collectively accounted for 44.8% of the total mining production basket, meaning their simultaneous recovery created a disproportionate upward impact on the aggregate figure. The PGMs contribution of 8.8 percentage points effectively generated more than the entire headline number by itself, with coal's -1.5 percentage point drag partially offsetting gains elsewhere.
Coal's persistent underperformance deserves separate analysis. The 5.8% output decline reflects structural headwinds that are fundamentally different in nature from the weather-driven disruptions that affected PGMs and gold in 2025. ESG-driven capital withdrawal from coal financing, declining export market competitiveness, and long-run energy transition pressures are compressing investment flows into South African coal operations. Near-term Eskom baseload electricity demand provides some floor to domestic coal volumes, but it cannot offset the structural trajectory.
The Mineral Sales Story: R332 Billion in Four Months
The Scale of the Year-to-Date Recovery
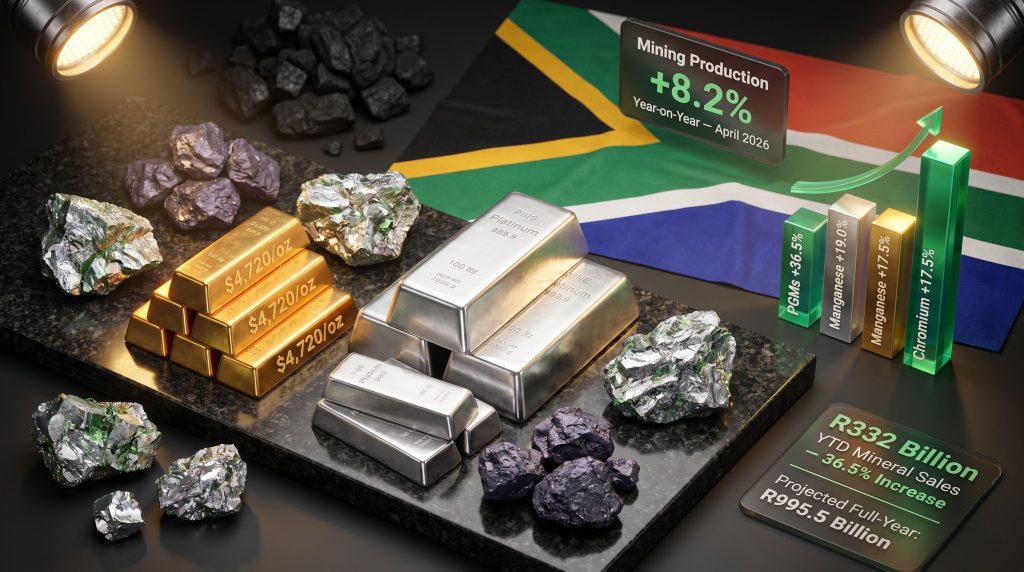
January through April 2026 mineral sales reached R332 billion, representing a 36.5% increase compared to the equivalent four-month period in 2025. In absolute rand terms, total sales rose by R89 billion year-to-date relative to the prior year. The Minerals Council South Africa has projected that if the current sales trajectory is maintained through the remainder of the year, full-year 2026 mineral sales could reach R995.5 billion.
For context, mineral sales in 2025 were already 7.3% higher than in 2024, and December 2025 alone recorded a 48.1% year-on-year surge in sales at current prices, driven at that point by iron ore and manganese rather than the PGMs complex that is now leading the 2026 recovery. This shift in commodity leadership between reporting periods illustrates the dynamic, internally diverse nature of South Africa's production basket.
Commodity-Level Sales Performance
| Commodity | YTD Sales Change (Jan-Apr 2026) | YTD Sales Value |
|---|---|---|
| PGMs | +120.3% | R27.9 billion |
| Gold | +12.2% | R19.5 billion |
| Chromium Ore | +34.8% | R7.3 billion |
| Coal | +8.1% | R16.1 billion |
PGMs' extraordinary 120.3% sales increase is the standout figure in this dataset. It reflects both volume recovery from the 2025 weather-related lows and dramatic commodity price appreciation across the entire platinum group metals complex. Gold's 12.2% sales growth to R19.5 billion is underpinned by a historic price environment, with the broader gold price outlook continuing to support producer margins. Furthermore, chromium ore's 34.8% gain aligns with both its production recovery and favourable price movement.
The Commodity Price Environment Driving the Outperformance
| Commodity | April 2026 Price | Year-on-Year Price Change |
|---|---|---|
| Gold | $4,720/oz | +46.5% |
| Platinum | $2,017/oz | +110.5% |
| Palladium | $1,516/oz | +60.7% |
| Rhodium | $10,063/oz | +85.4% |
| Coal | $105.9/tonne | +18.7% |
| Iron Ore | $109.4/tonne | +8.4% |
Platinum's 110.5% price surge to $2,017 per ounce is arguably the single most consequential development for South African mining revenues. Given the country's commanding share of global platinum supply, price appreciation of this magnitude has a revenue multiplier effect that is difficult to replicate in any other commodity. The entire PGMs complex, encompassing platinum, palladium at $1,516 per ounce (+60.7%), and rhodium at $10,063 per ounce (+85.4%), has experienced synchronised appreciation, creating a rare simultaneous tailwind across the full basket.
Gold at $4,720 per ounce represents a generational pricing environment. This level of gold pricing compresses cost-to-revenue ratios for South African gold producers even as rand-denominated operating costs continue rising, creating margin expansion that flows directly into corporate tax receipts.
South Africa's mineral sales for January through April 2026 totalled R332 billion, a 36.5% increase on the prior year, driven by record commodity prices across platinum (+110.5%), gold (+46.5%), and rhodium (+85.4%), alongside a production recovery led by a 36.5% surge in PGMs output.
Is This Recovery Structural or Cyclical? Three Analytical Frameworks
Framework 1: Stripping Out the Base Effect
The most disciplined approach to evaluating the April 2026 result involves examining it on a two-year stacked basis, which neutralises the distorting influence of April 2025's abnormally weak base. When production growth rates for March 2026 (+2.5%) and April 2026 (+8.2%) are viewed sequentially, they suggest building operational momentum rather than a one-time statistical bounce. However, a sustained sequence of positive months through the second half of 2026 would be required to confirm that underlying production volumes are genuinely trending higher independent of comparison effects.
Framework 2: Commodity Price Cycle Positioning
Platinum's price trajectory carries particular analytical complexity. Its demand profile is genuinely bifurcated in a way that creates unusual valuation uncertainty:
- Autocatalytic demand: platinum continues to serve in catalytic converters for petrol and hybrid vehicles, where it competes with palladium depending on relative pricing and engineering specifications
- Hydrogen economy demand: platinum is the primary catalyst material in proton exchange membrane fuel cells, and PEM technology positions it as a potential beneficiary of the long-run hydrogen economy build-out
- Investment demand: geopolitical risk premiums and monetary policy uncertainty have reinforced precious metals broadly
The synchronised appreciation across platinum, palladium, and rhodium suggests that supply concentration risk, rather than demand fundamentals alone, is contributing to current price levels. Consequently, PGM supply constraints mean that any operational disruption — whether weather-driven, labour-related, or infrastructure-constrained — carries outsized price implications for global markets.
Framework 3: South Africa's Structural Enablers and Constraints
Three structural factors will determine whether the 2026 recovery translates into a sustained multi-year expansion or remains a cyclical bounce:
- Transnet freight rail capacity: the inability to move ore from mine to port at sufficient throughput volumes has been a persistent bottleneck constraining export revenue realisation. Production gains that cannot be transported generate no revenue.
- Eskom electricity reliability: energy-intensive mining operations, particularly deep-level gold and PGM mines, are acutely exposed to electricity cost and reliability risk. Load-shedding episodes increase diesel generator costs and reduce hoisting and ventilation efficiency in ways that directly compress operating margins.
- Regulatory and licensing environment: the speed and predictability of mining rights renewals and environmental authorisation processes influence long-run capital allocation decisions by both domestic and international mining companies.
Fiscal Implications: What R995.5 Billion Means for the National Treasury
The Minerals Council South Africa's chief economist has emphasised that the projected increase in mining-related corporate income tax contributions demonstrates the sector's relevance not just as a revenue source but as a catalyst for sustainable economic growth. The argument is straightforward: elevated mineral sales at current commodity prices translate mechanically into higher taxable corporate income, which flows to the National Treasury through the corporate tax mechanism.
The Minerals Council's position is that policymakers should respond to this demonstrated fiscal contribution by creating enabling conditions that attract sustained capital into the mining value chain. This includes infrastructure investment, regulatory streamlining, and energy policy alignment — none of which involves public subsidy to individual projects but rather the systemic environment within which private mining investment decisions are made.
The R995.5 Billion Scenario Analysis
| Scenario | Key Assumption | Projected Full-Year Mineral Sales |
|---|---|---|
| Base Case | Current trajectory maintained | R995.5 billion |
| Upside Case | Commodity prices hold or extend gains | Exceeds R1 trillion |
| Downside Case | Price correction or production disruption | R850–900 billion range |
A breach of the R1 trillion threshold would represent a symbolic and practical milestone for South African mining, signalling to international capital markets that the sector has structurally re-rated. The fiscal headroom created by elevated mining tax revenues also provides the National Treasury with greater capacity to manage South Africa's broader public finance challenges without additional debt issuance.
The next major ASX story will hit our subscribers first
South Africa's Position Within the Global PGMs Supply Picture
One dimension of the 2026 recovery that receives insufficient analytical attention is what it means for global supply chains beyond South Africa's borders. Automotive manufacturers, particularly those producing petrol, hybrid, and hydrogen fuel cell vehicles, source platinum group metals from a remarkably concentrated geographic base. South African mining production and sales are back at levels that directly ease supply chain pressures which had been building throughout 2025.
The emerging hydrogen economy adds a speculative but increasingly credible long-run demand dimension. If green hydrogen production scales as projected under various net-zero pathway models, demand for platinum as a PEM electrolyser catalyst could create an entirely new demand pool that did not exist in historical platinum price models. This represents a structural demand uplift that is not yet priced into consensus long-run platinum forecasts, creating potential asymmetric upside for producers with reserve longevity.
Compared with peer African mining jurisdictions, South Africa's diversified commodity basket provides a resilience advantage that single-commodity producers in the Democratic Republic of Congo (copper and cobalt), Guinea (bauxite), or Zambia (copper) simply cannot replicate. When one commodity underperforms, as coal is doing in 2026, other streams absorb the impact. According to the Minerals Council monthly economic reports, this internal diversification makes South Africa's aggregate production and sales trajectory materially more stable across commodity cycles.
Frequently Asked Questions
What drove the 8.2% mining production increase in April 2026?
The April 2026 expansion was primarily driven by a 36.5% surge in PGMs output, which contributed 8.8 percentage points to the headline figure, alongside strong gains in manganese ore (+19.0%) and chromium ore (+17.5%). The result also reflects recovery from an unusually weak April 2025 base, when production contracted 7.7% year-on-year due to heavy rainfall disruptions across key production areas.
How significant is the R332 billion in year-to-date mineral sales?
The January through April 2026 figure of R332 billion represents a 36.5% uplift on the equivalent 2025 period, driven by both volume recovery and exceptional commodity price appreciation, particularly across PGMs and gold. The Minerals Council projects full-year 2026 sales could reach R995.5 billion if the trajectory holds.
Why did coal production decline despite the broader recovery?
Coal output fell 5.8% year-on-year in April 2026, subtracting 1.5 percentage points from aggregate growth. This reflects structural headwinds including global energy transition pressures and ESG-driven capital withdrawal from coal financing, partially offset by Eskom's near-term baseload electricity demand.
Is South African mining production and sales are back on a sustainable trajectory beyond 2026?
Sustainability depends on three converging factors: whether platinum at $2,017 per ounce and gold at $4,720 per ounce represent structurally supported levels or a cyclical peak; whether Transnet rail capacity constraints are resolved to enable higher export throughput; and whether the regulatory environment evolves to attract sustained capital into the mining value chain over a multi-year horizon.
Key Takeaways at a Glance
- Mining production expanded 8.2% year-on-year in April 2026, following a 2.5% gain in March 2026
- PGMs led the recovery with a 36.5% production increase, contributing 8.8 percentage points to headline growth
- Year-to-date mineral sales of R332 billion represent a 36.5% uplift on the prior year period
- Platinum surged 110.5% to $2,017 per ounce, gold rose 46.5% to $4,720 per ounce, and rhodium appreciated 85.4% to $10,063 per ounce
- Full-year 2026 mineral sales are projected to reach R995.5 billion if the current trajectory holds
- Coal remains the primary structural drag, declining 5.8% in April despite near-term Eskom demand support
- The recovery carries significant fiscal implications, with elevated mining corporate tax contributions expected to benefit South Africa's National Treasury
Disclaimer: This article contains forward-looking projections and commodity price data sourced from publicly available reports, including Statistics South Africa and the Minerals Council South Africa. Projections such as the R995.5 billion full-year mineral sales estimate are conditional on current market conditions being maintained and should not be interpreted as guaranteed outcomes. Commodity prices are inherently volatile. This article does not constitute financial or investment advice.
Want to Capitalise on the Next Major Mineral Discovery Before the Market Does?
Discovery Alert's proprietary Discovery IQ model delivers real-time alerts on significant ASX mineral discoveries — transforming complex commodity data into actionable insights for both short-term traders and long-term investors. Explore historic discoveries and the exceptional returns they generated, then begin your 14-day free trial at Discovery Alert to position yourself ahead of the market.