
June 6, 2026
When Valuations Disconnect From Reality: A Multi-Framework Risk Analysis of the S&P 500
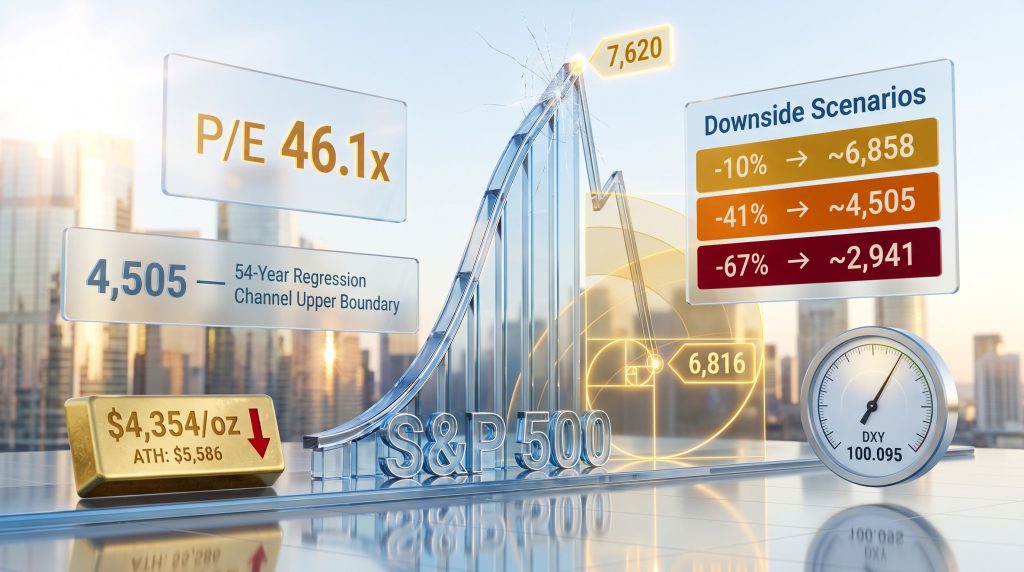
Throughout financial history, the most damaging market corrections have rarely announced themselves with clarity. They tend to arrive after extended periods where optimism becomes self-reinforcing, where rising prices justify rising prices, and where the structural vulnerabilities quietly accumulating beneath the surface go largely unexamined. The current positioning of the S&P 500 fits this pattern with uncomfortable precision. With a trailing price-to-earnings ratio sitting near 46.1x, technical momentum signals breaking down after an extraordinary run of overbought conditions, and macro data sending genuinely mixed signals, the question of whether the S&P 500 is poised to crack is no longer theoretical — it is the central investment debate of mid-2026.
When big ASX news breaks, our subscribers know first
The Valuation Problem: What a 46x P/E Ratio Actually Means
Price-to-earnings ratios are among the most misunderstood metrics in mainstream investment discourse. In practical terms, a P/E ratio represents how much investors are willing to pay today for each dollar of corporate earnings. At a ratio of 46.1x, investors are paying nearly 46 dollars for every single dollar of trailing twelve-month earnings — a level that sits far outside any historically sustainable range.
During conventional bull market cycles, P/E ratios between 11x and 15x were considered reasonable benchmarks for equity valuation. The distance between 46x and that historical range is not a minor discrepancy — it represents a structural overvaluation that, if mean-reverted fully, would imply a drawdown of approximately -67% from current levels.
To contextualise that figure, consider the two most severe corrections of this century:
| Market Event | Peak-to-Trough Decline | Approximate Duration |
|---|---|---|
| Dot-Com Bust (2000–2002) | -50.5% | ~2.5 years |
| Global Financial Crisis (2008–2009) | -57.7% | ~1.5 years |
| COVID Flash Crash (2020) | -35% | ~4 weeks |
| Regression Channel Return (Scenario) | -41% | Unknown |
| Full Mean Reversion (Scenario) | -67% | Unknown |
An additional and often overlooked reference point is the S&P 500's 54-year regression channel, whose upper boundary currently sits near 4,505. A reversion from the June 2026 record high of approximately 7,620 to that boundary alone would constitute a drawdown of roughly -41% — well short of full valuation normalisation, yet still representing a correction of generational magnitude for most investors currently positioned in the market.
It is also worth noting that the COVID-related market disruption significantly inflated the S&P's trajectory. Absent that shock and the extraordinary stimulus response it triggered, independent technical analysis suggests the index could notionally be trading near 2,941 today — implying that the stimulus-driven multiple expansion of the past several years has effectively borrowed returns from the future.
One critical and underappreciated dynamic is that a large cohort of institutional market participants, particularly those who entered the industry after 2010, have never professionally managed through a bear market of -50% or greater. This creates a generational blind spot in risk management frameworks across much of the industry.
Furthermore, Forbes analysis suggests the S&P 500 could face a 40% crash, a scenario that aligns closely with the regression channel reversion target discussed above — reinforcing that the S&P 500 is poised to crack under the weight of its own excess.
Technical Indicators: When Momentum Stops Confirming the Trend
The 41-Session Overbought Anomaly
One of the most telling technical data points currently embedded in the S&P 500's structure is the persistence of overbought conditions. Through early June 2026, the index recorded 41 consecutive sessions classified as technically overbought — an event that has occurred only 13 times across the past 46 years. The rarity of this signal is significant not because overbought conditions guarantee reversals, but because they quantify the degree of speculative extension built into current price levels.
The index's largest single-session decline of 2026 reached -2.6% — and even this occurred within that same overbought streak, suggesting that selling pressure is intensifying even as the broader technical structure has yet to fully break.
The Linear Regression Consistency Indicator: A Leading Signal
A less widely discussed but technically powerful indicator is what practitioners refer to as the linear regression trend consistency measure — sometimes called the "Baby Blues" in reference to its visual presentation on charts. This tool tracks the day-to-day consistency of a short-term linear regression trend and provides early warning signals before price action confirms a directional shift.
When this consistency reading drops below the +80% axis, it has historically been associated with the beginning of a broader downtrend phase. A confirmed break below this threshold in the S&P 500's futures complex points to:
- An initial downside target in the mid-7,400s
- Structural support near 7,300
- A secondary target near 7,279 based on pricing architecture
- A Fibonacci retracement zone near 6,816 on a more extended pullback
Fibonacci Architecture and Downside Target Mapping
The Fibonacci retracement framework provides a mathematically derived set of support levels based on prior price swings. Using the move from the record high of approximately 7,620 to the March 30, 2026 low of 6,317, the Golden Ratio (61.8%) retracement falls near 6,816 — a level that aligns closely with the conservative pullback target of approximately 6,858, creating a technically coherent support zone.
| Scenario | Price Level | % Decline From Record High (~7,620) |
|---|---|---|
| Conservative pullback | ~6,858 | -10% |
| Golden Ratio Fibonacci retracement | ~6,816 | -10.5% |
| Regression channel upper boundary | ~4,505 | -41% |
| Full historical mean reversion | ~2,941 | -61% |
The 7,300 level carries additional weight from a volume and pricing structure perspective, representing a zone where prior price activity has created meaningful transactional density — a feature that often acts as a gravitational support or resistance depending on the directional approach.
Macro Headwinds Compounding Technical Vulnerability
A Barometer Sending Mixed Signals
The macroeconomic backdrop heading into mid-2026 is genuinely bifurcated, which itself creates uncertainty. The most recent data cycle showed improvements across several indicators:
Improving indicators:
- Factory Orders
- ISM Manufacturing Index
- ISM Services Index
- Construction Spending
- Employment figures
Deteriorating indicators:
- Consumer Credit growth slowing
- Productivity declining
- Unit Labour Costs rising
- Initial Jobless Claims increasing
This divergence matters because equity markets cannot sustain elevated valuations on selective data. Rising unit labour costs combined with slowing productivity is an inflationary cocktail that places the Federal Reserve in an increasingly difficult position — particularly when financial conditions remain relatively loose despite prior tightening cycles. In addition, high-yield credit spreads widening across investment-grade markets would act as a powerful confirming signal that broader credit stress is beginning to materialise.
The Federal Reserve's Rate Decision Problem
Market consensus as of June 2026 points toward the Fed holding rates at its June 17 policy meeting. However, the combination of persistent inflation, rising labour costs, and a climbing U.S. Dollar Index — which reached 100.095, its highest level since early April 2026 — suggests that pressure for a rate increase at the July 29 meeting is building.
Fidelity's midyear outlook highlights that if oil prices remain elevated, inflation re-accelerates, or interest rates move higher, the structural foundations of the current bull market face significantly increased fragility. This is not a tail risk warning — it describes conditions that are actively present in the current data environment.
The inflation-valuation squeeze represents a particularly dangerous combination. When inflation is rising and interest rates follow, the discount rate applied to future corporate earnings increases, mechanically compressing P/E multiples. At a starting point of 46x, even a modest compression toward 35x–38x would represent a meaningful nominal drawdown in index levels. Understanding gold bonds dynamics during these inflationary episodes provides additional context for how asset classes interact when monetary policy tightens.
Is This a Decision Point or a Confirmed Breakdown?
The Bullish Continuation Case
It would be intellectually dishonest to present the current setup as a one-sided bearish thesis. There are legitimate arguments for continued resilience:
- The index remains in a technically viable bullish reversal setup if it clears nearby resistance highs
- Fidelity's midyear analysis maintains that the broader uptrend is largely intact absent a major macro shock
- Positive ISM readings and stable employment data confirm the U.S. economy has not entered contraction
- Morgan Stanley projects a 5%–10% gain over the medium term, acknowledging constraints but not forecasting collapse
The Structural Correction Case
The counterargument carries considerably more weight when viewed through the lens of long-cycle valuation history:
- A trailing P/E of 46.1x is among the most extreme readings in the modern era of equity markets
- Forty-one consecutive overbought sessions at this valuation level is a historically rare alignment of technical and fundamental excess
- The generation of institutional participants who have never experienced a -50% bear market may systematically underestimate tail risk
- Rising deficits, sticky inflation, and a strong dollar create a compounding headwind for both earnings and multiples simultaneously
Confirmation Signals to Monitor
A genuine market break would likely be confirmed by several observable triggers:
- A sustained close below the 7,300 structural support level
- ISM Services deteriorating below the 50-point expansion threshold
- The Federal Reserve pivoting toward rate increases rather than maintaining a hold
- Meaningful widening in credit spreads across investment-grade and high-yield markets
Gold's Divergence: When the Safe-Haven Narrative Breaks Down
Gold's Corrective Phase in Context
Conventionally, gold as a safe haven is expected to outperform during periods of equity stress, functioning as a portfolio stabiliser when risk assets decline. The current environment complicates this narrative considerably. Gold settled near $4,354/oz in early June 2026, representing a decline of approximately -22.1% below its all-time high of $5,586 set on January 29, 2026. Year-to-date performance stands at only +0.5% — a figure that sits in stark contrast to the perception of a strong gold cycle.
The metal has recorded five down weeks in the last seven, with a parabolic short trend having been active since late March 2026. This technical deterioration has unfolded even as equity markets themselves have shown signs of vulnerability, creating an unusual dual-pressure environment for investors seeking diversification.
Key Gold Price Levels
| Price Level | Significance |
|---|---|
| $4,553 | Upper volume-dominant resistance zone |
| $4,473 | Lower resistance threshold |
| $4,354 | Current settlement price (early June 2026) |
| $4,284–$4,584 | Active support zone |
| $4,051 | 300-day moving average |
| $3,946 | Estimated fair value |
Gold's current pricing presents an interesting internal contradiction. The metal trades approximately +10.3% above its estimated fair value of $3,946, yet simultaneously sits -6.2% below its BEGOS Market Value of $4,640. The BEGOS framework — which evaluates the Bond, Euro, Gold, Oil, and S&P 500 complex as an integrated multi-asset system — suggests gold's relationship with its broader market context points toward either a recovery toward $4,640 or a deeper corrective move toward $3,946.
Furthermore, central bank gold demand continues to represent a structural floor beneath the market, even as shorter-term technical pressures weigh on price action.
The BEGOS valuation framework is a specialised analytical lens not widely used in mainstream commentary. When an asset diverges significantly from its BEGOS Market Value, historical patterns suggest a mean-reversion move becomes increasingly probable, though the direction and timing remain uncertain.
Silver as a Confirming Signal
Silver's technical structure reinforces the broader precious metals downtrend. The metal faces layered resistance extending from approximately $68.00 all the way up to $75.95, with its own short-term trend consistency indicators in full deterioration. Consequently, the gold-silver ratio analysis becomes particularly instructive here — when silver's momentum breaks down alongside gold's, it typically signals that the corrective phase has broader structural validity rather than representing isolated price noise.
The next major ASX story will hit our subscribers first
Three Scenarios Every Investor Should Stress-Test
Given the confluence of technical breakdown signals, extreme valuation readings, and macroeconomic uncertainty, investors would be well served by stress-testing their portfolios against three distinct outcomes. For additional perspective on navigating these risks, Morningstar's guidance on preparing for the next market crash offers a practical framework for portfolio resilience across varying correction scenarios.
Scenario 1 — Controlled Pullback (-10%):
The index corrects to approximately 6,858, finds technical support near the Fibonacci retracement zone at 6,816, and resumes its longer-term uptrend. This represents the base case for near-term bulls and aligns with the Fed holding rates and economic data stabilising.
Scenario 2 — Structural Correction (-41%):
Valuation normalisation drives the index back toward the upper boundary of the 54-year regression channel near 4,505. This scenario requires sustained deterioration in earnings expectations and a Federal Reserve tightening cycle that compresses multiples over an extended period.
Scenario 3 — Generational Bear Market (-50% to -67%):
A full mean reversion of the P/E multiple from 46x toward the historical bull market range of 11x–15x produces a drawdown comparable to or exceeding the Dot-Com and Financial Crisis events. This remains a low-probability near-term scenario but represents the genuine tail risk embedded in current valuations.
| Scenario | Depth | Key Trigger Conditions | Implied S&P Level |
|---|---|---|---|
| Controlled Pullback | -10% | Technical reset, Fed holds | ~6,858 |
| Structural Correction | -41% | Rate hikes, earnings miss | ~4,505 |
| Generational Bear Market | -61% to -67% | Full P/E mean reversion | ~2,500–2,941 |
Frequently Asked Questions
What does it mean when analysts say the S&P 500 is poised to crack?
The phrase captures a technical and fundamental inflection point where sufficient downside pressure has accumulated from overvaluation, deteriorating momentum, or adverse macro conditions that a meaningful decline becomes statistically more probable. It does not forecast an imminent crash but identifies a high-risk zone where the cost of being wrong on the upside is significantly asymmetric relative to the cost of being wrong on the downside.
What P/E ratio level represents meaningful correction risk?
Historically, P/E ratios exceeding 25x–30x have been associated with elevated correction probability. At 46.1x trailing earnings, the current reading sits well above any range that historical cycles have sustained for extended periods without meaningful mean reversion.
How does Federal Reserve policy mechanically affect S&P 500 valuations?
Rate increases raise the discount rate applied to future corporate earnings, which mathematically reduces the present value of those earnings streams. Higher rates also increase corporate borrowing costs, compress profit margins, and slow consumer spending — all of which are negative for both earnings and the multiples the market assigns to those earnings.
Is gold a reliable hedge if equities correct sharply in 2026?
Historically yes, but the current technical structure complicates that thesis. Gold's own corrective phase means it may need to complete its own mean-reversion before resuming its traditional safe-haven role. Investors should not assume automatic negative correlation between gold and equities in the near term given current technical conditions.
Key Takeaways
- The S&P 500's trailing P/E of 46.1x sits at one of the most extreme valuation readings in modern market history, with a full mean reversion implying a potential drawdown of -67%
- Technical momentum indicators have deteriorated after 41 consecutive overbought sessions — a historically rare occurrence with a documented track record of preceding significant corrections
- Near-term downside targets range from 6,816–6,858 on a conservative pullback to 4,505 in a structural correction scenario
- The macro environment presents genuine bifurcation, with improving ISM and employment data offset by slowing credit growth, rising unit labour costs, and increasing jobless claims
- Gold's own corrective phase, sitting -22.1% below its 2026 all-time high with a BEGOS Market Value divergence, complicates the traditional safe-haven rotation thesis
- The weight of technical and fundamental evidence suggests the risk/reward balance has shifted meaningfully toward the downside — though confirmation of a genuine structural break requires monitoring specific price and macro triggers
This article is for informational and educational purposes only and does not constitute financial advice. All forecasts, scenarios, and price targets discussed represent analytical possibilities, not guaranteed outcomes. Investors should conduct their own due diligence and consult a licensed financial adviser before making any investment decisions. Past market behaviour is not a reliable indicator of future performance.
Want To Identify High-Potential ASX Discoveries Before The Broader Market Does?
While macro risks and valuation extremes dominate the headlines, Discovery Alert's proprietary Discovery IQ model scans ASX announcements in real time, delivering instant alerts on significant mineral discoveries that carry the potential for outsised returns — explore historic discovery outcomes to see what early positioning has meant for investors, and begin your 14-day free trial at Discovery Alert to secure a genuine market-leading edge.