June 6, 2026
Understanding Stagflation's Economic Mechanisms
Economic downturns typically follow predictable patterns. Recessions compress demand, inflation falls, and central banks respond with rate cuts that eventually restore growth. However, understanding what happens to gold and silver during stagflation reveals how this phenomenon breaks the cycle entirely, creating conditions where traditional policy tools become counterproductive.
The phenomenon emerges when supply-side disruptions combine with monetary policy mistakes, producing persistent inflation alongside economic stagnation. This creates what economists call the policy trilemma: central banks cannot simultaneously fight inflation and support growth when both unemployment and prices rise together.
What Creates the Stagflation Trap?
Stagflation requires two essential components working simultaneously. Supply shocks raise production costs across the economy without generating additional output. These can include energy embargoes, supply chain collapses, or broad import tariffs that push prices higher regardless of underlying demand conditions.
Policy mistakes occur when authorities respond inappropriately to these shocks. Furthermore, maintaining accommodative monetary policy during supply-driven inflation fails to stimulate growth while adding fuel to price pressures. The 1970s demonstrated this mechanism clearly: Federal Reserve officials kept rates too low for too long, allowing inflation to entrench rather than dissipate.
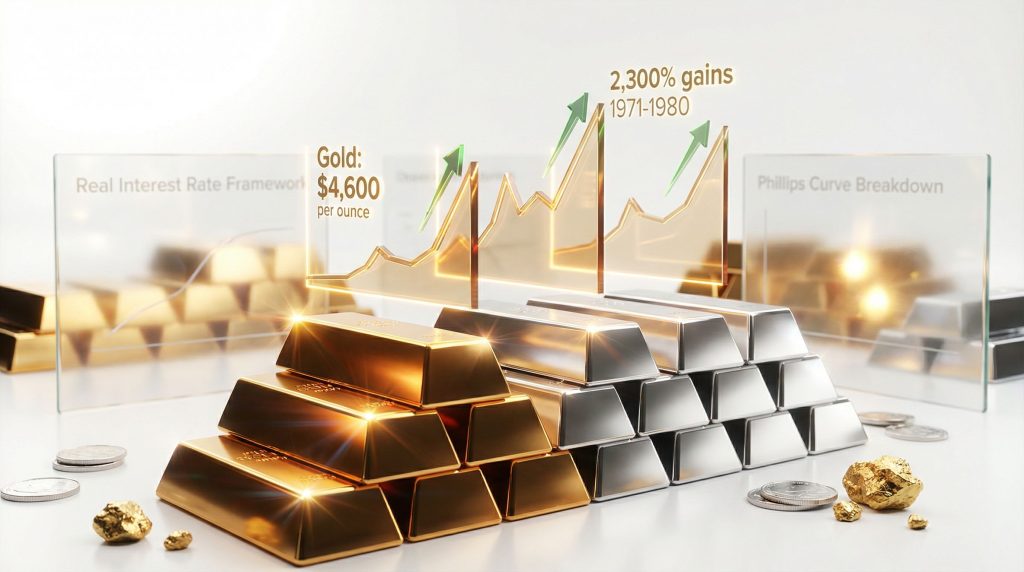
The Phillips Curve Breakdown
Traditional economic models assume an inverse relationship between unemployment and inflation, based on A.W. Phillips's 1958 research showing this historical pattern. When stagflation produces simultaneous increases in both metrics, policymakers lose their primary signaling mechanism for appropriate monetary response.
This breakdown forces central banks into impossible positions. Rate increases to combat inflation risk deepening economic slowdowns, while rate cuts to support growth risk accelerating inflation. Consequently, the result is policy paralysis that can extend stagflationary conditions for years.
When big ASX news breaks, our subscribers know first
Historical Precious Metals Performance During Economic Stress Periods
The 1970s Stagflation Case Study: Gold's Breakthrough Decade
The period from 1971 to 1980 provides comprehensive data on precious metals performance during sustained stagflation. President Nixon's decision to suspend dollar-gold convertibility on August 15, 1971, ended the Bretton Woods system and freed gold from its $35 per ounce fixed rate.
Performance Timeline:
- Starting Point: $35 per ounce (August 1971)
- Peak Price: $850 per ounce (January 21, 1980)
- Nominal Returns: Over 2,300% across nine years
- Major Correction: 40% decline from $193 to $113 (1974-1976)
Gold's ascent wasn't linear. The metal peaked near $193 in December 1974 before falling approximately 40% to $113 by August 1976. This correction tested investor conviction but ultimately represented price discovery in a newly liberalized market. Gold subsequently doubled again, demonstrating that underlying fundamentals remained intact.
Silver's Amplified Response Pattern
Silver delivered even more dramatic returns during the same period, rising from approximately $1.50 per ounce in 1970 to $49.45 per ounce at the London Fix on January 18, 1980. This represented a nominal gain exceeding 3,000%, surpassing gold's performance in percentage terms.
Key Silver Dynamics:
- Dual Nature: Both monetary metal and industrial commodity
- Market Size: Smaller market creating amplified volatility
- Correlation: Moved in concert with gold, platinum, and palladium
- Peak Timing: All precious metals hit record highs within months
The common narrative attributing silver's rise to the Hunt Brothers requires correction. Research indicates their accumulation contributed approximately $0.50 to $0.75 of the total price move, not the full $49+ per ounce gain. For instance, the synchronized movement across four separate precious metals markets validates macroeconomic rather than manipulation-driven causes.
Why Do Precious Metals Outperform During Stagflation?
The Real Interest Rate Framework
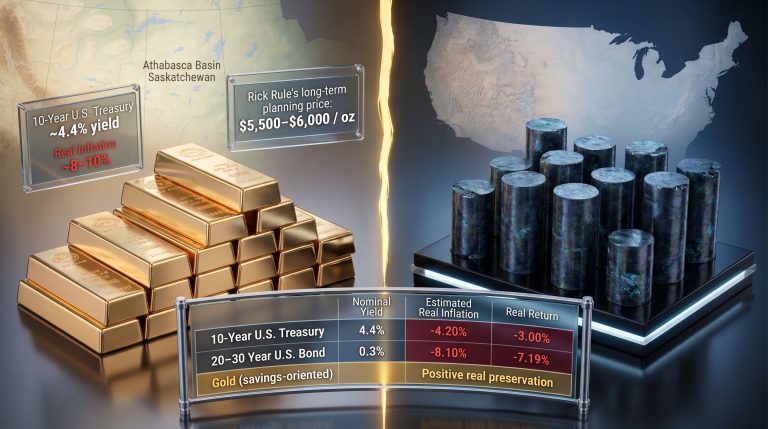
Real interest rates, calculated as nominal yields minus inflation, provide the fundamental driver of precious metals performance during stagflation. When inflation exceeds bond yields, real rates turn negative, eliminating the opportunity cost of holding non-yielding assets.
1980 Real Rate Example:
- Inflation: ~14%
- 10-Year Treasury Yield: ~10-11%
- Real Rate: -3% to -4%
- Result: Guaranteed purchasing power loss on financial assets
In this environment, investors holding $1 million in Treasuries would lose $30,000-$40,000 annually in real terms despite receiving nominal interest payments. However, gold and silver, despite paying no yield, offered protection against this systematic wealth erosion.
Portfolio Diversification Benefits
Stagflation breaks traditional asset correlations, creating conditions where stocks and bonds decline simultaneously. Equities face margin compression from rising input costs and valuation compression from growth uncertainty. Meanwhile, bonds suffer duration risk and purchasing power erosion.
The S&P 500 delivered near-zero real returns throughout the 1970s decade, while Treasury bonds provided negative real returns and faced capital losses when Paul Volcker eventually raised rates to combat inflation. This explains what happens to gold and silver during stagflation – they become essential portfolio diversifiers.
Current Market Validation:
The World Gold Council's research specifically identified stagflation concerns as driving increased ETF and retail demand for gold. Central banks averaged approximately 27 tonnes of monthly purchases throughout 2025, representing institutional recognition of gold's protective qualities in negative real rate environments.
Comparative Asset Class Performance Analysis
Equity Market Challenges in Stagflation
Stock markets face dual pressures during stagflationary periods. Rising input costs compress corporate margins while economic uncertainty reduces valuation multiples. The combination creates conditions where equities struggle to maintain purchasing power even before considering absolute returns.
Equity Market Headwinds:
- Input cost inflation reducing profit margins
- Demand destruction from economic slowdown
- Multiple compression from increased uncertainty
- Dividend yields inadequate versus inflation rates
Energy producers and commodity-linked companies provided exceptions during the 1970s, but broad market indices delivered disappointing real returns across the full decade.
Fixed Income Vulnerability
Bonds represent particularly vulnerable assets during stagflation. Fixed coupon payments lose purchasing power annually when inflation exceeds yields. Additionally, eventual monetary tightening creates capital losses as rates rise, punishing bondholders twice.
The Volcker shock of 1979-1981 demonstrated this mechanism clearly. Federal funds rates rose from approximately 11% to peaks near 20%, creating substantial capital losses for existing bondholders even as the policy successfully broke inflation expectations.
Cash and Money Market Erosion
While cash provides liquidity and nominal safety, it offers no protection against purchasing power decline. Savings rates consistently lagged inflation throughout the 1970s, creating guaranteed real losses for conservative investors seeking capital preservation.
A 6% savings rate appears reasonable until inflation runs at 11%, creating a -5% real return that compounds annually. Consequently, this dynamic forces investors to seek alternatives or accept systematic wealth erosion.
Silver vs. Gold: Risk-Return Trade-offs
Gold's Stability Characteristics
Gold typically provides more stable returns during precious metals bull markets. Its primary monetary function creates consistent demand patterns, while its larger market size reduces volatility from individual transactions or policy changes.
Gold's role as the ultimate monetary asset becomes particularly pronounced during currency debasement periods. Central bank accumulation patterns and institutional demand provide price support independent of industrial applications.
Silver's Amplification Properties
Silver's smaller market size and industrial demand component create both opportunity and risk. During precious metals rallies, silver often outpaces gold significantly. However, economic slowdowns can pressure industrial demand, creating downside volatility.
Silver Risk Considerations:
- Industrial demand sensitivity to economic cycles
- Market size limitations creating higher volatility
- Potential for regulatory intervention during extreme moves
- Storage and transaction costs for physical ownership
Silver's dual nature as monetary metal and industrial commodity means both functions can reinforce price movements. This is particularly evident when analysing what happens to gold and silver during stagflation, as currency debasement coincides with supply-driven inflation.
Current Market Conditions Assessment (2025-2026)
Contemporary Stagflation Indicators
Recent economic data suggests potential stagflationary conditions emerging. Current gold's 2025 surge explained shows gold crossed $3,000 per ounce on March 14, 2025, and reached $5,000 by late January 2026. Current trading near $4,672 represents levels above inflation-adjusted 1980 peaks.
Current Market Signals:
- Gold trading substantially above inflation-adjusted historical peaks
- Central bank accumulation continuing at elevated levels
- Real yields remaining compressed despite nominal rate increases
- Geopolitical risk premiums elevated across multiple regions
Furthermore, the silver market squeeze analysis confirms similar pressure building in silver markets, suggesting coordinated precious metals strength.
Policy Response Limitations
Modern central banks face similar constraints to their 1970s predecessors. Aggressive rate increases risk triggering severe recessions when economic growth is already slowing. Maintaining accommodative policy risks entrenching inflation expectations when prices are already rising.
The US tariffs and inflation impact analysis demonstrates how supply-side disruptions can create stagflationary pressures. Moreover, research on tariff impact on markets shows how trade policies can exacerbate these conditions.
The next major ASX story will hit our subscribers first
Investment Strategy Framework
Allocation Considerations
Precious metals allocation during stagflation should reflect individual risk tolerance and investment time horizons. Historical analysis suggests meaningful allocations of 10-20% provided optimal diversification benefits during extended stagflationary periods without creating excessive concentration risk.
The specific allocation depends on:
- Risk Tolerance: Silver offers higher potential returns with increased volatility
- Time Horizon: Longer periods allow for riding through corrections
- Portfolio Composition: Existing exposure to commodities and inflation-sensitive assets
- Liquidity Needs: Physical metals vs. financial instruments considerations
Timing and Implementation
Dollar-cost averaging approaches help manage the inherent volatility in precious metals investing. Lump-sum investments carry higher risk due to potential short-term corrections even within secular bull markets, as the 1974-1976 gold correction demonstrated.
Regular accumulation patterns also benefit from silver's amplification characteristics. This allows investors to accumulate during periodic weakness while maintaining exposure to potential outperformance during rally phases.
Physical vs. Financial Instruments
Direct ownership of physical metals eliminates counterparty risk but involves storage, insurance, and transaction considerations. ETFs and mining stocks provide exposure with different risk-return profiles and enhanced liquidity characteristics.
Physical Ownership Benefits:
- No counterparty risk during market stress
- Direct exposure to metal price movements
- Long-term storage options available
- No management fees or fund closure risk
Financial Instruments Advantages:
- Enhanced liquidity for trading
- Lower transaction costs for frequent adjustments
- Professional management and diversification
- IRA and retirement account compatibility
Risk Management and Drawdown Considerations
Volatility Expectations
Even during favorable macroeconomic environments, precious metals experience significant corrections. Gold's 40% decline between 1974-1976 occurred within a decade that delivered over 2,000% nominal returns. This pattern emphasizes the importance of conviction and appropriate time horizons.
Silver's corrections tend to be more severe, reflecting its smaller market size and dual-use nature. Industrial demand sensitivity can create additional downside pressure during economic slowdowns, even when monetary factors remain supportive.
Exit Strategy Planning
Stagflation eventually ends through aggressive policy intervention that restores positive real interest rates. The Volcker shock demonstrated how dramatically positive real rates can reverse precious metals trends. The record-high gold prices analysis shows how current levels compare to historical peaks.
Exit Indicators:
- Real interest rates turning decisively positive
- Inflation expectations becoming anchored at lower levels
- Economic growth resuming sustainable patterns
- Central bank policy shifting to restrictive stance
Successful precious metals investing during stagflation requires recognising both the entry and exit conditions. Investors cannot assume secular trends continue indefinitely when understanding what happens to gold and silver during stagflation.
Frequently Asked Questions
How Long Do Stagflation Periods Typically Last?
Historical stagflation episodes have varied significantly in duration. The 1970s experience extended nearly a decade, from the early 1970s through Volcker's aggressive intervention in 1979-1981. Resolution typically requires sustained policy commitment to restore price stability despite short-term economic costs.
The duration depends on policy responses, the severity of underlying supply shocks, and the degree to which inflation expectations become entrenched in wage and pricing decisions throughout the economy.
Can Precious Metals Lose Value During Stagflation?
While precious metals have historically outperformed during stagflation, short-term corrections remain possible and likely. Gold's 40% decline from 1974-1976 peaks demonstrates that even favorable macro environments include significant volatility.
The key distinction is maintaining purchasing power over full cycles rather than avoiding all short-term price volatility. However, investors must be prepared for interim drawdowns while maintaining focus on longer-term inflation protection objectives.
What Percentage of Portfolio Should Be in Precious Metals?
Allocation decisions depend on individual circumstances, but historical analysis suggests 10-20% allocations provided meaningful diversification benefits without creating excessive concentration risk. The specific percentage should reflect:
- Risk tolerance for precious metals volatility
- Existing portfolio composition and diversification
- Investment time horizon and liquidity needs
- Inflation protection objectives versus growth goals
Are Mining Stocks Better Than Physical Metals?
Mining stocks offer leverage to metal price movements but carry additional operational, financial, and management risks. Physical metals provide direct exposure without corporate-specific risks but involve storage and insurance considerations.
During stagflation, physical metals typically provide more reliable inflation protection, while mining stocks can deliver higher returns but with increased volatility and potential for company-specific problems independent of metal prices.
How Do You Know When Stagflation Is Ending?
Stagflation typically ends when central banks prioritise inflation control over growth support, creating positive real interest rates that restore traditional asset class relationships. Key indicators include:
- Federal funds rates rising above inflation rates
- Inflation expectations declining in bond markets
- Economic growth resuming despite higher rates
- Precious metals prices stabilising or declining
The transition often involves significant short-term economic pain, as the Volcker experience demonstrated. Nevertheless, it ultimately restores normal monetary conditions and asset class performance patterns.
Additionally, stagflation and gold analysis provides deeper insights into these complex relationships during economic transitions.
This analysis is provided for educational purposes and does not constitute investment advice. Precious metals investing involves risks, including the potential for significant price volatility. Past performance does not guarantee future results. Investors should consult with qualified financial advisors before making investment decisions.
Ready to Position Yourself for the Next Market Disruption?
Discovery Alert's proprietary Discovery IQ model delivers instant notifications on significant ASX mineral discoveries, empowering subscribers to identify actionable opportunities ahead of the broader market during volatile economic conditions. Begin your 14-day free trial today and secure your market-leading advantage as traditional asset relationships continue to shift.