
May 21, 2026
When Emergency Reserves Become the Market: Understanding the SPR's Diminishing Strategic Depth
Global oil markets have always carried an embedded paradox: the tools designed to stabilise prices in a crisis can, when used repeatedly or at scale, begin to erode the very capacity they were built to preserve. Strategic petroleum reserves exist precisely for moments when supply chains fracture and panic threatens to overwhelm rational pricing. StanChart SPR withdrawals tightening U.S. oil buffers has emerged as one of the most consequential themes in global energy markets heading into mid-2026, sitting at the heart of what commodity analysts at Standard Chartered are now flagging as a structural vulnerability in the U.S. energy security architecture.
When big ASX news breaks, our subscribers know first
The Largest Emergency Oil Release in History, Explained
When Iran moved to blockade the Strait of Hormuz in early 2026, disrupting one of the world's most critical crude transit corridors, the International Energy Agency convened its 32 member countries for an emergency response that dwarfed anything attempted before. The resulting commitment of 400 million barrels from strategic reserves across member nations represents more than double the 182.7 million barrels mobilised during the 2022 response to the Russia-Ukraine war, making it the largest coordinated strategic oil release in recorded history. A Strait of Hormuz oil shock of this magnitude has significant implications for long-term energy security planning.
The United States committed the single largest national contribution to this programme, pledging 172 million barrels from its Strategic Petroleum Reserve. The Department of Energy moved quickly to execute the first tranche, awarding contracts for 45.2 million barrels to eight companies drawing from storage sites located in Texas and Louisiana. What followed was an acceleration in the pace of withdrawals that has since drawn significant attention from commodity research teams tracking U.S. inventory dynamics.
| Emergency Event | Total Release Volume | Key Participants |
|---|---|---|
| Russia-Ukraine War Response (2022) | ~182.7 million barrels | IEA member states |
| Iran-Hormuz Blockade Response (2026) | 400 million barrels | 32 IEA member countries |
| U.S. Share (2026 programme) | 172 million barrels | U.S. Department of Energy |
| First contract tranche awarded | 45.2 million barrels | Eight companies, Texas and Louisiana |
Record Weekly Drawdown Rates and the Inventory Picture They Reveal
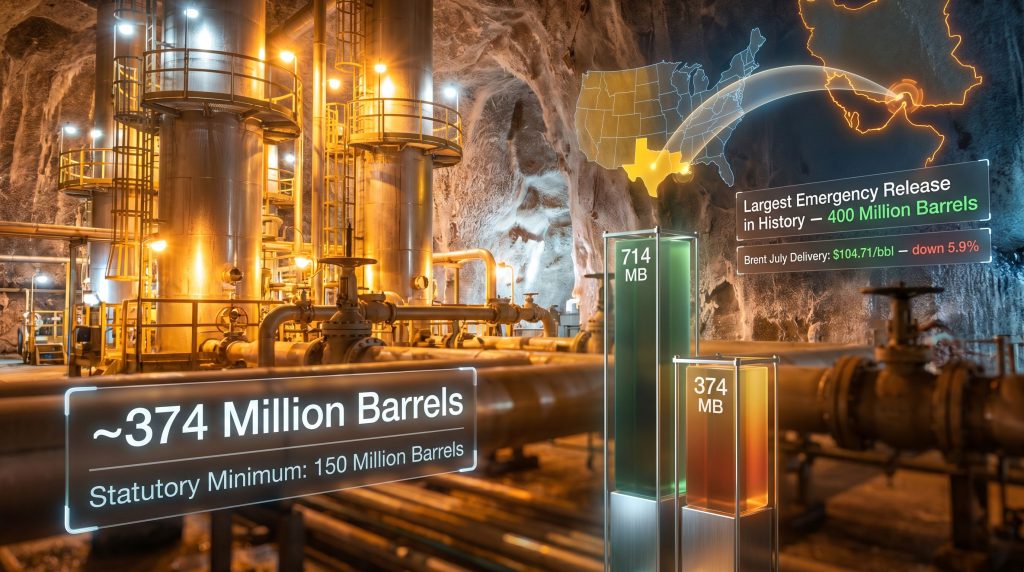
Standard Chartered's commodity research team has reported that U.S. SPR inventories fell by 9.9 million barrels in the week ending May 15, following a decline of 8.6 million barrels the prior week. Together, these figures represent the fastest consecutive weekly drawdown rates on record, pushing total SPR inventory down to approximately 374 million barrels. According to analysis on current drawdown rates, the strategic reserve could drop to its lowest levels since the 1980s if withdrawals continue at this pace.
To appreciate the significance of that figure, some structural context is necessary. The U.S. SPR was engineered with a maximum physical storage capacity of approximately 714 million barrels, held in a network of underground salt caverns distributed across the Gulf Coast region of Texas and Louisiana. These geological formations offer near-ideal conditions for crude storage, being naturally impermeable, structurally stable under pressure, and capable of maintaining crude quality across extended periods.
The cavern-based design also permits high-speed injection and withdrawal operations that surface tank farms cannot match. However, what the salt cavern infrastructure cannot do is replenish itself. It is here that the current drawdown trajectory carries its most consequential implications.
| SPR Metric | Volume |
|---|---|
| Maximum physical capacity | ~714 million barrels |
| Estimated inventory at end-2025 | ~413 million barrels |
| Current inventory (post-drawdown) | ~374 million barrels |
| Statutory operational minimum | 150 million barrels |
| Deployable buffer above statutory minimum | ~224 million barrels |
| Maximum withdrawal rate | 4.4 million barrels per day |
At a maximum extraction rate of 4.4 million barrels per day, the remaining deployable buffer above the statutory minimum of 150 million barrels could theoretically be exhausted in approximately 51 days under sustained maximum drawdown conditions. This is not a forecast but a structural arithmetic reality that energy security planners must factor into crisis response planning.
Why Hormuz Disruptions Create Such Extreme Price Behaviour
The Strait of Hormuz is the world's single most important oil chokepoint. At its narrowest, the passage measures just 33 kilometres across the navigable channel, yet it carries an estimated 20% of global oil trade and roughly 30% of all seaborne liquefied natural gas shipments. When that corridor closes, buyers cannot simply redirect shipments with immediacy.
Pipeline alternatives are limited in capacity, longer routing options add weeks to voyage times, and alternative suppliers face production constraints that cannot be resolved overnight. Furthermore, the crude oil prices 2025 market dynamics that preceded this crisis had already left inventories lean, amplifying the market response.
The market reaction reflected this structural reality with extraordinary force. North Sea Forties crude surged to nearly $150 per barrel by mid-April, surpassing the historic 2008 price peak. Front-month Brent traded in an intraday range of $35 per barrel on a single day in March, a level of volatility that triggers systematic risk protocols across institutional portfolios.
This volatility carries a specific technical consequence known as a Value at Risk shock, or VaR shock. When an asset's daily price range expands dramatically, the statistical models used by banks, hedge funds, and commodity trading desks immediately demand either position reduction or additional capital allocation. Consequently, many buyers chose to defer crude purchases rather than carry the risk of a further price swing, contributing directly to the temporary collapse in physical crude premiums that followed the initial spike.
The Temporary Price Suppression Architecture
Standard Chartered's analysis identifies four distinct mechanisms that have collectively suppressed near-term physical oil prices since the Hormuz disruption began. Understanding each one, and critically, understanding its expiry timeline, is essential to assessing where prices are likely to move next.
-
Strategic reserve drawdowns — finite by design, constrained by both statutory minimums and the physical limits of extraction infrastructure. The statutory floor of 150 million barrels cannot be breached under U.S. law, and the 4.4 million barrels per day maximum withdrawal rate caps the speed of deployment.
-
Reduced refinery run rates — operators have deferred maintenance schedules and reduced throughput to limit crude input demand. This is a temporary operational choice with a hard reversal point.
-
Commercial inventory drawdowns — the secondary buffer layer sitting in tanks operated by traders, refiners, and pipeline operators is being consumed alongside strategic reserves. Once these stocks normalise, they cease to act as a cushion.
-
Alternative supply sourcing — buyers have accelerated purchases from non-disrupted regions, absorbing available Atlantic Basin, West African, and U.S. domestic production. This is capacity-constrained and cannot expand indefinitely beyond existing production ceilings.
Standard Chartered's research team highlights that each of these mechanisms carries an inherent expiry point. Once purchase deferrals can no longer be sustained, refinery utilisation rebounds, and reserve releases conclude, physical oil prices are structurally positioned to reassert upward pressure, potentially pulling futures contracts higher in their wake.
Physical vs. Futures: The Price Divergence That Markets Must Eventually Correct
One of the most technically interesting dynamics emerging from the current crisis is the divergence between physical benchmark prices and financial futures contracts. In most well-functioning crude oil markets, spot physical prices and near-term futures prices trade within a narrow range of each other, reflecting the cost of carry, storage, and delivery logistics.
The current environment has produced a more unusual configuration. Physical cargo premiums for certain grades collapsed by as much as 90% from their crisis peaks, as buyer restraint and alternative supply sourcing temporarily flooded the spot market with available barrels. Meanwhile, deferred futures contracts priced in a degree of long-term normalisation: Brent for delivery in five years fell by $0.69 per barrel week-on-week to $72.22 per barrel, signalling that long-horizon participants expect the supply disruption to eventually resolve.
However, within this week's data, Standard Chartered also noted that Dated Brent outpaced front-month WTI Brent futures gains, rising by $9.52 per barrel (9.12%) to a weekly settlement high. This renewed widening of the physical-to-futures spread suggests that the temporary suppression mechanisms are beginning to lose traction, and that physical tightness is reasserting itself even as diplomatic signals attempt to anchor sentiment.
The next major ASX story will hit our subscribers first
Geopolitical Headline Risk and the Three Scenarios Ahead
Oil prices have been operating in a headline-driven regime since the Hormuz blockade began. Statements from U.S. and Iranian officials move markets with a speed and magnitude that makes fundamental analysis alone insufficient for near-term price positioning. Brent crude for July delivery fell 5.9% to $104.71 per barrel following signals of potential diplomatic progress, while the corresponding WTI contract declined 6.1% to $97.90 per barrel in the same session.
The forward curve is simultaneously processing optimism at the long end and tightness at the short end, a configuration that creates meaningful trading opportunity but also substantial risk for poorly positioned participants. In addition, global trade disruptions stemming from the conflict are compounding the challenge for energy importers managing supply chain exposure.
| Scenario | Key Trigger | Likely Oil Price Direction | SPR Implication |
|---|---|---|---|
| Diplomatic Resolution | Iran-U.S. ceasefire and Hormuz reopening | Significant downward correction | Drawdown programme concludes early |
| Prolonged Stalemate | Negotiations stall, blockade continues | Elevated but stable price range | SPR buffer continues to erode |
| Escalation | Military engagement resumes or expands | Sharp upward price spike | Emergency releases accelerate toward statutory limits |
If the blockade persists for a further 60 days and withdrawals continue at approximately 9 million barrels per week, total U.S. SPR inventory could approach the 300 million barrel level. At that threshold, Washington's capacity to respond to any simultaneous secondary supply disruption would be materially constrained.
The SPR Replenishment Problem Nobody Is Talking About
Drawing reserves down is operationally straightforward compared to rebuilding them. Replenishment requires government budget appropriations, favourable market timing to avoid purchasing at elevated prices, and logistical sequencing through the same Gulf Coast infrastructure that handles withdrawals. Historical precedent suggests that major drawdowns take years rather than months to reverse.
Furthermore, the trade war oil markets environment preceding this crisis had already complicated the procurement landscape for future replenishment. Following the large-scale releases authorised between 2021 and 2023, the SPR had already declined significantly from its near-capacity highs before the current 2026 programme began. The cumulative effect of repeated large drawdowns without corresponding replenishment cycles has left the reserve operating at roughly 52% of its design capacity.
That figure would have been considered alarming by the architects of the SPR framework when it was established in the aftermath of the 1973 oil embargo. The broader policy question gaining traction in energy security circles is whether the SPR has been progressively repurposed from a true emergency instrument into a price management tool. If that assessment is correct, it has material long-term consequences for the reserve's ability to fulfil its foundational mandate.
What Energy Market Participants Should Monitor Weekly
For investors and analysts tracking the intersection of geopolitics and energy fundamentals, the following data series provide the most reliable leading indicators of where physical and financial oil markets are heading. According to Reuters reporting on the SPR exchange programme, the U.S. is also soliciting exchange arrangements that could further complicate the inventory picture.
- U.S. DOE weekly SPR inventory reports — the primary data point for tracking drawdown pace against the statutory floor
- Dated Brent vs. front-month futures spread — a real-time gauge of physical market tightness relative to financial sentiment
- IEA member state release compliance rates — monitoring whether the 400-million-barrel commitment is being fulfilled proportionally across all 32 participants
- U.S.-Iran diplomatic communications — the dominant near-term price catalyst in a headline-driven market
- Refinery utilisation rates — the signal that deferred maintenance cycles are ending and crude input demand is recovering
- Commercial crude inventory levels — the secondary buffer whose depletion accelerates the timeline for physical price reassertion
The convergence of record-pace SPR withdrawals, a historically unprecedented coordinated emergency release, and a geopolitical conflict centred on the world's most critical oil transit point has created a market environment with few historical analogues. Standard Chartered's analysis confirms that StanChart SPR withdrawals tightening U.S. oil buffers represents not merely a short-term inventory story but a longer-duration structural concern deserving serious attention from anyone with exposure to energy markets, or to the broader macroeconomic consequences of sustained elevated oil prices.
This article is intended for informational purposes only and does not constitute financial or investment advice. Oil price forecasts and scenario analyses involve significant uncertainty and should not be relied upon as the basis for investment decisions. Past market behaviour is not indicative of future outcomes.
Want To Stay Ahead of the Next Major Commodity Discovery?
While energy security analysts monitor the structural erosion of U.S. oil buffers, Discovery Alert's proprietary Discovery IQ model scans ASX announcements in real time, delivering instant alerts on significant mineral discoveries across more than 30 commodities — explore historic discoveries and their market returns to understand the opportunity, then begin your 14-day free trial at Discovery Alert to position yourself ahead of the broader market.