
July 21, 2026
The Physics of Commodity Scarcity: Why Inventory Depletion Creates Non-Linear Price Events
Understanding how commodity markets fail requires grasping one uncomfortable truth: unlike financial assets, physical goods cannot be conjured from thin air. When inventory levels decline past a critical threshold, price discovery stops being orderly. It becomes vertical. This dynamic sits at the heart of what Johns Hopkins University professor of applied economics Steve Hanke oil price spike and Strait of Hormuz closure analysis has been tracking throughout 2026, as the convergence of two major geopolitical disruptions threatens to push global oil markets into genuinely uncharted territory.
The concept is straightforward in theory but catastrophic in practice. Markets absorb shocks through stored cushions of physical supply. Once those cushions are exhausted, the only mechanism available to rebalance supply and demand is price, and when flow is simultaneously restricted, price has very little ceiling.
When big ASX news breaks, our subscribers know first
Why the Strait of Hormuz Closure Is Historically Without Precedent
The Geography of Vulnerability
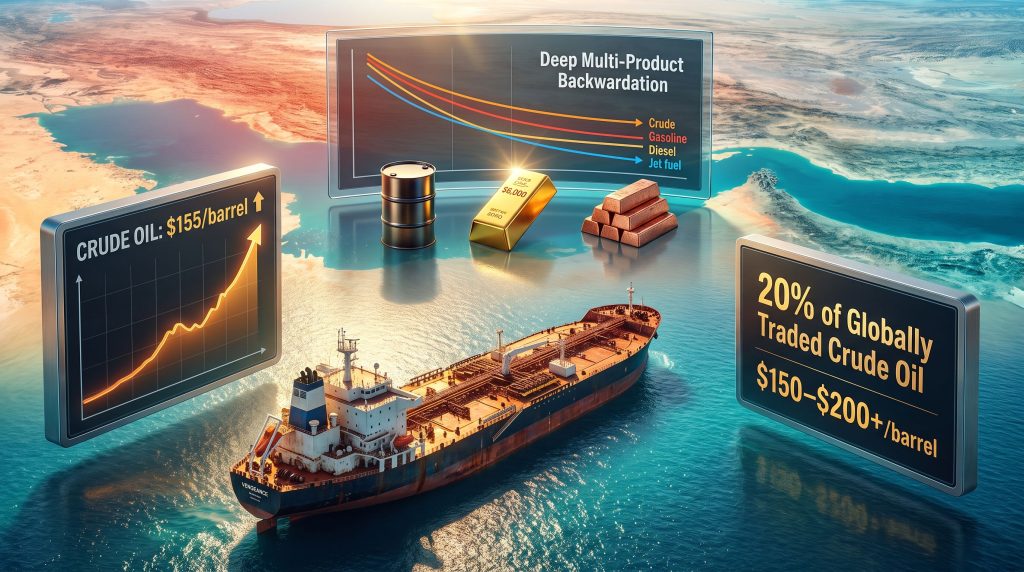
The Strait of Hormuz is not simply an important shipping lane. It is the single most concentrated energy chokepoint in the history of global trade, channelling approximately 20% of all globally traded crude oil and liquefied natural gas through a corridor measuring roughly 33 kilometres at its narrowest navigable point. No other geographic feature holds this proportion of global energy supply in such a tight geographic constraint.
Comparing the 2026 disruption to historical precedents illustrates just how unprecedented the current situation is:
| Historical Event | Volume Affected (Estimated) | Duration | Primary Mechanism |
|---|---|---|---|
| 1973 OPEC Embargo | ~7% of global supply | ~5 months | Political export restriction |
| 1979 Iranian Revolution | ~4–7% of global supply | ~6 months | Production collapse |
| 1990–91 Gulf War | ~4–5% of global supply | Short-term | Regional conflict |
| 2026 Strait Closure | ~20% of global supply | Ongoing (as of July 2026) | Physical access denial |
The scale differential is not incremental. It is structural. The current closure, if sustained, represents a supply disruption roughly three times larger than the 1973 embargo by volume.
Iran's Ongoing Control and the Inbound Traffic Problem
A detail that rarely receives sufficient analytical attention is not the outbound cargo figures but the inbound tanker traffic. On July 16, 2026, only a single tanker transited the Strait. Inbound movements, critical for restoring operational capacity to fields that have been effectively locked out, were even lower. This matters because restarting oil fields that have ceased or reduced operations is not instantaneous. There is significant operational lag, meaning that even if geopolitical conditions were to improve tomorrow, the supply response would be measured in months, not days.
Iran's continued physical control of the Strait means this lag problem compounds rather than resolves over time. Business Insider's analysis of the Hormuz disruption provides further context on how Iran's leverage over this corridor is reshaping global energy flows.
The Red Sea Complication
Saudi Arabia responded to the Strait disruption by rerouting crude exports through overland pipelines, exiting via the Red Sea instead. This appeared to offer a partial workaround. However, Houthi activity in Yemen now threatens this alternative corridor, creating a scenario where both the primary and secondary export routes for Gulf crude face simultaneous disruption. The Red Sea alternative has not yet been fully severed, but the threat is active and escalating.
Backwardation, Crack Spreads, and What Forward Curves Are Really Saying
Reading the Forward Curve as a Real-Time Inventory Gauge
Most investors understand commodity prices directionally. Far fewer understand what the shape of the forward curve reveals about the underlying physical market. This distinction is critical for interpreting current conditions accurately. Furthermore, understanding these crude oil price trends helps investors position ahead of potential inflection points.
| Market Condition | Spot vs. Futures Price | Inventory Signal | Historical Frequency (Last 20 Years) |
|---|---|---|---|
| Contango | Spot below Futures | Ample or surplus inventory | ~95% of the time |
| Backwardation | Spot above Futures | Low or depleted inventory | ~5% of the time |
| Deep Multi-Product Backwardation | All refined products + crude simultaneously | Critical shortage risk | Extremely rare |
For approximately 95% of the past two decades, crude oil traded in contango, the normal state where storing oil for future delivery costs money, and the futures price reflects that carrying cost by trading above spot. When markets flip into backwardation, participants are willing to pay a premium for immediate physical delivery. That premium is the market expressing a shortage.
As of mid-July 2026, crude oil, gasoline, diesel, and jet fuel forward curves are all simultaneously in backwardation. Hanke describes this forward curve shape as getting steeper each week, with the gap between spot and futures prices widening continuously. This simultaneous multi-product backwardation is historically rare and points to acute, multi-layered supply stress across both crude inputs and finished petroleum products.
What Crack Spreads Reveal About Refining Capacity
A crack spread measures the margin between crude oil input costs and the refined products derived from it. Under normal market conditions, crack spreads reflect reasonable refining economics. When they widen dramatically, the market is signalling that refining capacity is running at or near its physical maximum relative to demand for finished products.
Current crack spreads are historically unusual, driven by two compounding factors. First, the loss of Russian refining output has removed a substantial source of globally traded refined products. Prior to the NATO-Russia conflict, Russia supplied between 8% and 10% of all globally traded refined petroleum products, including diesel, gasoline, and jet fuel. Russia has now halted diesel exports entirely and has become a net importer of gasoline and jet fuel, with fuel queue times in major Russian cities reportedly exceeding one hour.
Second, remaining global refining capacity is running at maximum utilisation with scheduled downtime creating additional periodic constraints.
The diesel crack spread deserves particular attention. Diesel is the primary operational fuel for mining, agriculture, and heavy industry. Elevated diesel prices simultaneously compress margins for commodity producers and raise output costs across the broader economy, creating a reinforcing inflationary loop in commodity-intensive sectors.
The Three Cushioning Forces That Delayed the Price Spike
Why Prices Have Remained Below Crisis Levels
A legitimate question arises: if the supply disruption is this severe, why have energy prices not already spiked to catastrophic levels? Hanke identifies three specific mechanisms that have dampened what would otherwise have been a sharper, earlier price response:
- Inventory drawdowns: Nations, refiners, and major importers have been consuming existing stockpiles rather than sourcing new supply from disrupted routes. This acts as a temporary substitute flow injection into the market.
- Higher-than-expected demand destruction: Historical models of price elasticity for petroleum products suggested that a 10% price increase would produce roughly a 2-3% reduction in demand. Current demand destruction is running at over 5% per price increase, significantly higher than historical norms. This additional demand reduction has cushioned prices.
- China's reduced import activity: Rather than entering spot markets and competing for available supply, China has been drawing heavily on domestic reserves. This temporarily suppressed global import demand and reduced upward price pressure.
These cushioning effects are finite. Inventories have physical limits. Demand destruction beyond a certain threshold represents permanent economic damage rather than efficient adjustment. And China's domestic reserves are also depletable.
The Non-Linear Transition Point
The critical insight is that the transition from inventory depletion to genuine supply void is not gradual. Prices do not rise incrementally as inventories decline from full to empty. The relationship is non-linear: markets function reasonably until a threshold is crossed, at which point price discovery becomes disorderly. Monetary policy cannot resolve a physical flow shortage. Unlike a financial market stress event, a commodity supply void cannot be addressed by central bank intervention.
Steve Hanke's Price Scenarios and What Would Trigger Each
Mapping the Outcome Space
Hanke is explicit that precise forecasting is extremely difficult, but the scenario framework he describes maps the range of outcomes against the key variables:
| Scenario | Strait of Hormuz | Red Sea | Inventory Level | Estimated WTI Price Range |
|---|---|---|---|---|
| Base Case | Partially functional | Houthi threat active | Low | $80–$100/barrel |
| Elevated Risk Case | Effectively closed | Partially restricted | Near-depleted | $100–$150/barrel |
| Worst-Case Dual Closure | Fully closed | Fully blocked | Exhausted | $150–$200+/barrel |
The worst-case scenario involves inventory depletion coinciding with both the Strait and the Red Sea alternative being effectively closed simultaneously. In this case, new flow entering the market would approach zero, and the price response would be severe. According to Fortune's coverage of the Hanke warnings, the Steve Hanke oil price spike and Strait of Hormuz closure scenario is being taken seriously by a growing number of economists.
Why Timing Points to Late Summer or Early Autumn 2026
The timing logic follows directly from the inventory drawdown rate. Cushions that have been absorbing supply disruptions since the conflict escalated have been running down continuously. The longer the Strait remains closed, the closer markets approach the threshold where stored supply can no longer substitute for missing flow. Hanke's assessment, stated as of mid-July 2026, was that a significant price spike could materialise by August or early autumn if current conditions persist.
How Investors Can Position for Rising Oil Prices
The Roll Trade in a Backwardated Market
One of the less commonly understood opportunities created by backwardation is the structural profitability of rolling futures positions forward. In a normal contango market, investors who hold long futures positions pay a carrying cost when rolling: the forward contract is more expensive than the expiring contract, so rolling forward costs money. In backwardation, this dynamic reverses entirely.
How the roll trade works:
- Purchase a near-term futures contract at the current elevated spot price.
- As the contract approaches expiry, sell it at that higher near-term price.
- Simultaneously purchase a further-dated contract at the lower forward price.
- The difference between the higher near-term sale price and the lower forward purchase price generates a structural profit, independent of any further price movement in the underlying commodity.
This built-in return exists as long as the market remains in backwardation. In economic terms, the forward curve in backwardation represents the market borrowing supply from the future into the present, paying a premium to access it now. Investors who understand this structure are paid to provide that liquidity.
Positioning by Investor Sophistication
| Investor Profile | Recommended Approach | Risk Level | Specialist Knowledge Required |
|---|---|---|---|
| General investor | Long positions in major integrated oil producers | Moderate | Low |
| Intermediate investor | Options on oil futures or ETFs | Moderate–High | Medium |
| Sophisticated investor | Roll trade in backwardated futures | High | High |
| Specialist investor | Crack spread positions; junior producer exposure | Very High | Very High |
For most investors, the most accessible approach is simply purchasing shares in major integrated oil producers. These companies carry very liquid markets, trade at relatively low valuations given the supply environment, and offer leveraged exposure to rising oil prices without requiring an understanding of forward curve mechanics. Junior producers with significant untapped production capacity represent a higher-risk, higher-reward alternative for those with specialist knowledge of individual company fundamentals.
The next major ASX story will hit our subscribers first
Gold's Bull Market: Why the Pullback Does Not Change the Structural Case
Three Forces Behind the January 2026 Correction
Gold's pullback from its peak since January 2026 has prompted some market participants to question whether the bull market has run its course. Hanke's assessment is that the fundamental drivers remain entirely intact. The correction reflects three specific short-term headwinds rather than any structural change in gold's role:
- US dollar strength creating downward pressure on USD-denominated gold pricing through the inverse relationship between dollar value and gold price.
- Rising US interest rates increasing the opportunity cost of holding non-yielding assets, with gold sensitive to both actual rate movements and forward expectations about Fed policy.
- Federal Reserve hawkishness creating sentiment-driven selloffs whenever rate increase signals emerge from official communications.
Each of these is a cyclical force, not a structural one. Consequently, the gold price forecast remains constructive over a longer time horizon, supported by structural demand that cyclical headwinds cannot meaningfully offset.
The $6,000 to $6,600 Price Target: Methodology Explained
Hanke's gold price target is derived from analysing the relationship between gold prices at peak valuations during previous major bull markets and real disposable income per capita in the United States. Across multiple historical bull market cycles, peak gold valuations have tracked this ratio consistently. Applying the same framework to current real disposable income per capita figures produces a target in the range of $6,000 to $6,600 per ounce, with the more precise calculation yielding approximately $6,600.
This is a mathematically grounded methodology rather than a speculative projection. It does not require extraordinary assumptions about monetary collapse or hyperinflation, though such scenarios would potentially extend the bull market beyond this target.
Central Bank Buying as the Structural Engine
| Gold Bull Market Driver | Short-Term Impact | Long-Term Impact | Current Status |
|---|---|---|---|
| Central bank accumulation | Moderate | High | Active, below target allocation |
| Government deficit monetisation | Low (emerging) | Very High | Escalating pressure |
| US dollar purchasing power erosion | Moderate | High | Ongoing |
| Inflation expectations | High (sentiment) | Moderate | Above Fed target at 3.5% |
| Fed funds rate trajectory | High (inverse) | Moderate | Uncertain |
The primary structural driver underpinning the gold bull market is central bank buying. Central banks globally have indicated that their gold holdings as a percentage of total reserves remain below their internal target allocations. This creates a sustained, programme-driven demand base that is not sensitive to short-term price fluctuations.
The Deficit Monetisation Pressure Building Beneath the Surface
Approximately 35% of US individual income tax receipts are currently allocated to federal debt servicing costs. As debt servicing expenses continue rising, the structural pressure on the Federal Reserve to expand the money supply grows proportionally. Monetising deficits reduces the real cost of servicing debt through inflation, but it also erodes the purchasing power of dollar-denominated assets.
Gold is the historical beneficiary of this dynamic. The June 2026 CPI reading of 3.5% represents a significant improvement from the prior month's 4.2%, but remains substantially above the Fed's 2% target, keeping inflation risk firmly in play.
Commodity Super Cycle or War Cycle? Understanding the Structural Distinction
Why Deglobalisation Creates Permanent Inventory Demand
The debate between whether current commodity strength represents a war-driven cyclical spike or a genuine structural super cycle carries significant implications for long-term capital allocation. Hanke's view is that the war has served as a catalyst that accelerated and deepened a pre-existing structural shift rather than being its sole cause.
The mechanism is rooted in inventory economics. In a fully globalised economy, nations and corporations operate on lean, just-in-time inventory models, confident that spot markets will deliver goods on demand. As geopolitical fragmentation advances, this confidence erodes. The rational response for any economic actor whose supply chains are increasingly uncertain is to hold larger precautionary inventories across energy, food, and critical materials. This structurally increases commodity demand independent of any single conflict, creating a persistent demand floor that persists even when active hostilities subside.
A Decade of Underinvestment in Hard Assets
Capital allocation over the prior decade tilted heavily toward asset-light technology businesses with minimal physical assets on their balance sheets. Hard asset sectors, including oil exploration, mining infrastructure, and agricultural capital expenditure, experienced sustained underinvestment in sustaining capital. The AI infrastructure buildout is beginning to partially reverse this pattern, as data centres and power infrastructure are asset-heavy businesses that create material demand for copper, energy, and critical minerals demand.
Copper, Tungsten, and the Byproduct Supply Problem
Why Copper Represents a Near-Consensus Bullish Position
Hanke's assessment of copper is unambiguous: the supply-demand dynamics point to a structural deficit, driven by AI infrastructure buildout, electrification requirements, and the general underinvestment in new mining capacity over the prior decade. The copper supply crunch is compounded by demand growth from multiple independent sources and constrained supply response capacity, creating the conditions for a sustained price cycle.
The Byproduct Problem in Critical Minerals
Tungsten represents a useful case study in a supply dynamic that affects the majority of critical minerals. Most critical minerals are produced as byproducts of primary mining operations targeting a different commodity entirely. This means supply cannot respond quickly to demand increases or price signals. The production volume of the critical mineral byproduct is driven by the economics of the primary metal, not by the price of the byproduct itself.
This structural inelasticity means that even moderate demand increases can produce sustained price spikes that take years rather than months to attract sufficient new primary supply. Hanke's view on tungsten is consistent with this framework: the deficit is likely sustainable precisely because of this supply elasticity constraint, not despite it.
Diesel Scarcity as a Compounding Factor for Mining Output
An underappreciated second-order effect of oil market disruption is its direct impact on mining economics. Diesel is the primary operational energy input for most mining operations. Elevated diesel prices simultaneously:
- Compress operating margins for commodity producers at existing output levels.
- Reduce the economic viability of lower-grade ore processing, effectively contracting the addressable resource base.
- Create upward pressure on output prices as supply elasticity declines and operating costs rise.
This creates a reinforcing loop: higher energy costs reduce commodity supply elasticity, which pushes commodity output prices higher, which benefits producers with access to low-cost energy or high-grade deposits. In addition, supply chain disruption driven by geopolitical fragmentation further compounds these operational challenges for mining companies across multiple jurisdictions.
Why Oil Price Spikes Are Not the Same as Inflation
Relative Price Shocks vs. Monetary Inflation
A critical distinction embedded in Hanke's analytical framework that most market commentary overlooks is the difference between a relative price shock and economy-wide inflation. An oil price spike changes the price of one commodity relative to all others. It does not, by itself, cause economy-wide inflation. Consumers who spend more on energy have less to spend elsewhere, compressing demand in non-energy sectors. The net effect on the overall price level depends on monetary conditions, not on the oil price itself.
In Hanke's framework, inflation is fundamentally a monetary phenomenon driven by excess money supply growth. The money supply growth rate sets the ceiling for nominal GDP expansion. Nominal GDP equals real growth plus inflation, so if broad money supply grows at 6% annually, the combined total of real growth and inflation cannot sustainably exceed 6%.
This distinction has practical investment implications. Oil price spikes benefit energy sector investments directly but do not automatically produce the broad inflationary environment that benefits gold, real assets broadly, and inflation-linked instruments. Those require sustained monetary accommodation.
FAQ: Steve Hanke's Oil and Gold Analysis for 2026
What Is Steve Hanke's Oil Price Outlook for 2026?
The Steve Hanke oil price spike and Strait of Hormuz closure scenario outlines a pathway where, if the Strait remains effectively closed and physical inventories are exhausted, crude oil prices could spike sharply above current levels, with extreme scenarios pointing toward the $150 to $200 per barrel range.
Why Does the 2026 Strait of Hormuz Closure Matter More Than Previous Disruptions?
The closure affects approximately 20% of globally traded oil and LNG simultaneously, a scale that exceeds both the 1973 OPEC embargo and the 1979 Iranian Revolution in terms of volume disrupted.
What Does Backwardation Mean for Commodity Investors?
Backwardation signals depleted physical inventories and creates structural roll trade opportunities where rolling long positions forward generates returns rather than incurring carrying costs.
How Was Hanke's $6,000 to $6,600 Gold Price Target Calculated?
The target derives from analysing peak gold valuations relative to real disposable income per capita during previous major gold bull markets, applying the historical ratio to current income figures.
Do Oil Price Spikes Cause Inflation According to Hanke?
No. Hanke distinguishes clearly between relative price shocks and monetary inflation. In his framework, sustained inflation requires excess money supply growth, not commodity price movements alone.
What Is the Simplest Way for a General Investor to Gain Long Oil Exposure?
Purchasing shares in major integrated oil producers represents the most accessible and liquid approach for investors without specialist knowledge of futures mechanics or forward curve trading.
This article is for informational and educational purposes only and does not constitute financial advice, an investment recommendation, or a solicitation to buy or sell any security or financial instrument. All forecasts, price targets, and scenario analyses discussed are inherently speculative and subject to significant uncertainty. Past commodity market behaviour does not guarantee future outcomes. Readers should conduct independent research and consult a licensed financial adviser before making any investment decisions.
Want to Capitalise on the Next Major Commodity Discovery Before the Broader Market?
As commodity supply disruptions reshape global markets, Discovery Alert's proprietary Discovery IQ model delivers real-time notifications on significant ASX mineral discoveries, instantly transforming complex geological data into actionable investment insights for both short-term traders and long-term investors. Explore historic examples of how major mineral discoveries have generated substantial market returns, then begin your 14-day free trial at Discovery Alert to position yourself ahead of the next significant find.