July 24, 2026
When Commodity Thresholds Become Market Turning Points
There is a well-documented pattern in financial markets where risk assets absorb escalating geopolitical stress with remarkable indifference — right up until a specific commodity price or yield level breaks through a threshold that can no longer be rationalised away. These moments are not random. They tend to cluster around psychologically and economically significant price points that force institutional risk models to recalibrate simultaneously across thousands of portfolios.
That dynamic is now playing out in real time as stocks fall on $100 oil and Iran conflict fears combine into a compound macro shock that equity markets spent weeks attempting to dismiss. Understanding why the repricing is happening now, rather than earlier, requires looking at both market psychology and the mechanics of how energy prices transmit into corporate earnings, consumer behaviour, and central bank decision-making. The crude oil price trends leading into this moment had been building pressure for weeks before finally breaking through.
When big ASX news breaks, our subscribers know first
The Numbers Behind the Current Oil and Equity Shock
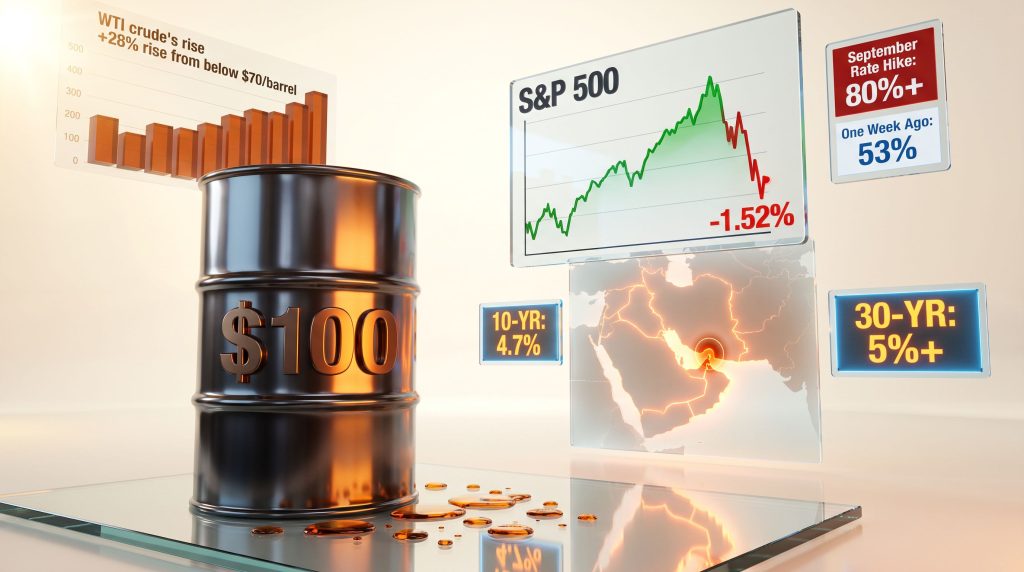
The speed and scale of the current crude oil move is not a minor fluctuation. West Texas Intermediate futures have surged approximately 6% to around $92 per barrel, representing a gain of more than 28% from lows below $70 per barrel recorded earlier in the month. Brent Crude has crossed the psychologically significant $100 per barrel level, a price point that has historically served as a catalyst for equity market stress.
The concurrent moves across asset classes paint a coherent picture of a market undergoing a genuine regime shift:
| Metric | Level |
|---|---|
| Brent Crude | Above $100/barrel |
| WTI Crude | ~$92/barrel (up ~6%) |
| WTI rise from July lows | +28% from below $70/barrel |
| S&P 500 decline (since July 12) | ~2% |
| S&P 500 trough during March conflict onset | -7.5% |
| Oil surge during March conflict onset | ~70% |
| 10-Year Treasury yield | Above 4.7% (highest since Jan 2025) |
| 30-Year Treasury yield | Above 5% |
The S&P 500 has moved toward its worst single-session loss in a month, with index declines spreading across all major U.S. benchmarks:
| Index | Session Decline |
|---|---|
| S&P 500 | -1.52% |
| Dow Jones Industrial Average | -1.56% |
| Nasdaq Composite | -1.78% |
The Nasdaq's steeper decline reflects a structural sensitivity that technology and growth stocks carry relative to rising real yields. Long-duration assets — companies valued on earnings projected far into the future — are mathematically more exposed to discount rate increases than value-oriented sectors. When bond yields rise sharply alongside energy prices, growth stocks absorb a double impact.
What Is Driving Oil Above $100: The Conflict Explained
The Geography of the Price Shock
The Middle East sits at the intersection of global energy supply infrastructure in ways that few other regions can match. The Strait of Hormuz, a narrow maritime passage connecting the Persian Gulf to the Arabian Sea, serves as the transit point for a substantial portion of the world's daily seaborne crude oil supply. Credible threats to navigation through this corridor do not need to result in actual supply disruption to move prices — the possibility of disruption is sufficient to reprice oil futures contracts immediately.
Reports of tanker attacks off the coast of Saudi Arabia added a concrete dimension to what had previously been an abstract geopolitical risk. When attacks shift from military installations to commercial shipping lanes, the market's supply disruption calculus changes rapidly. Furthermore, the oil price market impact from these corridor threats has compounded existing pressure from global trade tensions, creating a particularly difficult environment for energy-sensitive portfolios.
The Escalation Timeline
The United States conducted military strikes against Iran for 12 consecutive nights, a pattern of sustained military engagement that markets initially absorbed with relative calm. The cumulative signal of repeated strikes is qualitatively different from a single incident. Each additional night of strikes compresses the probability space around diplomatic resolution and expands the probability space around prolonged conflict.
According to Business Insider's analysis of the Iran war scenario, the combination of tanker attacks and Strait of Hormuz threats could push oil prices well beyond current levels if diplomatic channels remain closed.
Markets can tolerate geopolitical uncertainty for extended periods when a credible off-ramp narrative remains intact. The moment that narrative loses credibility, the latent risk premium embedded in commodity markets rushes into equity pricing with compressed timing.
Steve Sosnick, chief strategist at Interactive Brokers, described the shift in market sentiment directly, noting that oil at $100, 10-year Treasury yields above 4.70%, and 30-year rates solidly above 5% collectively became too significant for equity markets to continue disregarding.
Three Economic Channels Connecting $100 Oil to Equity Valuations
1. Corporate Profit Margin Compression
Energy functions as an input cost across a wide range of industries that extend far beyond obvious fuel consumers. Transportation logistics, manufacturing processes, agricultural production, and consumer goods distribution all carry embedded energy costs that expand when crude prices spike. At $100 per barrel, these cost increases begin to materially erode earnings estimates across non-energy S&P 500 constituents.
The sectors facing the most direct margin pressure include:
- Airlines and transportation: Jet fuel and diesel costs move almost directly with crude benchmarks
- Retail and consumer goods: Supply chain and logistics cost increases that cannot always be passed through to price-sensitive consumers
- Industrials: Manufacturing energy intensity means margin exposure is significant even when energy is not the primary input
- Consumer discretionary: A sector already sensitive to consumer confidence that now faces both higher input costs and reduced consumer spending capacity
2. Consumer Spending Deterioration
The gas pump functions as a highly visible, frequently experienced price signal for household budgets. Unlike mortgage rate changes or health insurance premium adjustments, fuel costs are encountered multiple times per week by most working households. This visibility makes gasoline prices a particularly powerful driver of consumer sentiment indices, often affecting spending behaviour before the actual income impact is fully felt.
Historical data across multiple energy price cycles demonstrates a reliable relationship between sustained crude oil above $90 to $100 per barrel and measurable deterioration in consumer confidence readings within four to six weeks. These consumer price pressures are amplified when they arrive alongside existing cost-of-living stresses. Consumer spending represents approximately 70% of U.S. GDP, meaning even modest contractions in discretionary household expenditure carry significant macroeconomic implications.
3. Inflation Re-Acceleration and Monetary Policy Complications
Energy price movements feed into official inflation measures including CPI and PCE with a lag that typically runs four to eight weeks, depending on the component being measured. Gasoline prices appear in CPI relatively quickly, while the pass-through of higher transportation costs into goods prices takes longer to materialise in the data.
The stagflation risk framework is particularly relevant in this environment. Higher energy costs simultaneously push headline inflation readings upward while draining household purchasing power and compressing corporate margins — producing the economically awkward combination of rising prices and decelerating growth that central banks are structurally ill-equipped to address.
The critical difficulty for monetary policy in a supply-side inflation shock is that the standard tool of raising interest rates addresses demand-side inflation effectively but cannot resolve supply constraints. Raising rates to fight oil-driven inflation risks tipping a slowing economy into contraction.
The Federal Reserve's Increasingly Difficult Position
The market's implied expectations for Federal Reserve rate decisions have shifted dramatically within days, reflecting how rapidly the macro environment can reprice. The Fed inflation projections that appeared manageable just weeks ago are now being stress-tested against an entirely different energy price environment.
| Fed Meeting | Rate Hike Probability (Current) | Rate Hike Probability (One Week Prior) |
|---|---|---|
| Next Meeting (July) | ~38% | ~12% |
| September Meeting | 80%+ | ~53% |
This repricing, tracked through CME's FedWatch tool, represents a fundamental reassessment of the monetary policy outlook. A rate hike environment layered on top of oil-driven cost increases creates a compounding pressure on equity valuations through two simultaneous channels: higher discount rates applied to future earnings, and reduced earnings from energy cost and consumer spending headwinds.
Why the 1970s Comparison Has Limits
The stagflation comparisons to the 1970s oil embargo period are intellectually tempting but require important qualifications. The United States today operates as a major domestic crude oil producer with significant shale output flexibility that did not exist during the OPEC embargo. Strategic petroleum reserve capacity provides an additional buffer. The oil intensity of U.S. GDP, measured as barrels consumed per dollar of economic output, has also declined substantially over five decades of energy efficiency improvements.
These structural differences mean the stagflation risk is real and warrants serious portfolio consideration, but it is not yet the consensus base case among institutional strategists. The trajectory of oil prices matters as much as current levels.
Why Markets Dismissed the Conflict for Months
The Anatomy of a Complacency Trade
Understanding why stocks fall so sharply on a specific threshold event requires understanding why they did not fall during the weeks of escalating conflict that preceded it. The answer lies in what market participants were collectively betting on.
From late March through early July, the dominant institutional thesis held that the conflict would ultimately be resolved through diplomatic negotiation. JPMorgan equity strategists articulated this view explicitly in a note to clients, arguing that the conflict's eventual resolution through negotiation made dips on geopolitical headlines attractive buying opportunities rather than reasons to reduce exposure.
This thesis was reinforced by two powerful supporting factors:
- AI sector momentum: The artificial intelligence trade reignited strongly through April and May, with chip stocks recording historically strong half-year performance. When a dominant bull narrative gains sufficient momentum, it acts as a psychological anchor that makes investors reluctant to exit even as background risks accumulate.
- Precedent from early March: When the conflict initially escalated in March, the S&P 500 recovered strongly after an initial drop of more than 7.5% at its trough. Investors who held through that drawdown were rewarded. This outcome reinforced the behavioural pattern of treating escalation headlines as noise.
The Dual Threshold Event That Broke Complacency
What finally disrupted the complacency trade was not a single piece of news but the simultaneous breach of two independent thresholds: $100 oil and 4.7% on the 10-year Treasury. These signals arriving together overwhelmed individual risk management frameworks in a way that either signal alone might not have. This market volatility reset has consequently forced a broader reassessment of positioning across multiple asset classes.
When multiple uncorrelated risk indicators breach critical levels at the same time, the mathematical probability of a sustained drawdown increases in a non-linear fashion. The interaction effects between commodity price shocks and yield-driven valuation compression are larger than the sum of their individual impacts.
Wells Fargo Investment Institute's senior global market strategist Sameer Samana noted that investors now need to revisit the economic concerns that dominated market sentiment in March, specifically around inflation re-acceleration and the drag that higher fuel prices place on consumer spending. The reignited conflict was identified as a reason to prepare for a more substantial drawdown in equity markets.
The next major ASX story will hit our subscribers first
Competing Frameworks for What Comes Next
Scenario Mapping Across Oil Price Ranges
| Scenario | Oil Price Range | S&P 500 Implication | Fed Response |
|---|---|---|---|
| Diplomatic Resolution | $75-$85 | Recovery rally probable | Rate cuts back in view |
| Sustained Conflict, Contained | $90-$105 | Sideways with elevated volatility | One hike possible |
| Escalation, Hormuz Disruption | $110-$130+ | Significant drawdown risk | Stagflation dilemma |
| Full Supply Shock | $130+ | Potential recession pricing | Policy paralysis risk |
The $120 Threshold: Where Headlines Become Portfolio Events
Michael Tanney, CEO at investment advisory firm Pereon Wealth, draws a clear distinction between price levels that generate market headlines and price levels that generate actual portfolio damage. In his assessment, a sustained price above $120 per barrel represents the threshold at which meaningful downstream economic effects begin materialising at a scale that affects client portfolios in a durable way, rather than simply creating short-term volatility.
This distinction between transient spikes and sustained elevated prices is analytically important. A brief move to $110 followed by rapid reversal carries very different economic implications than three months of prices above $105. Supply chain repricing, corporate budget revisions, and consumer behavioural adjustments all require sustained price signals before they crystallise into measurable economic data.
Reports from The Guardian's live business coverage indicate that even partial de-escalation signals have been sufficient to move markets meaningfully, underscoring just how sensitive current conditions are to diplomatic developments.
Sectors Most Exposed to Sustained Triple-Digit Oil
- Consumer discretionary: spending contracts as energy costs absorb household income
- Airlines and ground transportation: direct fuel cost exposure with limited short-term hedging flexibility
- Retail with complex supply chains: logistics cost increases that compress margins before any revenue impact
- Growth and technology: long-duration assets repriced lower as real yields climb alongside inflation expectations
Sectors With Potential Resilience
- Energy producers and integrated oil majors: direct beneficiaries of higher crude prices
- Defence and aerospace: elevated geopolitical spending environments tend to support order books
- Commodities and materials with pricing power: inflation pass-through capability provides earnings protection
Frequently Asked Questions
Why do stocks fall when oil rises above $100?
Triple-digit oil simultaneously raises business input costs, reduces consumer purchasing power, lifts inflation expectations, pushes bond yields higher, and compresses equity valuations across multiple sectors at the same time. The combination of these channels produces market-wide pressure rather than sector-specific stress.
What makes the Strait of Hormuz so significant to oil markets?
This narrow maritime passage handles a substantial share of the world's daily seaborne crude oil trade. Any credible threat to commercial navigation through the strait creates immediate supply disruption fears reflected in oil futures pricing, regardless of whether actual supply interruption occurs.
At what price level does oil become genuinely damaging to the economy?
Based on current analyst assessments, a sustained price above $120 per barrel is the level at which measurable downstream economic deterioration, including consumer spending contraction and earnings compression, begins to materialise at a portfolio-relevant scale.
Could the Fed raise rates because of oil-driven inflation?
Market-implied probabilities suggest yes. The September meeting now carries over 80% odds of a rate hike, up from 53% just one week earlier, with oil-driven inflation re-acceleration cited as a primary driver of this repricing.
Why did it take so long for stocks to react to the conflict?
A dominant institutional thesis held that diplomatic resolution was the most probable outcome, causing investors to treat escalation headlines as buying opportunities. This complacency persisted until oil and Treasury yield thresholds were breached simultaneously, forcing a portfolio-level reassessment.
Key Takeaways for Investors Navigating This Environment
- $100 oil is a macro regime signal, not merely a commodity event, with cascading implications for inflation, monetary policy, consumer spending, and corporate earnings across multiple sectors
- The simultaneous breach of $100 oil and 4.7% on the 10-year Treasury represents a compound risk event that individual-factor risk models were not calibrated to handle
- Federal Reserve rate hike probabilities have repriced dramatically within days, demonstrating how quickly the monetary policy outlook can shift in an energy shock environment
- The $120 per barrel threshold represents the current consensus breaking point at which serious economic damage begins to materialise beyond headline volatility
- Investors who built positions on the diplomatic resolution thesis need to stress-test those portfolios against scenarios where negotiations are delayed or fail entirely
- The AI sector's strong performance through April and May served as a behavioural anchor that masked accumulating geopolitical risk, a dynamic that has historically preceded sharper eventual corrections when the masking narrative breaks down
Disclaimer: This article is intended for informational purposes only and does not constitute financial advice. Forward-looking statements, scenario projections, and probability estimates referenced throughout this piece are based on market data and analyst commentary available at the time of writing and are subject to rapid change. Past market behaviour during prior energy shocks does not guarantee similar outcomes in the current environment. Investors should consult qualified financial professionals before making portfolio decisions.
Want to Know Which ASX Discoveries Could Thrive Amid Commodity Market Volatility?
When energy price shocks and macro regime shifts reshape sector fortunes, identifying the right resource opportunities becomes critical — Discovery Alert's proprietary Discovery IQ model delivers real-time alerts on significant ASX mineral discoveries, instantly translating complex commodity data into actionable insights for both short-term traders and long-term investors. Explore historic examples of major mineral discoveries and their market returns, then begin your 14-day free trial to position your portfolio ahead of the next significant discovery.