July 23, 2026
The Architecture of Global Oil Vulnerability: How Two Narrow Passages Hold the World's Energy System Hostage
Energy markets are built on the assumption of continuous flow. Decades of globalised crude trade have created a system of extraordinary efficiency, but also extraordinary fragility. That fragility is concentrated not in oilfields or refineries, but in geography itself. Specifically, in the handful of narrow maritime passages through which the overwhelming majority of seaborne oil must travel. When those passages face simultaneous pressure, the entire pricing architecture of global energy shifts in ways that ripple outward into fuel costs, industrial margins, and commodity markets far removed from the Persian Gulf.
The current episode involving the Strait of Hormuz and Bab el-Mandeb oil disruption is not simply a geopolitical flare-up. It represents a structural stress test of a supply chain that has never been subjected to simultaneous closure risk at both of its most critical nodes. Furthermore, understanding crude oil price trends in this context becomes essential for any market participant seeking to anticipate what comes next.
When big ASX news breaks, our subscribers know first
Understanding the Sequential Dependency That Makes Both Straits Indispensable
Most discussions of oil chokepoints treat each strait as an independent risk. This framing misses the more dangerous reality: the Strait of Hormuz and the Bab el-Mandeb are not parallel alternatives but sequential dependencies within the same export corridor.
Persian Gulf producers, including Saudi Arabia, Iraq, Kuwait, and the UAE, export crude through the Strait of Hormuz into the Gulf of Oman. That oil then transits the Arabian Sea before entering the Red Sea via the Bab el-Mandeb, ultimately passing through the Suez Canal toward European and Asian buyers. The two chokepoints function as consecutive gates in a single pipeline. Closing either gate disrupts the flow. Closing both simultaneously creates a supply shock with no modern historical precedent in terms of combined rerouting constraints.
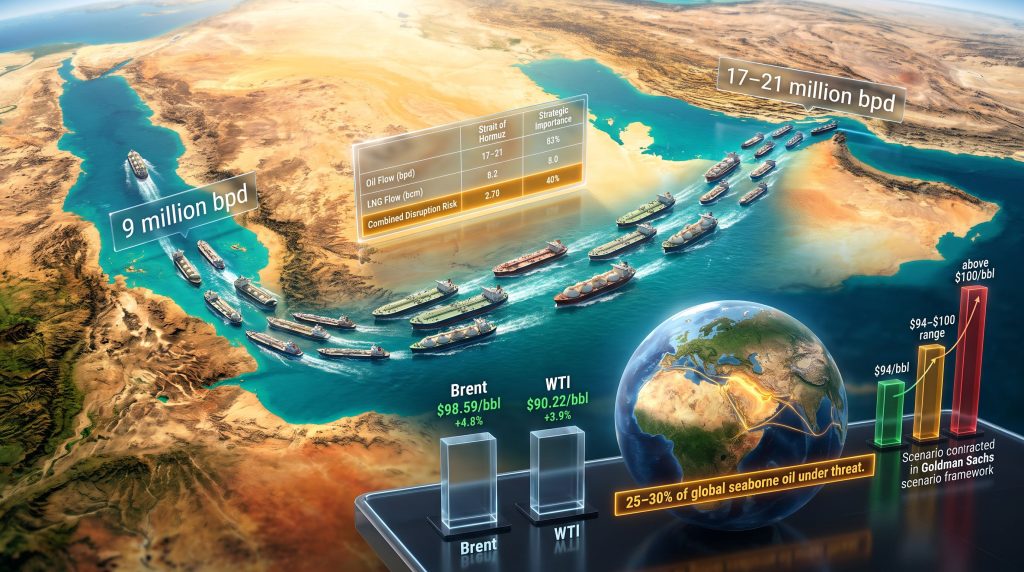
According to the U.S. Energy Information Administration's foundational analysis of world oil transit chokepoints, approximately 18.5 million barrels per day of crude oil and condensate flowed through the Strait of Hormuz in 2016, representing roughly 30% of global seaborne-traded oil and approximately 20% of total global oil consumption at that time (U.S. Energy Information Administration, World Oil Transit Chokepoints, July 25, 2017). Current estimates, incorporating subsequent production growth from Gulf producers, place the daily transit figure at between 17 and 21 million barrels per day including LNG flows, with Qatar's liquefied natural gas exports adding a second commodity dimension to any disruption scenario.
The Bab el-Mandeb, located between Yemen and Djibouti at the southern entrance to the Red Sea, carries approximately 9 million barrels per day under normal conditions. Goldman Sachs estimates that roughly 4 million bpd of that volume would be extremely difficult to reroute even under favourable circumstances, representing a structurally inelastic component of global supply. Al Jazeera's analysis of Iran's threat to Bab el-Mandeb underscores just how consequential a closure of this passage would be for world trade.
| Chokepoint | Estimated Daily Flow | Primary Destinations | Rerouting Feasibility |
|---|---|---|---|
| Strait of Hormuz | 17-21 million bpd (oil + LNG) | Asia, Europe, United States | Extremely limited; no viable alternative route |
| Bab el-Mandeb | ~9 million bpd | Europe via Suez, East Africa | Partial; Cape rerouting adds 10-14 days |
| Combined Disruption Risk | ~25-30% of global seaborne oil | All major importing regions | Critically constrained |
Why the Cape of Good Hope Cannot Absorb the Volume
A common assumption in mainstream coverage is that rerouting around Africa's southern tip provides a workable fallback. However, the numbers do not support this conclusion at any meaningful scale.
Rerouting a supertanker around the Cape of Good Hope adds approximately 10 to 14 additional sailing days per voyage. On a per-voyage basis, this appears manageable. At the scale of global crude trade, the implications are systemic:
- Extended voyage times effectively reduce the productive capacity of the global tanker fleet, creating a supply reduction even without any physical loss of oil
- War risk insurance premiums escalate as tanker operators price in extended exposure to conflict zones
- Crew availability and vessel maintenance schedules become binding constraints when fleet utilisation approaches capacity
- Port congestion at alternative terminals can create secondary bottlenecks as rerouted volume concentrates at fewer facilities
Saudi Aramco's East-West Pipeline, known as Petroline, offers a partial bypass by redirecting some Gulf crude to Red Sea export terminals at Yanbu. However, this pipeline operates with a capacity ceiling well below the full volume of Saudi exports, and critically, if Bab el-Mandeb is simultaneously disrupted, even Yanbu-loaded crude faces the same downstream chokepoint.
The Hormuz Closure Mechanism: How a Partial Shutdown Propagates
Iran's Revolutionary Guards Corps possesses both the geographic proximity and the stated operational capability to restrict or effectively close the Strait of Hormuz. In the current episode, the IRGC declared that tanker traffic through the strait required their coordination following an explosion on a vessel navigating a mined route near Oman's coast, which caused two additional ships to turn back. Concurrently, the United States military conducted its twelfth consecutive night of strikes on Iran, a sustained campaign that materially elevates the probability of Iranian escalation through the strait.
The propagation mechanism of a Hormuz closure through global energy markets follows a predictable but severe sequence:
- Immediate supply shock: Persian Gulf producers lose primary export access overnight, with Saudi Arabia, Iraq, Kuwait, and the UAE most directly affected
- Inventory drawdown pressure: Importing nations begin depleting strategic reserves within days, with Asian refiners facing the steepest initial shortfalls given their heavy dependence on Gulf crude grades
- Benchmark repricing: Brent and WTI reprice rapidly to incorporate the lost volume, with the speed of repricing reflecting the illiquidity of physical alternatives
- Refinery feedstock competition: Asian refiners unable to source alternative grades quickly face either margin compression or production cuts
- LNG market contagion: Qatar's LNG exports, which also transit Hormuz, face simultaneous disruption, spiking gas prices in Europe and Asia independent of oil market dynamics
The strait has never been fully closed in modern commercial history. The 1980s Tanker War during the Iran-Iraq conflict demonstrated how even partial harassment of shipping could generate significant market volatility, but the scale of current global oil dependency is qualitatively different from that period.
The Houthi Naval Campaign and the Transformation of Bab el-Mandeb Risk
How Did the Threat Escalate So Rapidly?
The Bab el-Mandeb was historically treated as a secondary concern relative to Hormuz — a logistical inconvenience rather than a primary supply risk. The Houthi movement's expanding naval campaign has, however, fundamentally altered this assessment.
Initially targeting Israeli-linked shipping, the Houthi campaign broadened its scope to include Saudi oil tankers transiting the strait. Two China-bound supertankers carrying a combined 4 million barrels of Saudi crude were struck while navigating the Bab el-Mandeb, a single attack event that placed the full Goldman Sachs estimate of difficult-to-reroute volume at direct risk within one operational day. The Houthis' sustained access to anti-ship missiles and naval mines creates a persistent threat environment that maritime insurers must price continuously, independent of whether any individual attack succeeds. Time magazine's reporting on these dual strait threats provides critical additional context on the evolving security situation.
The market consequences of this expansion are already visible in crude trade flow data. Chinese refiners, facing reduced access to Saudi Arabian crude, have accelerated purchases of discounted Russian crude despite narrowing price differentials and are reportedly in talks to secure additional Iranian oil. This substitution pattern illustrates a structural dimension of the disruption that outlasts any individual attack: once buyers redirect purchasing relationships, the reestablishment of prior trade flows takes months, not days.
Oil Price Dynamics: Decoding the Risk Premium Embedded in Brent
What Is Driving Current Price Levels?
Understanding current oil price levels requires separating the structural supply-demand balance from the geopolitical risk premium that chokepoint disruption adds on top of it. In addition, the trade war impact on oil markets adds another layer of complexity to an already volatile pricing environment.
Following confirmed Houthi attacks on Saudi tankers, Brent crude rose $4.52, or 4.8%, to $98.59 per barrel, its highest level since early June. WTI gained $3.39, or 3.9%, to $90.22 per barrel, extending a five-session consecutive advance. The Cushing spot price stood at approximately $83.43 per barrel on July 17, meaning WTI gained roughly 8% in under one week — a velocity of price change that reflects genuine supply anxiety rather than speculative positioning alone.
The chokepoint risk premium currently embedded in Brent can be estimated by comparing the post-attack price of approximately $98.59 per barrel against the pre-rally baseline of around $94 per barrel. The resulting $4-5 per barrel gap represents the market's probabilistic pricing of sustained supply disruption. A sustained Brent close near the $94 level would signal that markets are unwinding this premium, implying either a resolution of the chokepoint threat or sufficient alternative supply mobilisation to offset the risk.
Goldman Sachs's scenario framework structures the forward price outlook across three pathways:
| Scenario | Brent Price Trajectory | Key Assumption |
|---|---|---|
| Base Case | Retains most gains through July-August | Inventories decline, SPR releases slow, summer demand firm |
| Bear Case (price) | Retreats toward $94 per barrel | Risk premium removed; disruption resolves |
| Bull Case (price) | Pushes above $98.59 toward prior June highs | Both chokepoints remain disrupted; 4 million bpd flows lost |
The recent oil price rally has further complicated market readings, as analysts attempt to disentangle geopolitical fear from underlying demand signals.
The next major ASX story will hit our subscribers first
The Inventory Buffer Problem: Why the US Entered This Disruption Understocked
One of the less-discussed dimensions of the current disruption is the condition of US commercial crude inventories at the point of onset. Markets absorb supply shocks more easily when physical buffers are full. They absorb them more painfully when those buffers are already depleted.
US commercial crude inventories rose 2.0 million barrels to 411.7 million barrels in the most recent reporting period, a build that sounds constructive in isolation. However, inventories remain approximately 6% below the five-year seasonal average, meaning the US entered this disruption period with a structurally thinner buffer than historical norms. This deficit matters because it compresses the time window available for diplomatic or military resolution before physical supply constraints begin affecting refinery operations and fuel availability.
Compounding this, US crude imports averaged 5.6 million barrels per day over the most recent four-week period, running 11.4% below the equivalent period in the prior year. Lower import volumes reduce the US's capacity to offset Middle East supply losses through import substitution, narrowing the policy toolkit available to stabilise prices.
The Strategic Petroleum Reserve, deployed extensively during 2022's energy crisis, was drawn down to multi-decade lows during that period. Slower SPR release rates in the current episode reflect both the reduced reserve base available for deployment and the political constraints on committing a finite emergency resource to what may become a prolonged disruption. Goldman Sachs's base case explicitly incorporates slowing SPR releases as a price-supportive factor through August.
Record Diesel Margins and the Mining Industry Cost Transmission
The pathway from crude oil prices to mine site operating costs runs through the diesel market, and that pathway is currently operating under extreme stress. European diesel margins reached a record $66.25 per barrel on July 17, while US retail diesel prices climbed to $5.134 per gallon by July 20, representing a $1.322 per gallon increase year-on-year and a $0.338 per gallon gain week-on-week.
For diesel-intensive industries, particularly open-pit mining, these figures translate directly into margin compression. The transmission mechanism from crude to retail diesel typically involves a lag of several weeks, meaning further diesel price increases are likely even if crude stabilises at current levels.
| Mining Cost Category | Diesel Price Impact | Exposure Level |
|---|---|---|
| Open-pit haul fleet fuel | Direct; proportional to diesel price | Very High |
| Off-grid power generation | Direct; no grid alternative | Very High |
| Processing plant energy | Partial; some grid-connected operations | Moderate |
| Logistics and transport | Indirect; freight cost pass-through | Moderate to High |
Higher-cost mining operations face the greatest margin compression because fuel represents a largely fixed operating cost that cannot be easily reduced in response to short-term price movements. Unlike some input costs that can be hedged or substituted, diesel consumption at remote mine sites is structurally inelastic. Operations dependent on diesel haul fleets for ore movement and diesel generators for power have no near-term alternative regardless of the price level.
The broader industrial exposure extends well beyond mining. Agricultural operations, long-haul freight carriers, maritime shipping companies, and airlines all face elevated fuel cost pressures through the same crude-to-product transmission channel. Diesel-dependent power generation in emerging markets faces direct energy cost inflation with limited ability to pass costs through to regulated end-users.
Three Scenarios for Resolution: Probability, Price, and Structural Consequences
Scenario 1: Partial Resolution
One chokepoint reopens under negotiated or militarily enforced arrangements. Brent retreats toward the $94 per barrel pre-disruption baseline as the risk premium partially unwinds. Diesel prices begin a lagged decline over four to six weeks. Rerouting inefficiencies persist, maintaining a residual freight cost premium that takes months to fully normalise.
Scenario 2: Status Quo Persistence
Both chokepoints remain under threat but not fully closed, with partial flows continuing under elevated risk conditions. Brent holds in the $94 to $100 per barrel range, sustained by inventory drawdowns and firm summer demand. Diesel margins remain elevated. Chinese refiners continue consolidating their shift toward Russian and Iranian crude, accelerating a structural realignment of global trade flows that may prove difficult to reverse even after the immediate security situation improves.
Scenario 3: Full Dual Closure
Both the Strait of Hormuz and Bab el-Mandeb are effectively closed to commercial tanker traffic. Approximately 25 to 30% of global seaborne oil trade is disrupted simultaneously — a scenario with no modern precedent. Brent pushes above $100 per barrel with material upside risk toward prior cycle highs. Insurance markets, war risk premiums, and tanker availability become binding constraints independent of crude prices themselves. Strategic reserve releases accelerate globally but face capacity limitations given already-depleted SPR levels.
The Four Indicators That Will Determine the Next Price Move
Consequently, for investors and industry participants monitoring this situation, four data points carry the highest forward-looking signal value:
- EIA Weekly Petroleum Status Report (published every Wednesday): tracks whether the 6% inventory deficit versus the five-year average widens or narrows; a widening deficit alongside sustained Brent above $98.59 per barrel would confirm that physical supply constraints are deepening beyond the initial disruption shock
- Brent price relative to $94 per barrel: the pre-disruption baseline; a sustained close above this level confirms the risk premium remains priced in and that markets do not believe resolution is imminent
- US retail diesel prices relative to $5.134 per gallon: the primary cost transmission indicator for diesel-intensive industries; continued increases above this level signal further margin compression for mining and industrial operators
- Real-time tanker traffic data through both straits: shipping monitoring services provide the earliest available signal of disruption resolution or escalation, ahead of both price moves and official announcements
Furthermore, geopolitical trade tensions across the broader region will continue to influence how quickly — or slowly — any resolution materialises. In addition, OPEC's market influence over production decisions will remain a critical variable as the cartel weighs its response to the evolving supply disruption.
Even if both chokepoints reopen, the structural consequences of this episode will take considerably longer to unwind. Insurance markets and war risk premium frameworks will require months to normalise. The reestablishment of prior crude trade flows between Middle Eastern producers and Asian refiners, once disrupted by Chinese buyers' accelerated shift toward Russian and Iranian supply, is not automatic. And the demonstrated simultaneous vulnerability of both strategic passages will almost certainly accelerate investment in strategic reserve capacity and alternative pipeline infrastructure across multiple importing nations, reshaping the medium-term energy security investment landscape in ways that extend well beyond the current crisis window.
This article is intended for informational purposes only and does not constitute financial advice. All price figures, inventory data, and flow estimates referenced are drawn from publicly available sources including the U.S. Energy Information Administration and market analysis published by Goldman Sachs. Readers should conduct their own due diligence before making any investment decisions. Oil market scenarios involve forecasts and inherent uncertainty; actual outcomes may differ materially from those described.
Want to Stay Ahead of Commodity Market Shifts Driven by Global Supply Disruptions?
When geopolitical shocks ripple through energy markets and into commodity costs, identifying actionable investment opportunities requires real-time intelligence — Discovery Alert's proprietary Discovery IQ model instantly scans ASX announcements to surface significant mineral discoveries before the broader market reacts, with historic returns from major discoveries showcased on the Discovery Alert discoveries page. Start your 14-day free trial at Discovery Alert and position yourself ahead of the next major market-moving event.