July 28, 2026
Why the World's Most Critical Waterway Holds Oil Markets Hostage
Roughly every fifth barrel of oil consumed on the planet passes through a channel barely wide enough for two lanes of tanker traffic. The Strait of Hormuz, connecting the Persian Gulf to the Gulf of Oman, represents the single most consequential pressure point in global energy infrastructure. Unlike pipeline networks, refinery capacity, or even sovereign production decisions, this geographic bottleneck cannot be engineered around, politically substituted, or technologically bypassed at meaningful scale. Understanding how a Strait of Hormuz blockade and oil prices interact requires examining not just the waterway itself, but the entire architecture of global energy dependency that has been constructed around it over decades.
When big ASX news breaks, our subscribers know first
The Arithmetic of Dependency: How Much Oil Actually Flows Through Hormuz?
The numbers define the stakes. Under normal operating conditions, approximately 17 to 21 million barrels per day transit the Strait of Hormuz, representing close to one-fifth of global oil supply and a substantial proportion of worldwide liquefied natural gas exports. The primary exporters dependent on uninterrupted Hormuz access include Saudi Arabia, Iraq, Kuwait, the UAE, Iran, and Qatar. Qatar's exposure is particularly acute given that its global LNG supply corridor runs through the same narrow channel, making any disruption a simultaneous crude oil and natural gas shock rather than a single-commodity event.
The navigable shipping lane is only 2 to 3 nautical miles wide in each direction, with shallow water and maritime exclusion zones constraining vessel routing on both sides. This physical constraint is what makes Hormuz structurally irreplaceable rather than merely strategically important.
| Exporting Nation | Estimated Daily Transit Volume | Primary Commodity |
|---|---|---|
| Saudi Arabia | ~7 million b/d | Crude oil |
| Iraq | ~3.5 million b/d | Crude oil |
| UAE | ~2.5 million b/d | Crude oil + LNG |
| Kuwait | ~2 million b/d | Crude oil |
| Qatar | ~1.5 million b/d | LNG primary |
| Iran | ~1.5 million b/d | Crude oil |
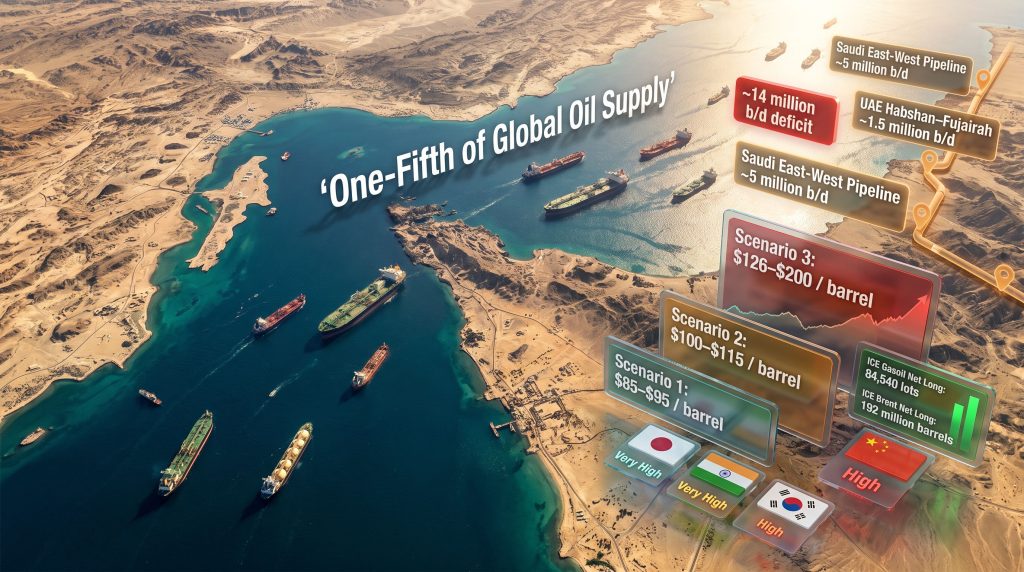
Existing bypass infrastructure offers only partial relief. Saudi Arabia's East-West Petroline carries approximately 5 million b/d, while the UAE's Habshan-Fujairah pipeline adds roughly 1.5 million b/d of additional diversion capacity. Combined, these alternatives represent around 6 to 6.5 million b/d of bypass throughput against a normal transit volume exceeding 20 million b/d. The structural deficit of more than 14 million barrels per day confirms that no combination of pipeline alternatives can substitute for maritime transit at anything approaching normal scale.
Critical structural insight: A Hormuz disruption is categorically different from most commodity supply shocks because it cannot be rerouted. It must be resolved. This makes it uniquely capable of generating sustained rather than transient price responses.
How a Strait of Hormuz Blockade Transmits Into Oil Prices: The Mechanism Explained
Futures Markets Price Anticipated Scarcity Before Tankers Stop Moving
The first and fastest channel through which a Strait of Hormuz blockade affects oil prices operates through futures markets, not physical cargo movements. Institutional traders reprice anticipated scarcity the moment disruption risk becomes credible, meaning that oil price movements precede actual supply shortfalls by days or even weeks.
A structurally important but underappreciated dynamic is currently amplifying this effect. Open interest in ICE Brent futures is running approximately 11% below year-over-year levels, meaning that price swings of equal speculative force now occur across a thinner pool of contracts. Lower liquidity does not reduce volatility; it magnifies it. This is why single-session moves of around 9.5% have occurred during 2026 escalation events despite no actual change in physical cargo flows at the moment of pricing.
A further distinction matters for investors: WTI futures require physical delivery at Cushing, Oklahoma, while ICE Brent is settled through paper contracts referencing North Sea crude. During geopolitical crises, speculative capital gravitates toward non-physical instruments. This helps explain why hedge fund positioning in ICE Brent has been far more reactive than equivalent positioning in Nymex WTI during the current disruption period.
The Secondary Cascade: Refined Products and LNG Follow Crude
Crude price shocks do not stop at the wellhead. Within days, elevated crude input costs transmit into diesel, gasoline, and jet fuel markets. Diesel is frequently the most exposed refined product in supply disruption scenarios because it serves as the backbone of freight, logistics, and industrial activity. Jet fuel follows closely, with direct consequences for airline sector profitability.
The LNG dimension adds a second layer of complexity unique to Hormuz compared to other chokepoints. Qatar, the world's largest LNG exporter, routes virtually all of its export volumes through the strait. Furthermore, when Hormuz faces disruption simultaneously with the Bab el-Mandeb strait at the southern end of the Red Sea, both primary and secondary LNG export corridors face pressure, compressing global gas supply at a time when alternatives are limited. According to reporting by Al Jazeera, Iranian strikes have already threatened the strait's reopening, underscoring the severity of the situation.
Speculative Positioning as a Real-Time Sentiment Indicator
Hedge fund and money manager positioning in derivatives markets provides one of the most useful real-time gauges of institutional sentiment during geopolitical crises. As of late July 2026, net long positions held by money managers in ICE Brent futures and options had rebounded to the equivalent of more than 192 million barrels, a two-month high, following a significant sell-off triggered by the US-Iran Memorandum of Understanding earlier in the month.
Perhaps more telling is the diesel market. Net long positions in ICE gasoil, the primary derivatives benchmark for European diesel, reached 84,540 lots, exceeding levels recorded at any point during the active conflict period. This signals that institutional traders believe diesel tightness will outlast whatever diplomatic progress occurs in crude oil markets.
Market psychology insight: Diesel positioning often leads crude in geopolitical crises because institutional traders recognise that refined product markets clear faster and tighter than crude benchmarks when physical supply chains are stressed. Gasoil positioning above conflict-period peaks is a structurally bearish signal for energy-intensive industries.
Three Scenarios: Mapping the Strait of Hormuz Blockade and Oil Price Trajectories
Scenario 1: Brief Disruption (1 to 2 Weeks)
A diplomatic resolution achieved within one to two weeks would likely produce a sharp initial price spike followed by a significant retracement. Historical precedent from short-duration Gulf tension events suggests that 50 to 70% of the initial move is typically retraced within five to seven trading sessions once de-escalation language becomes credible.
- Initial Brent spike: 9 to 12% in the first trading session
- Post-resolution Brent range: $85 to $95 per barrel
- Key variable: Speed and credibility of diplomatic signalling
- Speculative positioning: Rapid profit-taking among long holders compresses the premium quickly
- Physical market impact: Minimal, as most cargoes in transit complete their voyages before full market pricing adjusts
Scenario 2: Partial Disruption (2 to 6 Weeks)
A scenario in which some shipping resumes via alternative routes while full normalisation is delayed introduces a different price dynamic. Rerouting cost premiums, insurance surcharges, and demurrage costs begin to accumulate in refined product prices, and the IEA's coordinated Strategic Petroleum Reserve release mechanism is likely activated.
- Sustained Brent range: $100 to $115 per barrel
- Diesel and jet fuel premiums: Widen materially as refinery input costs rise
- Demand destruction onset: Import-dependent Asian economies begin emergency procurement from Angola, Venezuela, and non-Gulf African producers
- OPEC+ response: Pause on planned output increases becomes more likely as quota negotiations grow contentious
- India's dual exposure: Higher crude input costs compress refining margins even as refined product export volumes remain elevated
Scenario 3: Sustained Full Closure (6 or More Weeks)
This is the scenario that energy security planners treat as a systemic stress test rather than a base case. A full commercial shipping suspension lasting six weeks or more, potentially requiring mine clearance operations before vessels can safely transit, places Brent crude on a trajectory well above the $126 per barrel peak observed during the 2026 crisis. Consequently, extreme scenario modelling places potential ceilings between $150 and $200 per barrel.
The cascading economic consequences become severe at this duration:
- Inflationary shocks across all oil-importing economies, with particular severity in Asia
- GDP growth forecast downgrades in India, South Korea, Japan, and Taiwan
- Airline sector profitability collapses as jet fuel costs surge beyond hedging protection
- Technology sector capital expenditure faces energy cost headwinds, with an estimated $725 billion in planned AI infrastructure investment exposed to elevated power cost assumptions
- Consumer spending compression in major economies as fuel costs absorb a larger share of household budgets
Scenario ceiling note: The $200 per barrel scenario requires not only sustained Hormuz closure but simultaneous pressure on Bab el-Mandeb, Black Sea export terminals, and North African production. All three of these secondary disruption vectors are currently active, making the multi-vector supply shock scenario less theoretical than at any prior point in modern energy history.
Multi-Vector Supply Disruption: The Compounding Factors That Make 2026 Structurally Different
The current disruption environment is distinguished from prior episodes by the simultaneous activation of multiple supply vectors, each individually manageable but collectively capable of sustaining elevated price floors. Indeed, the scale of oil market disruption seen in 2026 reflects a confluence of geopolitical pressures rarely observed in modern energy markets.
Active disruption vectors as of mid-2026:
- Strait of Hormuz blockade affecting primary Gulf export corridor
- Bab el-Mandeb pressure from Houthi activity suppressing Red Sea tanker traffic to multi-month lows
- Kazakhstan's CPC Terminal suspension following drone attacks, reducing Kazakh output from 2.16 million b/d to approximately 1 million b/d
- Saudi Aramco's 400,000 b/d Jazan refinery struck by Houthi missiles, with storage tank fires burning for three days
- Libya's 90,000 b/d El Feel field halted after demonstrators stormed production sites
- Russia's gasoline export ban extended through end-2026 due to Ukrainian drone attacks on refinery infrastructure
| Disruption Event | Volume Impact | Recovery Timeline |
|---|---|---|
| Hormuz blockade (commercial vessels) | Up to 20 million b/d at risk | Weeks to months |
| CPC Terminal suspension | 1.16 million b/d lost | Resuming as of late July 2026 |
| Jazan refinery attack | 400,000 b/d refining capacity | Weeks for damage assessment |
| El Feel field halt | 90,000 b/d | Days (government forces regained control) |
| Russia gasoline export ban | Regional supply tightness | Until end-2026 minimum |
The Diplomatic Architecture: Oman's Voluntary Fee Framework
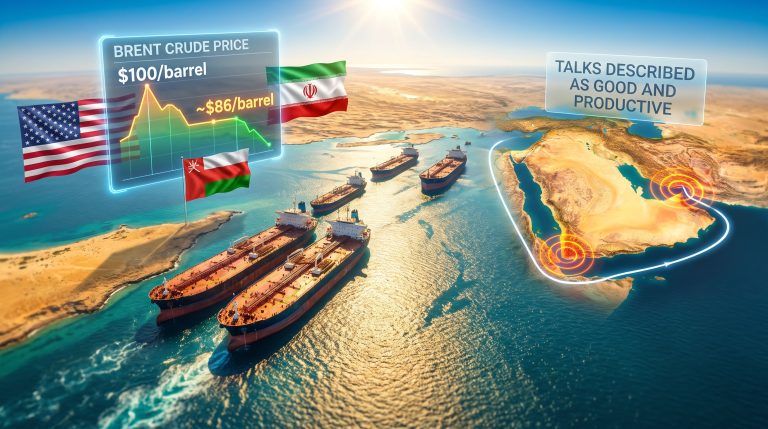
The most consequential diplomatic development currently underway involves Omani negotiators presenting Iranian officials with a Hormuz navigation framework modelled explicitly on the Strait of Malacca governance model. Under this proposal, voluntary transit fees paid by commercial vessels would be directed toward environmental protection and maritime safety, effectively positioning Iran as a fee-collecting sovereign authority rather than a blocking power.
The Malacca precedent is instructive. That waterway, shared among Indonesia, Malaysia, and Singapore, is governed by a framework that has successfully maintained commercial shipping despite periodic tensions between littoral states. The key mechanism is that voluntary fees do not require a formal treaty ratification, potentially giving Iran a face-saving pathway to revenue recognition without the legal complexity of a binding international agreement.
Separately, Iranian and Omani negotiators have focused discussions on reopening the strait's largely unused middle passage, a routing option that would separate commercial traffic from the zones most heavily affected by the current standoff. A critical operational obstacle remains: Iranian sea mines that may need to be cleared before commercial vessels can transit safely. Mine clearance in contested waters is a technically demanding and diplomatically sensitive undertaking with no guaranteed timeline. Yahoo Finance has reported that the US is also preparing to reinstate a Hormuz blockade charge on all cargo shipped through the strait, adding further complexity to negotiations.
The next major ASX story will hit our subscribers first
Which Economies Face the Greatest Exposure
| Economy | Oil Import Dependency | Hormuz Route Exposure | Active Diversification |
|---|---|---|---|
| Japan | Very High | Very High | Pipeline investment abroad; strategic reserve drawdown |
| South Korea | Very High | Very High | Limited alternatives |
| India | High | High | Active procurement from Angola and Venezuela |
| China | High | High | Russian flows up approximately 10% |
| Taiwan | High | High | LNG complications adding supply risk |
| European Union | Moderate | Low to Moderate | Non-Gulf alternatives more accessible |
India's exposure deserves particular attention. Indian refiners have moved beyond temporary diversification measures, with at least one major refinery formally barring suppliers from using Hormuz and Red Sea routing. This represents a structural procurement shift with long-term consequences for Middle Eastern crude export pricing and flow patterns. Simultaneously, economists have already revised India's GDP growth forecasts downward in response to the oil price shock, reflecting the dual pressure of higher crude input costs and compressed refining margins.
China's recovery trajectory is also significant. Seaborne crude arrivals into China are projected to reach 7.8 million b/d in July 2026, recovering from a decade-low of 6.2 million b/d the prior month as stranded Gulf cargoes finally complete delivery and Russian crude flows climb approximately 10%. However, constrained domestic consumption limits the demand-side amplification effect that would otherwise add further upward pressure to global benchmarks.
The OPEC+ Supply Pause and Its Price Floor Implications
The seven-member OPEC+ group is widely expected to halt gradual output increases after September 2026, maintaining production steady through the remainder of the year. OPEC's market influence remains a central factor in determining how much of the supply gap can realistically be filled. This decision reflects the difficulty of managing quota negotiations for 2027 against a backdrop of structural market uncertainty rather than any coordinated response to the blockade itself.
The strategic implication is significant. OPEC+ pausing output increases removes one of the primary downward price pressure mechanisms that would otherwise partially offset supply disruption. Furthermore, even if diplomatic progress on Hormuz advances, the absence of additional OPEC+ barrels means the price floor remains structurally elevated compared to prior disruption recovery periods when producers could accelerate output to help refill the market. The broader context of trade and geopolitics continues to shape how quickly any resolution might translate into meaningful price relief.
Frequently Asked Questions: Strait of Hormuz Blockade and Oil Prices
What happens to oil prices if the Strait of Hormuz is blocked?
Oil futures markets react before physical cargo flows change. Brent crude typically spikes 9 to 12% in a single session on credible disruption news. The current Strait of Hormuz blockade and oil prices dynamic has pushed Brent above $100 per barrel, with extreme scenario modelling placing potential ceilings between $150 and $200 per barrel if closure extends beyond several weeks.
How much oil passes through the Strait of Hormuz?
Approximately one-fifth of global oil supply, representing 17 to 21 million barrels per day under normal conditions, transits the strait alongside a substantial proportion of global LNG exports.
Can pipeline alternatives replace Hormuz capacity during a blockade?
No. The combined capacity of Saudi Arabia's East-West Petroline and the UAE's Habshan-Fujairah pipeline reaches approximately 6 to 6.5 million b/d, leaving a structural gap of more than 14 million b/d against normal Hormuz throughput.
What is the Oman voluntary fee proposal for Hormuz?
Omani negotiators have presented a framework modelled on Strait of Malacca governance, under which Iran would collect voluntary transit fees directed toward environmental protection. The design gives Iran sovereign recognition without requiring formal treaty ratification, offering a potential face-saving resolution mechanism for both parties.
Which countries are most vulnerable to a sustained Hormuz blockade?
Japan, South Korea, India, China, and Taiwan face the highest structural exposure due to heavy reliance on Middle Eastern crude imports routed through the strait. European economies face lower direct exposure but remain affected through LNG market disruption and global price contagion effects.
Disclaimer: This article is for informational purposes only and does not constitute financial advice. Scenario price projections involve significant uncertainty and should not be relied upon as forecasts. Energy market conditions can change rapidly, and past price behaviour during disruption events may not be indicative of future outcomes.
Want to Stay Ahead of ASX Opportunities Emerging From Global Energy Disruptions?
When geopolitical shocks like a Strait of Hormuz blockade reshape commodity markets, the ripple effects create significant opportunities across ASX-listed energy and resources stocks — and Discovery Alert's proprietary Discovery IQ model delivers real-time alerts the moment significant mineral and resource discoveries hit the ASX, ensuring subscribers can act decisively before the broader market catches on. Explore how major discoveries have historically generated substantial returns and begin your 14-day free trial today to position yourself ahead of the next market-moving event.