
June 29, 2026
Global energy markets face unprecedented vulnerability through maritime chokepoints that control the flow of essential resources worldwide. These narrow waterways represent critical infrastructure where geopolitical tensions can instantly transform into economic shockwaves affecting billions of consumers and entire industrial sectors. Understanding how transit disruptions cascade through interconnected systems reveals the fragility underlying modern energy security frameworks, particularly when examining scenarios involving the Strait of Hormuz closure.
Geographic Bottlenecks in Energy Transportation Networks
The world's energy transportation system relies heavily on narrow maritime passages where geographic constraints create natural vulnerability points. These strategic waterways facilitate massive volumes of crude oil and liquefied natural gas shipments that power industrial economies across multiple continents.
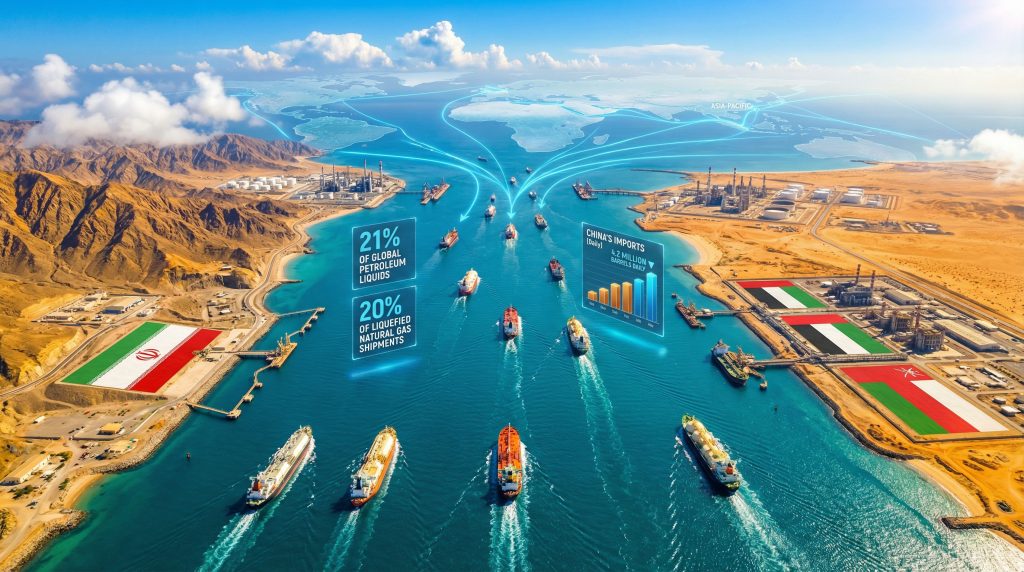
The Strait of Hormuz represents the most critical energy transit corridor globally, handling approximately 21% of petroleum liquids and 20% of LNG shipments worldwide. This narrow passage spans just 33 kilometers at its widest navigable point, creating an inherent chokepoint where any disruption can affect global energy flows.
Persian Gulf producers including Saudi Arabia, Iraq, Kuwait, Qatar, and the UAE depend on this waterway as their primary export route to international markets. The concentration of production sources through a single transit point creates systematic risk that extends far beyond regional boundaries.
Maritime Infrastructure Constraints
International Maritime Organization regulations designate two shipping lanes within the strait, each approximately 2 kilometers wide, separated by a 2-kilometer buffer zone. This narrow corridor means any maritime obstruction through military action, vessel positioning, or underwater obstacles can effectively restrict or prevent normal transit operations.
The waterway connects the Persian Gulf to the Gulf of Oman, representing the sole maritime outlet for five major energy-producing nations. This geographic reality creates asymmetric leverage where transit control can impact global energy prices regardless of actual production capacity.
When big ASX news breaks, our subscribers know first
Immediate Price Volatility and Market Disruption Patterns
Energy market responses to transit disruptions follow predictable patterns based on historical precedent and current market structure. Understanding these mechanisms helps investors and policymakers anticipate cascading effects across multiple asset classes and economic sectors, particularly when considering potential oil price rally analysis.
Crude Oil Price Shock Dynamics
Market analysis indicates that Strait of Hormuz closure scenarios could trigger:
- 40-60% price increases within 48 hours of confirmed disruption
- Regional price differentials favoring Atlantic Basin crude varieties
- Forward curve steepening as markets price in extended disruption scenarios
- Refinery margin compression due to feedstock cost volatility
Recent geopolitical tensions have demonstrated how quickly energy markets respond to perceived supply threats. Analysis of market behavior during crisis periods reveals that political signalling can trigger immediate price reversals even when underlying physical conditions remain unchanged.
Financial Market Transmission Mechanisms
Table: Energy Crisis Impact Scenarios
| Asset Class | 24-Hour Response | 1-Week Impact | 1-Month Sustained |
|---|---|---|---|
| WTI Crude | +25% to +40% | +45% to +70% | +30% to +50% |
| Brent Crude | +30% to +45% | +50% to +75% | +35% to +55% |
| Natural Gas | +15% to +25% | +30% to +50% | +20% to +35% |
| USD Index | +2% to +3% | +4% to +6% | +3% to +5% |
| Gold | +3% to +5% | +8% to +12% | +5% to +8% |
Energy price shocks transmit through financial systems via multiple interconnected channels:
- Futures market volatility driving margin pressure and forced liquidations
- Credit spread widening for energy sector debt instruments
- Currency market dynamics strengthening USD through commodity pricing mechanisms
- Equity index reversion based on geopolitical risk perception changes
Historical analysis reveals that markets often react to verbal declarations and political signalling before actual physical supply changes occur. This creates opportunities for significant price volatility driven by sentiment shifts rather than fundamental supply-demand imbalances.
Regional Vulnerability Assessment and Strategic Dependencies
Different regions face varying degrees of exposure to energy transit disruptions based on their import dependency, alternative supply access, and strategic reserve capacity. Asian economies demonstrate the highest vulnerability due to geographic distance from alternative suppliers and limited pipeline infrastructure.
Asia-Pacific Energy Security Challenges
China's energy import profile creates significant vulnerability:
- 40% of crude imports transit through Persian Gulf shipping lanes
- 4.2 million barrels daily represent critical supply volumes
- Limited pipeline alternatives from Russia and Central Asia operate below capacity
- Refining sector integration requires specific crude oil grades from Gulf producers
Japan faces acute energy security risks through:
- 85% overall energy import dependency across all fuel types
- 2.4 million barrels daily crude oil imports, with 70-75% from Middle Eastern sources
- Limited strategic petroleum reserves relative to consumption patterns
- Nuclear capacity constraints following Fukushima safety protocols
South Korea's manufacturing sector vulnerability includes:
- 2.5-2.7 million barrels daily crude imports, 70-80% from Persian Gulf region
- Petrochemical industry integration requiring consistent feedstock supplies
- Refining capacity utilisation tightly linked to export-oriented manufacturing
European Energy Diversification Status
While Europe maintains greater supply diversification compared to Asia, LNG imports from Qatar and crude oil from Iraq and Kuwait create secondary exposure channels requiring immediate alternative sourcing during crisis periods.
European strategic response capabilities include:
- Enhanced pipeline capacity from Norway, Russia, and North Africa
- LNG import terminal expansion providing supply flexibility
- Strategic petroleum reserve coordination through IEA mechanisms
- Renewable energy acceleration reducing fossil fuel dependency over time
Furthermore, the impacts on regional economies extend beyond immediate energy supply concerns, with trade war oil markets interactions creating additional complexity during crisis periods.
Alternative Supply Route Analysis and Capacity Constraints
Understanding bypass capacity limitations reveals why maritime chokepoint closures create sustained market disruption rather than temporary price spikes. Existing pipeline infrastructure cannot fully compensate for lost waterway capacity under normal operational scenarios.
Pipeline Bypass Infrastructure Assessment
Current alternative route capacity includes:
- East-West Pipeline (Saudi Arabia): 5 million bpd theoretical capacity, currently underutilised
- Petroline (Saudi Arabia): 4.8 million bpd maximum throughput to Red Sea terminals
- Iraq-Turkey Pipeline: 1.65 million bpd operational capacity when security permits
- Combined bypass capacity: ~11.5 million bpd versus 21 million bpd normal Hormuz flow
Critical infrastructure limitations:
Pipeline alternatives can provide approximately 55% compensation for lost Hormuz capacity under optimal conditions, but require 6-12 months for full utilisation optimisation.
Strategic Petroleum Reserve Deployment Mechanisms
Global emergency response systems include:
- IEA coordinated releases: 1.5 billion barrel collective member capacity
- US Strategic Petroleum Reserve: 714 million barrels representing 90-day import coverage
- China strategic reserves: 550+ million barrels estimated government holdings
- Release timeline constraints: 30-45 days for maximum market impact achievement
Table: Strategic Reserve Response Capacity
| Country/Region | Reserve Volume (Million Barrels) | Days of Import Coverage | Release Rate (Million bpd) |
|---|---|---|---|
| United States | 714 | 90 | 4.4 |
| China | 550* | 60 | 2.1 |
| Japan | 324 | 133 | 1.8 |
| Germany | 267 | 117 | 1.2 |
| South Korea | 96 | 86 | 0.9 |
*Estimated figures based on government statements and industry analysis
Geopolitical Dynamics Shaping Crisis Scenarios
Recent leadership changes in Iran have introduced new variables affecting conflict escalation and resolution probability. Understanding these political dynamics helps assess the likelihood and duration of potential transit disruptions.
Iranian Leadership Transition Impact
The installation of Mojtaba Khamenei as Iran's Supreme Leader following his predecessor's death represents a significant shift toward more hardline policies. This leadership change affects the Strait of Hormuz closure scenarios through:
- Reduced diplomatic flexibility in international negotiations
- Enhanced IRGC influence over maritime security decisions
- Escalated regional proxy activities across Persian Gulf territories
- Decreased compromise probability during crisis de-escalation efforts
Historical Precedent Analysis
Previous Strait closure threats typically emerged during:
- International sanctions escalation periods targeting Iranian oil exports
- Regional military conflict intensification involving proxy forces
- Nuclear negotiation leverage enhancement strategies
- Domestic political pressure requiring external threat deflection
Military intervention precedents include:
- Operation Earnest Will (1987-1988): US Navy convoy protection maintaining 75% normal transit levels
- Tanker War period: Insurance premium increases from 0.5% to 5-6% of cargo value
- Multi-national naval coalitions: Complex rules of engagement in territorial waters
- Escalation management protocols: Diplomatic frameworks for crisis containment
According to analysis from strategic experts, even Beijing recognises the critical importance of maintaining open passage through this vital waterway.
Long-Term Energy Infrastructure Transformation
Sustained transit disruptions accelerate structural changes in global energy systems as nations prioritise supply security over cost optimisation. These shifts create permanent alterations to trade flows and investment patterns extending beyond immediate crisis resolution.
Strategic Infrastructure Development Priorities
Projects likely to receive accelerated development include:
- Trans-Arabian Pipeline expansion connecting Saudi production to Red Sea export terminals
- Oman-UAE pipeline development creating alternative Gulf export routes
- Enhanced East African terminals reducing Middle Eastern supply dependency
- Arctic shipping route investment providing seasonal alternative pathways
Market Structure Evolution Patterns
Fundamental changes in energy trade relationships:
- Supply chain regionalisation reducing Asia-Middle East energy interdependence
- Renewable energy adoption acceleration driven by security rather than environmental concerns
- Strategic reserve expansion enhancing national energy security buffer capacity
- Alternative supplier strengthening prioritising US shale, Norwegian offshore, Brazilian pre-salt development
In addition to oil market transformations, these changes also affect US natural gas forecast patterns and broader energy market dynamics.
The next major ASX story will hit our subscribers first
Economic Impact Modelling and Recession Risk Assessment
Sustained energy price elevation creates macroeconomic pressures that can trigger recession across energy-importing regions. Understanding transmission mechanisms helps policymakers and investors prepare for broader economic consequences.
Regional GDP Impact Projections
Table: Estimated Economic Impact by Disruption Duration
| Region | Mild Disruption (30 days) | Extended Closure (90 days) | Prolonged Crisis (180+ days) |
|---|---|---|---|
| Asia-Pacific | -0.3% to -0.7% | -1.2% to -2.1% | -2.8% to -4.2% |
| Europe | -0.2% to -0.4% | -0.8% to -1.3% | -1.9% to -2.8% |
| North America | -0.1% to -0.3% | -0.5% to -0.9% | -1.2% to -1.8% |
Inflation Transmission Mechanisms
Energy cost increases propagate through multiple economic channels:
- Direct energy cost pass-through: 2-4% consumer price index increase within 60 days
- Transportation expense multiplication: Supply chain cost escalation across all sectors
- Manufacturing input pressures: Petrochemical and plastics sector margin compression
- Agricultural commodity effects: Fertiliser and fuel cost increases affecting food prices
Current market conditions suggest oil prices at $84-88 compared to pre-conflict levels near $67, representing a 25-30% elevation that would sustain inflationary pressures even after initial crisis resolution.
These economic pressures contribute to global trade war effects and create complex interactions between geopolitical tensions and economic stability.
Investment Strategy Framework for Energy Crisis Periods
Energy supply disruptions create predictable sector rotation patterns and asset class performance divergences. Understanding these relationships helps investors position portfolios for crisis scenarios while managing downside risk exposure.
Sector Performance Patterns During Supply Shocks
Winners typically include:
- Alternative energy infrastructure companies benefiting from accelerated adoption
- Pipeline and storage operators capturing increased transport margins
- Domestic energy producers outside Persian Gulf region gaining market share
- Defence contractors specialising in maritime security and logistics
Losers generally encompass:
- Energy-intensive manufacturing sectors facing input cost pressure (aluminium, steel, chemicals)
- International shipping and logistics companies experiencing route disruption
- Tourism and discretionary spending declining due to higher transportation costs
- Emerging market currencies dependent on energy imports facing devaluation pressure
Portfolio Hedging Mechanisms
Effective crisis hedging strategies include:
- Direct commodity exposure through energy futures and ETF positioning
- Currency hedging approaches capitalising on USD strength versus energy-importing currencies
- Volatility instruments capturing market uncertainty through options strategies
- Infrastructure investments targeting long-term energy security beneficiaries
Market analysis reveals that equity reversals can occur rapidly based on political signalling rather than fundamental changes. Recent examples show 1.5% declines converting to 0.83% gains within hours following diplomatic communication shifts.
Strategic Reserve Management and Emergency Response Protocols
Understanding how strategic petroleum reserves function during crisis periods reveals both their capabilities and limitations in managing supply disruptions. These systems provide temporary relief but cannot substitute for sustained alternative supply development.
Release Authorisation and Distribution Timelines
Strategic petroleum reserve deployment involves:
- Political authorisation process: Presidential or ministerial approval required
- Physical extraction timeline: 30-45 days for oil to reach market destinations
- Distribution network coordination: Pipeline and refinery capacity constraints
- International coordination mechanisms: IEA member nation synchronised releases
Current global reserve capacity totals approximately 1.5 billion barrels across major consuming nations, representing 60-90 days of normal consumption under emergency drawdown scenarios.
Market Stabilisation Effectiveness
Strategic reserve releases provide market psychology benefits often exceeding their physical supply impact. Announcement of coordinated releases can stabilise prices before actual oil reaches markets, demonstrating the importance of communication strategy during energy crises.
IEA extraordinary meetings to discuss emergency stockpile releases signal coordinated international response, but cannot substitute for sustained alternative supply development when facing prolonged disruptions.
Demand Destruction and Consumption Pattern Changes
Extended periods of elevated energy prices trigger demand destruction through reduced consumption, efficiency improvements, and modal shifts. These behavioural changes can moderate price escalation but create broader economic adjustments.
Consumer Adaptation Mechanisms
Sustained $100+ oil prices typically generate:
- 5-15% reduction in global petroleum consumption within 90-180 days
- Transportation modal shifts toward mass transit and freight rail
- Industrial process optimisation reducing energy intensity per unit output
- Residential heating adjustments affecting natural gas and heating oil demand
Long-Term Behavioural Shifts
Energy security concerns drive permanent changes in consumption patterns extending beyond immediate crisis periods:
- Accelerated electric vehicle adoption reducing petroleum demand growth
- Distributed energy system development decreasing centralised infrastructure dependency
- Industrial nearshoring strategies reducing transportation energy requirements
- Building efficiency improvements lowering heating and cooling energy needs
Countries like Canada are already experiencing these transitions, with Canada energy transition initiatives reflecting broader global patterns of energy system transformation.
Insurance Market Response and Risk Premium Quantification
Maritime insurance markets provide early indicators of perceived transit risk through war risk premium adjustments. These cost increases directly affect energy transportation economics and can persist long after immediate threats subside.
War Risk Premium Historical Analysis
Insurance cost escalation patterns during Persian Gulf tensions:
- Normal conditions: 0.5% of cargo value for standard marine coverage
- Elevated threat periods: 2-3% premium increases within 24 hours
- Active conflict scenarios: 5-6% of cargo value, effectively adding $5-6 per barrel
- Extended crisis periods: Premium stability at elevated levels regardless of daily incident frequency
Lloyd's of London typically establishes benchmark pricing for global marine insurance coverage, with other insurers following their risk assessment frameworks during geopolitical crises.
Recent analysis from The Conversation emphasises why closure scenarios matter significantly to the global economy.
Why Does This Critical Waterway Matter So Much?
Understanding the Strait of Hormuz closure scenarios requires comprehensive analysis of interconnected systems spanning geography, politics, economics, and market psychology. While strategic reserves and alternative supply routes provide partial mitigation, the concentration of global energy flows through narrow chokepoints creates systematic vulnerability that extends far beyond immediate market price effects.
The implications cascade through multiple layers of global economic systems, affecting everything from manufacturing costs to consumer prices. Moreover, the psychological impact on markets often proves as significant as actual supply disruptions, with sentiment-driven volatility creating opportunities and risks for investors.
The Strait of Hormuz closure represents more than a regional security issue – it embodies the fundamental tension between globalised energy systems and geopolitical risk. As nations increasingly prioritise energy security over cost efficiency, we can expect continued evolution toward more diversified and resilient supply chains.
Investment decisions during energy crisis periods should consider both immediate volatility opportunities and long-term structural changes in global energy systems. Past performance and historical precedents provide guidance, but each crisis develops unique characteristics requiring adaptive strategy frameworks.
Ready to Capitalise on Energy Market Volatility?
Discovery Alert's proprietary Discovery IQ model delivers real-time alerts on significant ASX mineral discoveries, helping subscribers identify actionable opportunities during periods of energy market uncertainty and resource sector volatility. Begin your 14-day free trial today to position yourself ahead of market movements and secure your competitive advantage in the mining and energy exploration sectors.