July 15, 2026
The global economy faces unprecedented vulnerability when critical maritime passages experience disruption, with the Strait of Hormuz closure representing one of the most significant threats to international energy security. Furthermore, understanding how such events reshape market dynamics requires examining both immediate supply disruptions and long-term structural adjustments that affect everything from transportation costs to tariff impact on economies across multiple sectors.
Understanding Critical Maritime Chokepoints as Economic Infrastructure
The world's energy infrastructure relies heavily on narrow waterways that concentrate massive volumes of global trade. These geographic bottlenecks represent single points of failure in the international economic system, where relatively small disruptions can trigger disproportionate global consequences.
Geographic Vulnerability Analysis
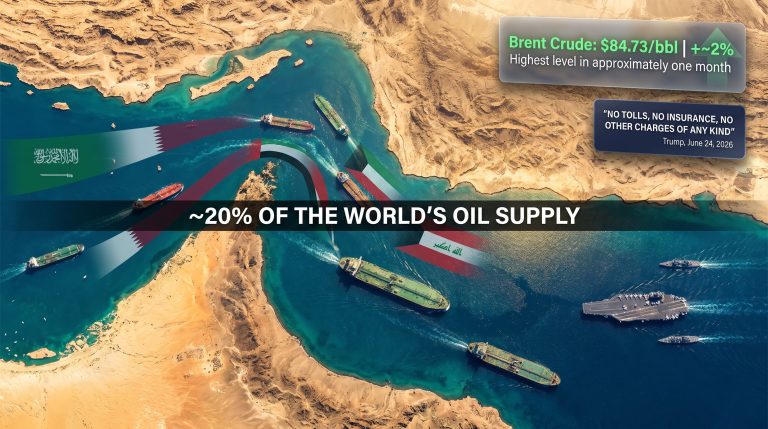
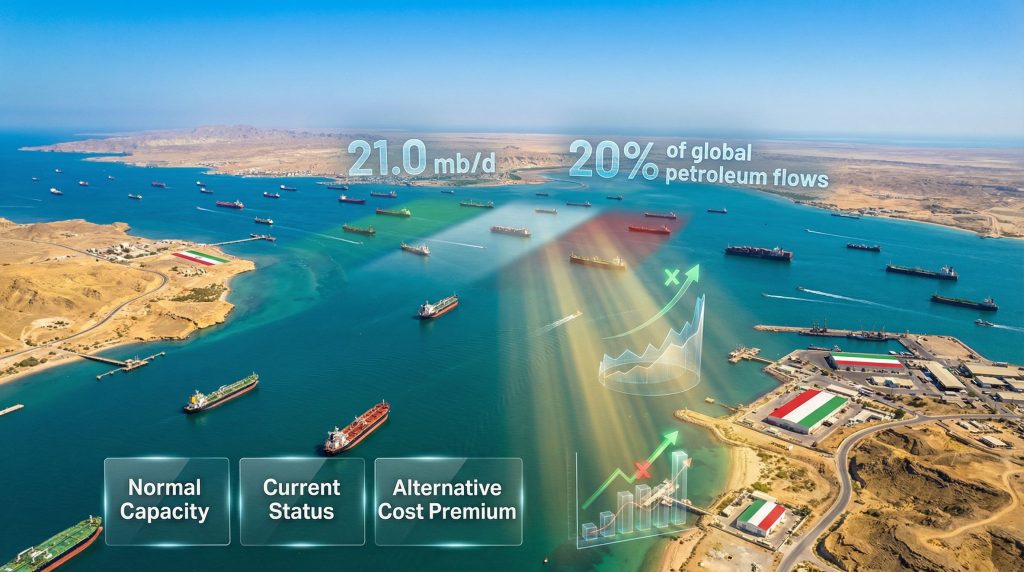
The 21-mile narrow waterway connecting the Persian Gulf to the Arabian Sea normally facilitates approximately 21 million barrels per day of petroleum flows, representing roughly 20% of global oil trade. This concentration creates unprecedented vulnerability when access becomes restricted.
Historical precedents demonstrate how chokepoint disruptions cascade through global markets. The 2021 Ever Given blocking of the Suez Canal, though lasting only six days, disrupted $9.6 billion worth of trade daily and caused shipping delays lasting months. Similarly, the 1980s Tanker War reduced Persian Gulf shipping by over 50% at peak disruption periods.
Alternative Route Capacity Limitations
When primary shipping lanes close, alternative routes face severe capacity constraints. Consequently, markets must adapt to significantly reduced throughput capacity that cannot fully compensate for lost shipping volumes.
Pipeline Infrastructure:
- Saudi East-West Pipeline: 7.0 million barrels per day maximum capacity
- Trans-Arabian Pipeline network: 2.5 million barrels per day combined capacity
- Turkish-Iraqi pipeline systems: 1.6 million barrels per day operational capacity
These alternatives can handle only 40-45% of normal chokepoint throughput, creating immediate supply shortages that markets struggle to absorb through pricing mechanisms alone.
When big ASX news breaks, our subscribers know first
How Supply Chain Economics Transform During Maritime Blockades
Supply chain disruptions during chokepoint closures follow predictable economic patterns, though their magnitude often exceeds historical precedents. Transportation costs multiply exponentially as cargo routes extend by thousands of nautical miles, particularly affecting oil price trade war dynamics.
| Transportation Route | Normal Capacity (mb/d) | Current Operational Status | Cost Premium Per Barrel |
|---|---|---|---|
| Primary Strait Route | 21.0 | Restricted Access | N/A |
| Saudi Pipeline Network | 7.0 | Full Operation | $8-12 |
| Overland Transport Routes | 2.5 | Limited Capacity | $15-20 |
| Alternative Maritime Routes | 4.2 | Congested | $25-35 |
Insurance Premium Multiplication Effects
Maritime insurance markets react immediately to chokepoint closures. War risk premiums surge from baseline rates of $0.05 per $100 of cargo value to crisis levels exceeding $2.50 per $100, representing a 5000% increase in insurance costs alone.
These insurance spikes affect more than just direct shipping costs. Financial institutions adjust lending rates for commodity-dependent businesses, while supply chain financing becomes significantly more expensive across multiple economic sectors.
Regional Refining Capacity Constraints
Refining infrastructure cannot easily substitute for crude oil supply disruptions. Asian refineries, which process 32% of global crude volumes, face immediate feedstock shortages that cannot be resolved through increased utilisation of existing capacity.
Key constraints include:
- Crude quality specifications: Refineries designed for specific petroleum grades cannot easily process alternatives
- Storage limitations: Most facilities maintain only 20-30 days of crude inventory
- Processing bottlenecks: Increasing throughput requires months of operational adjustments
Strategic Reserve Deployment Economics
Government strategic petroleum reserves provide temporary supply buffers, but their deployment follows complex economic calculations. The International Energy Agency coordinates releases from member nations' combined 1.5 billion barrel reserves, but sustained drawdowns face political and economic constraints.
Strategic reserve effectiveness depends on:
- Release rates: Maximum sustainable drawdown of 4.2 million barrels per day globally
- Reserve composition: Different crude grades requiring specific refinery configurations
- Replacement costs: Reserves must eventually be replenished at prevailing market prices
Which Global Markets Face the Greatest Disruption Risk?
Asian economies importing approximately 75% of their petroleum through disrupted chokepoints experience immediate supply shortages, while European and North American markets face secondary effects through refined product shortages and liquefied natural gas disruptions.
Asia-Pacific Vulnerability Assessment
Asian economies demonstrate the highest vulnerability to Strait of Hormuz closure due to their overwhelming dependence on Middle Eastern petroleum imports. China imports 11.2 million barrels daily, with 68% originating from Persian Gulf producers. Japan's 3.1 million barrel daily imports show 72% dependency on the same sources.
Country-Specific Import Dependencies:
- South Korea: 85% of crude imports through affected routes
- India: 62% dependency, representing 4.8 million barrels daily
- Thailand: 71% import dependency, critical for refining operations
- Singapore: 89% throughput dependency as regional trading hub
European Energy Security Implications
European markets face dual vulnerabilities through both crude oil and natural gas disruptions. The region imports 2.8 million barrels daily of crude from affected sources, but liquefied natural gas disruptions create more immediate concerns for industrial operations.
European natural gas imports from the Middle East represent 23% of total consumption, particularly affecting:
- Germany: Industrial heating systems requiring immediate fuel switching
- Italy: Power generation facilities dependent on LNG imports
- Netherlands: Chemical processing operations using gas feedstocks
North American Market Insulation Factors
North American energy markets demonstrate greater resilience due to domestic production capacity, though they remain vulnerable through refined product imports and price transmission mechanisms.
Protective Factors:
- Domestic crude production: 19.4 million barrels daily in the United States
- Strategic reserves: 727 million barrels in emergency storage
- Refining capacity: 18.1 million barrels daily processing capability
- Alternative suppliers: Canadian and Mexican crude sources
However, refined product imports create vulnerabilities, particularly for diesel fuel and jet fuel specifications not easily produced domestically.
Economic Sectors Experiencing Cascading Effects
Transportation, agriculture, petrochemicals, and manufacturing sectors face input cost increases of 15-40% within 30 days of sustained chokepoint closure, with effects varying significantly by geographic region and supply chain structure.
Transportation Fuel Price Transmission
Transportation sectors experience immediate cost pressures as fuel prices adjust to reflect supply constraints. Diesel fuel prices surge most dramatically, affecting trucking, rail transport, and marine shipping operations.
Price Transmission Timeline:
- Days 1-3: Spot market prices increase 25-35%
- Week 1: Retail diesel prices rise 18-25%
- Week 2: Jet fuel surcharges implemented by airlines
- Month 1: Long-term shipping contracts renegotiated with fuel adjustments
Agricultural Input Cost Inflation
Agricultural operations face dual pressures through both direct fuel costs and fertiliser price increases. Ammonia production, requiring natural gas feedstocks, experiences severe cost inflation that transmits quickly to crop production economics.
Critical Agricultural Impacts:
- Fertiliser production costs: Increase 30-45% within two weeks
- Farm equipment operations: Diesel consumption rises 20-25% of operating costs
- Food transportation: Cold chain logistics face significant cost pressures
- Seasonal timing: Disruptions during planting seasons create disproportionate effects
Manufacturing Competitiveness Shifts
Energy-intensive manufacturing sectors face immediate competitiveness challenges as input costs surge. Aluminium production, steel manufacturing, and chemical processing operations experience margin compression that forces production adjustments.
Sector-Specific Responses:
- Aluminium smelting: Production deferrals in high-cost regions
- Chemical manufacturing: Feedstock substitution where technically feasible
- Cement production: Temporary capacity reductions to preserve margins
- Glass manufacturing: Fuel switching to alternative energy sources
Central Bank Monetary Policy Responses to Energy-Driven Inflation
Central banks face complex policy dilemmas when energy price shocks create inflationary pressures. The traditional monetary policy response of raising interest rates becomes problematic when the inflation source represents external supply constraints rather than domestic demand pressures.
Monetary Policy Dilemma Analysis
Energy-driven inflation creates stagflationary pressures that challenge conventional monetary policy frameworks. Central banks must balance inflation control against economic growth support, particularly when energy costs affect both consumer prices and business investment decisions.
Policy Trade-offs:
- Interest rate increases: Risk economic recession while having limited impact on supply-driven inflation
- Accommodative policy: Allows inflation expectations to become entrenched
- Targeted interventions: Currency market operations to stabilise import costs
- Coordinated responses: International central bank cooperation mechanisms
Currency Market Volatility Patterns
Oil-importing nations experience currency depreciation pressures as trade balances deteriorate rapidly. Import-dependent economies face particular challenges as currency weakness compounds energy import costs, especially when considering trade war market impacts on overall economic stability.
Vulnerable Currency Patterns:
- Japanese Yen: Faces pressure due to 95% energy import dependency
- South Korean Won: Industrial economy with high energy intensity
- Turkish Lira: Limited foreign exchange reserves for import financing
- Indian Rupee: Large current account deficit sensitivity to energy costs
Government Fiscal Response Mechanisms
Governments deploy various fiscal tools to mitigate energy cost impacts on consumers and businesses. These interventions range from direct subsidies to tax relief measures, though their effectiveness varies significantly based on implementation design.
Common Fiscal Responses:
- Fuel tax reductions: Immediate price relief but reduced government revenue
- Direct consumer subsidies: Targeted support but significant fiscal costs
- Strategic reserve releases: Temporary supply increase with future replenishment obligations
- Emergency energy assistance: Support for vulnerable populations and businesses
Long-Term Structural Economic Changes
Energy chokepoint disruptions accelerate structural changes in global energy systems that extend far beyond immediate crisis periods. Investment patterns shift dramatically as market participants reassess supply chain vulnerabilities and energy security requirements, influencing broader energy transition strategies.
| Investment Sector | Pre-Crisis Annual Investment | Crisis-Period Change | Long-term Trajectory |
|---|---|---|---|
| Middle East Oil Infrastructure | $45 billion | -60% decline | Gradual recovery over 3-5 years |
| Alternative Energy Projects | $380 billion | +25% acceleration | Permanent increase in baseline |
| Strategic Infrastructure | $12 billion | +200% surge | New higher baseline established |
| Energy Storage Systems | $23 billion | +180% increase | Technology adoption acceleration |
Energy Security Infrastructure Investment
Pipeline diversification projects receive accelerated development timelines as governments prioritise energy supply route redundancy. Strategic storage capacity expansion becomes a national security priority across multiple regions.
Infrastructure Priority Projects:
- Trans-Caspian pipeline expansion: Alternative routing for Central Asian energy
- Arctic LNG terminals: Cold-climate extraction and processing facilities
- Renewable energy transmission: Grid infrastructure for distributed generation
- Emergency storage facilities: Strategic petroleum and natural gas reserves
Renewable Energy Adoption Acceleration
Energy security concerns drive renewable energy investment beyond climate policy motivations. Energy independence considerations create additional economic justification for solar, wind, and energy storage projects.
Accelerated Deployment Factors:
- Risk-adjusted returns: Renewable projects face lower geopolitical supply risks
- Technology cost curves: Continued cost reductions improve competitiveness
- Policy support: Governments provide additional incentives for energy security
- Corporate strategies: Businesses invest in supply chain resilience
Geopolitical Alliance Restructuring
Trade relationships and energy partnerships undergo fundamental reassessment as nations prioritise supply security alongside economic efficiency. Regional energy cooperation agreements gain prominence over global market integration, particularly relevant to understanding the Strait of Hormuz crisis implications.
The next major ASX story will hit our subscribers first
Financial Market Pricing of Long-Term Closure Risk
Financial markets develop sophisticated mechanisms for pricing ongoing chokepoint closure risks that extend beyond immediate supply disruptions. Oil futures curves reflect market expectations about resolution timelines and supply normalisation prospects.
Oil Futures Curve Analysis
Futures market structure provides insights into market expectations about disruption duration and resolution mechanisms. Backwardation patterns indicate immediate supply tightness, while contango structures suggest expectations of eventual supply normalisation.
Market Structure Indicators:
- Front-month premiums: Immediate supply scarcity pricing
- Calendar spread relationships: Expected resolution timeline signals
- Volatility patterns: Uncertainty about political resolution prospects
- Options market skew: Asymmetric risk assessments
Energy Company Valuation Impacts
Energy sector equity valuations diverge significantly between upstream exploration companies and downstream refining operations. Geographic diversification becomes a critical valuation factor for international energy companies, further influenced by commodity market tariffs.
Valuation Divergence Patterns:
- Upstream companies: Benefit from higher commodity prices but face operational constraints
- Downstream refiners: Experience margin compression from crude cost increases
- Transportation companies: Pipeline and tanker operators see increased utilisation
- Alternative energy firms: Receive valuation premiums for supply security attributes
Sovereign Debt Implications
Oil-exporting nations face revenue shortfalls that affect sovereign debt sustainability, while importing nations experience fiscal pressure from energy subsidies and economic support programs.
Fiscal Impact Patterns:
- Exporting nations: Revenue decline despite higher prices due to volume constraints
- Importing nations: Increased subsidy costs and trade deficit pressures
- Debt service capacity: Currency depreciation affects foreign currency obligations
- Credit rating implications: Sovereign risk assessments incorporate energy security factors
Historical Precedents for Economic Recovery Timelines
Historical analysis of previous chokepoint disruptions provides insights into economic adjustment mechanisms and recovery timeline patterns, though each crisis presents unique characteristics that affect resolution prospects.
1980s Tanker War Lessons
The Iran-Iraq Tanker War (1984-1988) demonstrated how markets adapt to sustained shipping disruptions through route diversification, insurance mechanisms, and naval escort operations. Recovery occurred gradually over 18-24 months following conflict resolution.
Market Adaptation Mechanisms:
- Alternative routing: Development of longer shipping routes with higher costs
- Insurance pooling: International cooperation on war risk coverage
- Military escorts: Naval protection for commercial shipping operations
- Strategic coordination: Government intervention to maintain energy supplies
Gulf War Supply Disruption Recovery
The 1990-1991 Gulf War created immediate supply disruptions that markets resolved through strategic reserve releases and production increases from spare capacity providers. Recovery to normal market conditions occurred within 6-9 months post-conflict.
Resolution Timeline Factors:
- Spare capacity activation: Saudi Arabia and other producers increased output
- Strategic reserve coordination: IEA member nations released emergency stocks
- Infrastructure repair: Rapid restoration of damaged production facilities
- Market confidence: Clear conflict resolution enabled normal trading resumption
COVID-19 Supply Chain Parallels
The 2020-2021 pandemic demonstrated how global supply chains adapt to sustained disruptions through digital coordination, inventory adjustment, and supply source diversification. Economic normalisation required 24-36 months across different sectors.
Energy Transition Economics Acceleration During Crisis Periods
Energy security crises accelerate long-term transition economics by changing investment risk calculations and government policy priorities. Renewable energy projects receive enhanced economic justification beyond environmental considerations.
Renewable Energy Investment Justification
Crisis periods demonstrate the economic value of energy supply diversity and domestic production capacity. Solar and wind projects provide hedges against geopolitical supply disruptions that traditional financial analysis often undervalues.
Enhanced Investment Drivers:
- Supply security premiums: Domestic renewable energy reduces import dependency
- Price stability benefits: Renewable energy provides protection against volatile commodity prices
- Technology learning curves: Crisis-driven deployment accelerates cost reduction
- Policy support mechanisms: Governments provide additional incentives for energy independence
Energy Storage Market Expansion
Grid-scale energy storage systems gain strategic importance during supply crises as they enable greater renewable energy integration while providing emergency backup capacity. Battery storage deployment accelerates significantly during periods of energy supply uncertainty.
Storage Deployment Acceleration:
- Grid stability requirements: Increased renewable energy requires storage support
- Emergency preparedness: Backup power systems gain national security importance
- Cost-benefit analysis: Storage economics improve with higher energy price volatility
- Technology advancement: Crisis-driven investment accelerates innovation cycles
Industrial Policy Coordination Evolution
Government-private sector partnerships evolve during energy crises as national security considerations reshape traditional market-based approaches. Strategic sector coordination becomes more prominent in energy infrastructure development, with analysis from experts suggesting Iran's strategic position fundamentally affects global economic stability.
Strait of Hormuz closure events fundamentally reshape global economic structures through both immediate disruptions and long-term strategic adjustments. The economic implications extend far beyond immediate supply disruptions, fundamentally reshaping investment patterns, policy priorities, and market structures. Understanding these dynamics requires recognising how temporary crises create permanent changes in economic behaviour and institutional arrangements that persist long after immediate supply constraints resolve.
This analysis explores the complex economic mechanisms through which maritime chokepoint disruptions affect global markets, providing insights into both immediate adjustment processes and long-term structural changes that shape future energy system development.
Ready to Navigate Energy Market Volatility?
Discovery Alert's proprietary Discovery IQ model delivers real-time alerts on significant ASX mineral discoveries, helping investors identify actionable opportunities during volatile energy market conditions. With energy security driving increased focus on critical minerals and alternative supply chains, stay ahead of major discoveries that could reshape resource markets and begin your 14-day free trial today to position yourself strategically in an evolving global economy.