July 13, 2026
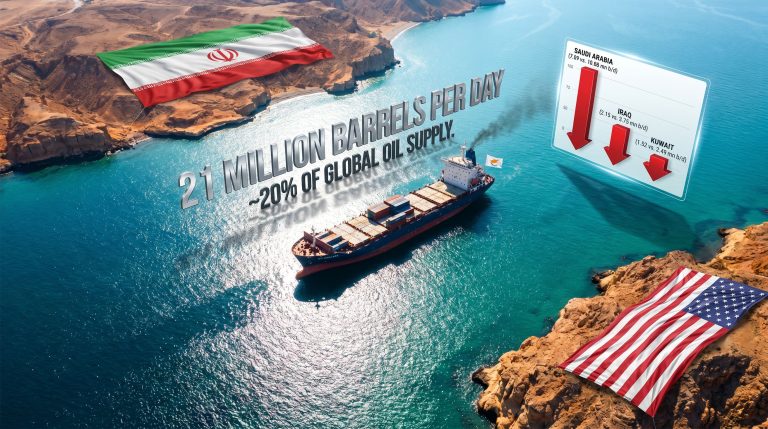
The global energy system faces unprecedented vulnerability through strategic maritime chokepoints, with the Strait of Hormuz closure representing one of the most significant risks to worldwide economic stability. This critical passage facilitates approximately 21% of global seaborne oil trade, making its potential disruption a catalyst for cascading effects across financial markets, supply chains, and geopolitical relationships worldwide.
Understanding the Strategic Importance of Critical Energy Corridors
The world's energy transportation system relies heavily on narrow maritime passages that connect major production centres with global consumption markets. These chokepoints have evolved into critical nodes where geographic constraints intersect with geopolitical tensions, creating vulnerability points that affect billions of consumers worldwide.
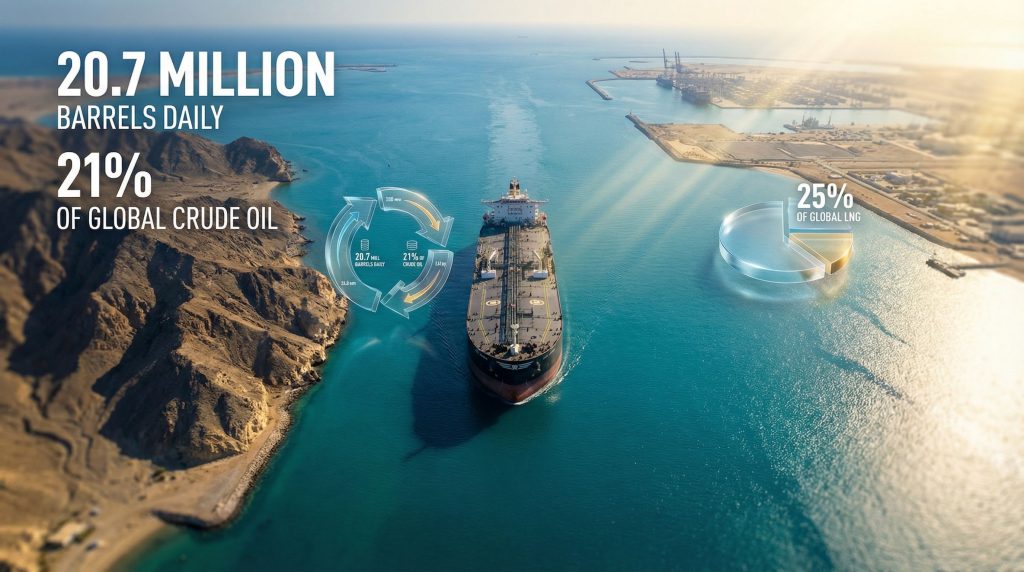
The Strait of Hormuz exemplifies this vulnerability as a 21-mile-wide passage connecting the Persian Gulf to the Gulf of Oman. This narrow waterway facilitates the movement of approximately 20.7 million barrels of crude oil daily, representing roughly 21% of global seaborne oil trade. The geographic positioning creates a natural funnel where deep-water channels accommodate modern supertankers, with navigable corridors approximately two miles wide in each direction.
Key Strategic Metrics:
- Daily crude oil transit: 20.7-21.5 million barrels
- Global consumption share: 12-13% of total worldwide oil usage
- LNG volumes: 3.0-3.2 billion cubic feet per day
- Asian market dependency: Over 15 million barrels daily for China, India, Japan, and South Korea combined
The concentration of global proven oil reserves in the Persian Gulf region amplifies this strategic importance. With approximately 48% of the world's proven crude oil reserves located in surrounding territories, the Strait functions as the primary distribution mechanism connecting these resources to major consumption centres across Asia and Europe.
During the 1980s Tanker War, approximately 300 commercial vessels were attacked in the Strait and surrounding waters. Despite extended disruption scenarios, alternative routes could absorb only 40-50% of displaced volumes, demonstrating the limited bypass capacity even during prolonged crisis periods.
When big ASX news breaks, our subscribers know first
Economic Transmission Mechanisms During Supply Disruptions
Market disruptions triggered by Strait of Hormuz closure unfold through multiple transmission channels that amplify initial supply constraints into broader economic impacts. Understanding these mechanisms reveals why energy chokepoint closures create disproportionate effects relative to the physical volumes involved.
Primary Market Shock Dynamics:
The immediate response involves rapid price adjustments as markets price in reduced supply reliability. Recent crisis data illustrates these dynamics clearly. Brent crude May futures reached $112.96 per barrel, representing a 59% monthly increase for March 2026, while WTI futures climbed 58% during the same period.
Insurance markets provide early warning signals of supply chain stress. War risk premiums escalated from baseline levels of $0.02-0.05 per $100 of cargo value to crisis levels of $2.00-5.00 per $100, representing a 40-250x increase. When premiums exceed $10 per $100, commercial shipping activity effectively ceases due to prohibitive costs.
Furthermore, the interconnected nature of energy markets means that disruptions create ripple effects across multiple sectors simultaneously. Oil price stagnation analysis demonstrates how supply constraints interact with broader economic policies to amplify market volatility.
Secondary Economic Impacts:
| Impact Category | Timeline | Magnitude | Primary Effects |
|---|---|---|---|
| Insurance Premiums | 24-48 hours | 200-500% increase | Shipping cost escalation |
| Spot Market Premiums | 1-7 days | 15-25% vs forward prices | Regional price divergence |
| Inventory Drawdown | 30-90 days | Strategic reserve activation | Supply buffer depletion |
| Demand Destruction | 90+ days | Industrial fuel switching | Economic activity reduction |
Financial market analyst Sugandha Sachdeva from SS WealthStreet noted that "uncertainty persists even with diplomatic signals, as restoring damaged infrastructure requires significant time, maintaining supply constraints regardless of political resolutions."
Lin Ye from Rystad Energy emphasised that "gradual consumption of remaining market buffers increases vulnerability to prolonged closures, creating conditions where physical oil shortages could emerge across wider geographic areas, strengthening upward price momentum."
Alternative Transportation Networks and Capacity Constraints
When primary shipping routes become unavailable, global energy markets must rely on alternative transportation networks with significantly different cost structures and capacity limitations. These alternatives reveal both the flexibility and constraints within the global energy system.
Cape of Good Hope Route Analysis:
The primary maritime alternative involves routing tankers around the southern tip of Africa, adding approximately 8,000 nautical miles to voyage distances. This diversion creates multiple operational challenges:
- Additional transit time: 15-20 days per voyage
- Increased shipping costs: $2-3 per barrel
- Theoretical maximum capacity: 15-18 million barrels per day
- Practical bottleneck capacity: 10-12 million barrels per day due to port congestion
The extended voyage duration effectively removes tanker capacity from circulation for longer periods, creating secondary scarcity effects even when alternative routes remain physically accessible.
Pipeline Infrastructure Capabilities:
Regional pipeline networks provide limited bypass capacity for crude oil movements. However, energy security strategies increasingly recognise the importance of diversified infrastructure development to mitigate chokepoint risks.
Saudi East-West Pipeline System
The Saudi East-West Pipeline connects eastern oilfields including Safaniyah and Ghawar to the Yanbu Red Sea terminal, with current capacity of 5.0 million barrels per day. During the March 2026 crisis, this system operated near maximum capacity, with Saudi crude exports through Yanbu reaching 4.658 million barrels per day, compared to average volumes of 770,000 barrels per day in January-February 2026.
UAE Abu Dhabi Crude Oil Pipeline
The UAE's ADCO pipeline system provides additional bypass capacity of 1.5 million barrels per day, connecting Abu Dhabi production to Red Sea export terminals. While smaller than Saudi infrastructure, this system offers diversification benefits for UAE crude exports.
Comparative Route Analysis:
| Transportation Option | Daily Capacity (million bpd) | Additional Cost per Barrel | Transit Time Increase |
|---|---|---|---|
| Cape Route Diversion | 15-18 | $2-3 | +15-20 days |
| Red Sea Pipeline Systems | 6.5 | $0.50 | +3-5 days |
| Overland Transportation | 2-3 | $4-6 | +7-10 days |
The combined alternative capacity of approximately 23-27 million barrels per day theoretically exceeds normal Hormuz flows, but practical constraints including port congestion, tanker availability, and infrastructure bottlenecks reduce effective capacity to 60-70% of normal Hormuz traffic within 30-45 days of disruption.
Insurance Market Dynamics and Risk Assessment
Maritime insurance markets serve as both early warning systems and amplification mechanisms during shipping disruptions. The insurance industry's risk assessment methodologies directly influence the economic viability of alternative shipping arrangements.
War Risk Premium Structure:
Lloyd's of London and international insurance syndicates employ sophisticated risk assessment frameworks that consider multiple factors:
- Vessel replacement cost calculations based on current shipbuilding prices
- Crew safety liability exposure including kidnapping and injury coverage
- Cargo value protection requirements for energy shipments
- Political risk insurance integration covering government action impacts
Market Dysfunction Thresholds:
Historical analysis reveals specific premium levels that trigger market behavioural changes:
"When war risk premiums exceed $10 per $100 of cargo value, commercial shipping activity effectively ceases as the insurance costs become prohibitive relative to cargo margins."
This threshold creates binary market conditions where shipping either continues at elevated costs or stops entirely, with limited intermediate positions available to market participants.
Strategic Reserve Systems and Storage Limitations
Global strategic petroleum reserves represent critical buffers during supply disruptions, but their capacity limitations create finite windows for crisis management. Understanding these constraints helps quantify the maximum duration of sustainable supply disruptions.
Global Reserve Capacity Assessment:
- US Strategic Petroleum Reserve: 714 million barrels (current holdings)
- IEA member emergency stocks: 1.5 billion barrels total
- Commercial inventory levels: 2.8 billion barrels globally
- Maximum sustainable drawdown: 60-90 days at normal consumption rates
Producer Storage Constraints:
Gulf region oil producers typically maintain storage capacity equivalent to 30-45 days of normal export volumes. When export terminals become inaccessible, producers must declare force majeure within weeks as storage facilities reach capacity limits.
"Producer storage limitations create urgent pressure for alternative export arrangements, as continued production without export capability leads to rapid storage overflow and potential production shutdowns."
Additionally, Saudi exploration impact on global markets demonstrates how regional production capabilities influence worldwide energy security considerations.
Release Coordination Mechanisms:
The International Energy Agency coordinates emergency response protocols among member nations, but release mechanisms operate under specific constraints:
- Coordinated release capacity: 2-3 million barrels per day maximum
- Release duration limits: 90-120 days before reserve depletion
- Distribution logistics: Regional refineries must accommodate different crude grades
- Refill requirements: Reserves must be replenished when markets stabilise
Price Elasticity and Demand Response Mechanisms
Energy markets exhibit complex demand elasticity patterns that vary significantly across different price levels and time horizons. Understanding these dynamics helps predict market behaviour during extended supply disruptions.
Demand Destruction Thresholds:
Economic modelling identifies specific price levels where demand behaviour changes qualitatively:
- $120-130 per barrel: Industrial fuel switching accelerates as manufacturers substitute natural gas for fuel oil where technically feasible
- $150-170 per barrel: Transportation sector demand reduction becomes measurable as consumers reduce discretionary travel
- $200+ per barrel: Significant recession risk emerges as energy costs consume disproportionate shares of economic output
Supply Response Characteristics:
Alternative supply sources exhibit varying response times to sustained high prices:
- US shale activation: 3-6 months for meaningful production increases
- OPEC spare capacity: 2-3 million barrels per day available within weeks
- Non-OPEC production increases: 6-12 months for project development
Consequently, the interaction between supply constraints and global trade policies creates additional complexity. Analysis of US‑China trade impacts reveals how geopolitical tensions amplify energy security vulnerabilities.
The next major ASX story will hit our subscribers first
Central Bank Policy Responses to Energy-Driven Inflation
Energy supply shocks create unique challenges for monetary policy makers, as traditional inflation-fighting tools prove less effective against supply-driven price increases. Central bank responses vary based on the perceived duration and magnitude of energy price increases.
Monetary Policy Dilemma Framework:
Central banks face competing pressures during energy crises:
- Stagflation risk assessment: Economic growth slowdown combined with inflation acceleration
- Interest rate policy constraints: Limited effectiveness of rate changes against supply shocks
- Currency intervention strategies: Managing exchange rate impacts on energy import costs
Coordinated Response Scenarios:
| Oil Price Level | Federal Reserve Response | European Central Bank | Bank of Japan |
|---|---|---|---|
| $120-140 | Pause rate increases | Maintain accommodation | Yield curve control |
| $140-170 | Emergency liquidity provision | Selective tightening measures | Currency intervention |
| $170+ | Recession preparation protocols | Crisis management activation | Coordinated international action |
The effectiveness of monetary policy during energy crises depends heavily on expectations management and the credibility of central bank communications regarding the temporary nature of supply-driven price increases. Moreover, US inflation and tariffs considerations demonstrate how domestic policy decisions interact with global energy disruptions.
Geopolitical Risk Assessment and Resolution Pathways
Energy chokepoint closures often reflect broader geopolitical tensions that require diplomatic rather than purely economic solutions. Understanding these political dynamics provides insight into likely crisis duration and resolution mechanisms.
Diplomatic Resolution Framework:
Multiple diplomatic channels typically operate simultaneously during energy crises:
- Multilateral mediation frameworks through UN Security Council engagement
- Regional power broker involvement including Saudi Arabia and UAE diplomatic initiatives
- Economic pressure mechanisms involving sanctions relief negotiations
- Security guarantee structures for international naval escort arrangements
Escalation Risk Variables:
Several factors influence whether energy disruptions escalate or de-escalate over time:
- Military infrastructure targeting affecting refinery and port facility vulnerability
- Proxy conflict expansion through regional alliance activation
- Cyber warfare capabilities disrupting critical infrastructure systems
- International intervention thresholds for naval protection of commercial shipping
Recent incidents highlight these escalation dynamics. The Kuwait Petroleum Corporation tanker Al Salmi, carrying 2 million barrels, was reportedly struck during an alleged attack at Dubai port, demonstrating direct infrastructure vulnerability during closure periods while raising environmental spillage concerns.
What are the key diplomatic challenges?
BBC analysis indicates that diplomatic resolution efforts face significant obstacles when military actions directly target civilian infrastructure. International mediation becomes increasingly difficult as economic damages accumulate and regional tensions escalate beyond initial triggering events.
Long-term Structural Adaptations in Global Energy Systems
Extended energy chokepoint disruptions catalyse permanent changes in global energy infrastructure investment patterns. These structural adaptations continue long after immediate crises resolve, reshaping global energy security architecture.
Infrastructure Development Responses:
- Alternative pipeline construction: 5-7 year development cycles for major cross-border projects
- LNG terminal expansion: Regional import capacity enhancement to reduce crude oil dependency
- Renewable energy acceleration: Strategic energy independence initiatives gain political support
Supply Chain Resilience Evolution:
Corporate risk management strategies adapt to incorporate lessons learned from major disruptions:
- Inventory management evolution toward higher safety stock requirements
- Supplier diversification mandates emphasising geographic risk distribution
- Technology integration enabling real-time supply monitoring and alternative sourcing
"Historical analysis demonstrates that prolonged shipping disruptions create permanent shifts in global energy infrastructure investment patterns, as companies and governments prioritise supply security over cost optimisation."
These structural changes typically persist for decades, as the capital-intensive nature of energy infrastructure means that crisis-driven investment decisions influence market dynamics long after triggering events resolve.
How do markets adapt to prolonged disruptions?
The interconnected nature of global energy systems means that major chokepoint disruptions reveal vulnerabilities that extend beyond immediate supply impacts. Understanding these complex relationships provides crucial insight for investors, policymakers, and business leaders navigating an increasingly uncertain energy landscape.
In addition, the Strait of Hormuz closure scenario demonstrates how single-point failures in critical infrastructure can trigger systemic risks across multiple economic sectors. As global energy demand continues growing while supply sources remain geographically concentrated, the strategic importance of these maritime corridors will likely intensify, making comprehensive risk management strategies increasingly essential for economic stability.
Disclaimer: This analysis presents educational content regarding energy market dynamics and should not be considered financial or investment advice. Energy markets involve significant risks and uncertainties that can result in substantial losses. Readers should consult qualified professionals before making investment decisions based on energy market analysis.
Ready to Capitalise on Energy Market Disruptions?
Discovery Alert provides instant notifications on significant ASX mineral discoveries, including critical energy commodities, powered by its proprietary Discovery IQ model. When energy chokepoints create market volatility, savvy investors can identify opportunities in Australian resource companies positioned to benefit from supply disruptions. Begin your 14-day free trial today to gain a market-leading edge during these uncertain times.