August 1, 2026
The global economy stands on the precipice of an unprecedented energy crisis, where decades of interconnected supply chains and concentrated production routes have created vulnerabilities that extend far beyond simple market fluctuations. Modern industrial civilization has evolved around the assumption that critical maritime chokepoints will remain perpetually open, yet this foundation rests on increasingly unstable geopolitical ground. The Strait of Hormuz closure impact represents perhaps the most significant threat to global energy security, with the intricate web of international trade, financial markets, and energy dependencies reaching a complexity where single points of failure can trigger cascading economic disruptions across continents.
Understanding these systemic risks requires examining not just the immediate mechanics of supply disruption, but the deeper structural weaknesses that amplify regional conflicts into global economic crises. When energy flows through narrow geographic passages become weaponized, the resulting economic shockwaves reveal the true cost of globalised interdependence. Furthermore, understanding oil price rally dynamics becomes crucial for comprehending how geopolitical tensions translate into market volatility.
What Makes the Strait of Hormuz the World's Most Critical Energy Chokepoint?
Strategic Geography and Energy Flow Concentration
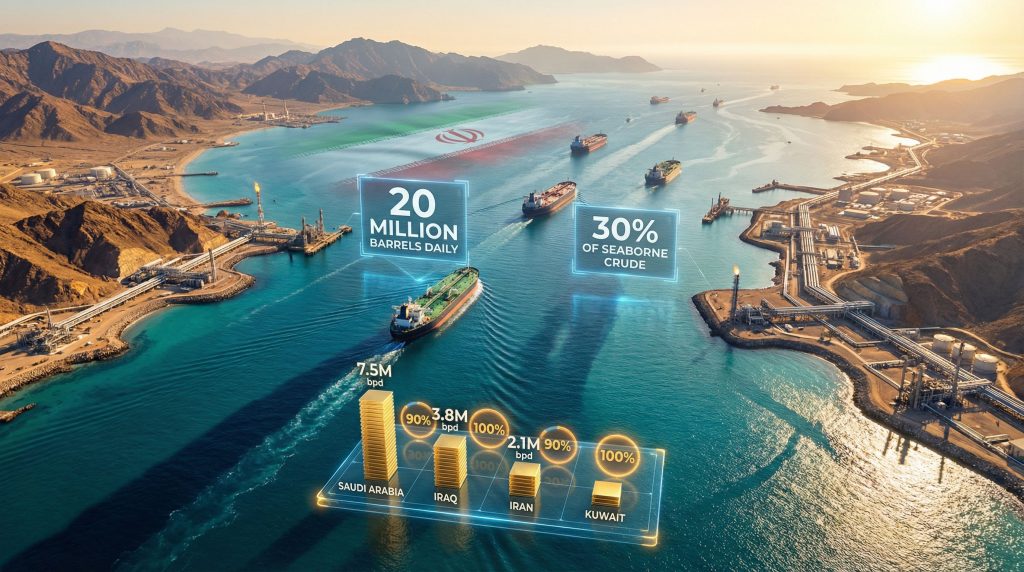
The Strait of Hormuz functions as the world's most critical energy transit route, handling approximately 20 million barrels of crude oil daily, representing roughly 20 percent of global oil consumption. Beyond crude oil, substantial volumes of liquefied natural gas flow through this narrow passage, particularly from Qatar's massive North Field to energy-hungry Asian markets. This concentration creates what economists term a "single point of failure" in global energy infrastructure.
The strait's physical characteristics amplify its strategic importance. At its narrowest point, the waterway spans just 21-33 kilometres, creating natural constraints that force massive oil tankers and LNG carriers into predictable shipping lanes. This geographic bottleneck transforms routine commercial navigation into a high-stakes geopolitical flashpoint where any disruption immediately affects global energy prices and supply stability.
Recent events have demonstrated this vulnerability in stark terms. Military tensions escalating throughout 2025 between regional powers led to increased risks for commercial vessels and oil tankers, prompting shipping and insurance companies to exercise greater caution or reroute vessels entirely. In addition, the OPEC production impact on global markets becomes magnified when critical transit routes face disruption. The strait's role extends beyond ordinary shipping operations to function as a global energy bottleneck relied upon by oil exports from Gulf countries including Iraq, Kuwait, UAE, and Saudi Arabia.
Regional Producer Vulnerability Assessment
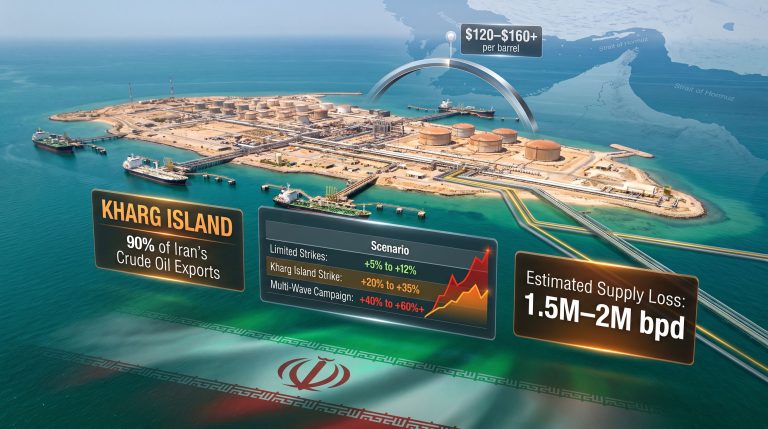
The dependency levels of major oil producers reveal the extent of Strait of Hormuz closure impact on global energy markets. Iran represents perhaps the most vulnerable position, with approximately 90% of its oil exports transiting through the strait via the Kharg Island terminals. This concentration means that any sustained closure would effectively eliminate Iran from global oil markets, removing roughly 2.1 million barrels per day from international supply.
Iraq faces complete export dependency through the strait, with 3.8 million barrels per day having no viable alternative routes currently operational. Kuwait similarly lacks alternative export infrastructure, making its 2.7 million barrels per day entirely dependent on Hormuz transit. The UAE maintains some flexibility through the Abu Dhabi pipeline system, though 85% of its 3.2 million barrels per day still routes through the strait.
Strait of Hormuz Energy Dependencies by Country
| Producer | Daily Export Volume (mbpd) | Strait Dependency | Alternative Routes |
|---|---|---|---|
| Saudi Arabia | 7.5 | 65% | East-West Pipeline |
| Iran | 2.1 | 90% | Limited overland |
| Iraq | 3.8 | 100% | None operational |
| Kuwait | 2.7 | 100% | None |
| UAE | 3.2 | 85% | Abu Dhabi pipeline |
For Iran specifically, oil export revenues constitute approximately 35% of government income, making sustained closure an existential economic threat. Recent attacks have already demonstrated this vulnerability, with explosive-laden boats striking fuel tankers in Iraqi waters, leading Iraqi officials to report that oil ports have completely stopped operations. Similarly, Oman evacuated all vessels from its key export terminal at Mina Al Fahal as a precautionary measure.
Iran's escalation of attacks on merchant ships has raised the number of vessels struck in the region to at least 16 since fighting began, with Tehran warning that global oil prices could reach $200 per barrel. This represents not merely a tactical military campaign but a strategic attempt to leverage energy chokepoint control for geopolitical advantage. Moreover, comprehensive WTI/Brent analysis reveals how these disruptions affect benchmark crude pricing mechanisms worldwide.
When big ASX news breaks, our subscribers know first
How Long Can Strategic Petroleum Reserves Sustain Global Energy Demand?
OECD Strategic Reserve Analysis
Global strategic petroleum reserves represent the primary buffer against supply disruptions, yet their limitations become apparent when measured against the scale of Strait of Hormuz closure impact. The 38 countries of the Organisation for Economic Cooperation and Development (OECD) maintain combined reserves totalling approximately 2.83 billion barrels as of October 2024, providing coverage for roughly 61.8 days based on current consumption patterns.
The United States holds the world's largest strategic stockpile, with approximately 1.68 billion barrels of strategic and commercial oil reserves. However, actual supply capacity depends critically on maximum withdrawal rates rather than total volume. US crude oil reserves alone could theoretically last 50-53 days if fully relied upon, though practical deployment faces significant logistical constraints.
China maintains reserves exceeding 1.2 billion barrels, sufficient for approximately three months of consumption at current rates. Japan demonstrates a different strategic approach, keeping stockpiles that cover more than 200 days of its oil imports, reflecting its complete dependency on imported energy and historical experience with supply disruptions.
Reserve Deployment Mechanics and Limitations
The International Energy Agency coordinates emergency reserve releases through established protocols developed during previous oil crises. Recent events triggered the largest such deployment in IEA history, with plans to release 400 million barrels from member nation reserves. As part of this coordinated response, the United States committed to releasing 172 million barrels beginning the week of March 12, 2026.
Despite these substantial volumes, market analysts expressed scepticism about reserve effectiveness according to recent analysis. Investors reportedly took little comfort from the IEA's unprecedented release announcement, reflecting deeper concerns about the arithmetic of supply replacement. The core challenge lies in matching both the volume and sustained flow rates that the Strait of Hormuz provides to global markets.
Critical Gap Analysis: Even with coordinated strategic reserve releases, global stockpiles cannot fully replace 20 million barrels daily for extended periods. The arithmetic is stark: complete Hormuz closure depletes available reserves within 3-4 months maximum, assuming optimal withdrawal rates and no additional supply disruptions.
Financial institutions emphasise that while reserves can initially mitigate supply shortfalls and offset significant portions of lost production, this measure provides only temporary relief. Market pressures and sharp price spikes become inevitable within months as reserves approach depletion, creating secondary economic cascades that extend far beyond energy markets.
What Economic Sectors Face Immediate Collapse from Energy Supply Disruption?
Primary Impact Zones
Energy supply disruption creates immediate stress across multiple economic sectors, beginning with the most energy-intensive industries. Refined products markets face acute pressure as diesel, petrol, and jet fuel supply chains experience simultaneous demand spikes and supply constraints. Industrial manufacturing, particularly chemical feedstock production across the Asia-Pacific region, faces operational shutdowns as input costs become economically prohibitive.
Transportation networks experience cascading failures as shipping, aviation, and logistics companies confront explosive cost increases. Oil prices surged 9.2 percent to $100.37 per barrel for Brent crude, with US crude futures jumping 8.1 percent to $94.26 per barrel in immediate response to Strait closure developments. These price movements translate directly into transportation cost inflation that ripples throughout supply chains.
Financial markets responded with broad-based equity declines, as MSCI's broadest index of Asia-Pacific shares outside Japan fell 1.5 percent, while the Nikkei dropped 1.4 percent. Chinese markets showed particular vulnerability, with blue-chips losing 0.6 percent and Hong Kong's Hang Seng index sliding 1.2 percent. Consequently, US markets faced similar pressure, with S&P 500 futures and Nasdaq futures falling 0.9 percent.
Secondary Economic Cascades
Food security emerges as a critical vulnerability for import-dependent Gulf states, where supply disruption affects not only energy inputs but agricultural imports essential for population sustenance. Container shipping faces potential paralysis, with industry estimates suggesting 70% traffic reduction through alternative routes that add substantial time and cost to global trade flows.
Tourism and services sectors experience immediate contraction as regional economic activity adjusts to crisis conditions. The psychological impact extends beyond direct economic calculations, as nervous investors seek dollar liquidity while shunning currencies from countries that are net energy importers, including Japan and much of Europe. Furthermore, understanding US oil decline insights helps explain why domestic production cannot immediately offset international supply disruptions.
Sector-Specific Impact Timeline
| Economic Sector | Immediate (0-7 days) | Short-term (1-4 weeks) | Medium-term (1-3 months) |
|---|---|---|---|
| Energy Markets | Price spike to $100+ | Supply rationing begins | Strategic reserve depletion |
| Manufacturing | Production slowdowns | Plant shutdowns | Supply chain restructuring |
| Transportation | Route diversions | Service cancellations | Fleet repositioning |
| Financial Markets | Volatility surge | Credit tightening | Recession indicators |
Currency markets demonstrate immediate stress patterns, with the euro slipping 0.2 percent to $1.1539 after reaching its weakest level since November of the previous year. The dollar strengthened 0.1 percent to 159.12 yen, hitting its strongest position since January. The risk-sensitive Australian dollar lost 0.4 percent to $0.7122, despite previously reaching a three-year high as central bank rate hike expectations shifted.
Which Alternative Energy Routes Could Partially Offset Strait Closures?
Existing Pipeline Infrastructure
Alternative energy infrastructure provides limited but critical backup capacity during Strait of Hormuz disruptions. The Saudi East-West Pipeline represents the most significant bypass route, with capacity to transport approximately 5 million barrels per day from eastern production facilities to Red Sea terminals. This infrastructure enables Saudi Arabia to maintain roughly 65% of its export capacity even during complete Strait closure.
The UAE operates the Abu Dhabi Pipeline system with capacity for 1.5 million barrels per day, providing partial bypass capability for Emirati crude exports. However, this represents only 47% of the UAE's total export volume, leaving the majority of production vulnerable to Strait disruptions.
Iraq-Turkey Pipeline infrastructure exists but operates at limited capacity due to ongoing security concerns and technical constraints. Current throughput remains well below the 3.8 million barrels per day that Iraq exports through the Strait, leaving no meaningful alternative for Iraqi production.
Emergency Routing and Capacity Constraints
Maritime rerouting through the Suez Canal provides alternative passage but at substantial time and cost penalties. Vessels must navigate around the Arabian Peninsula, adding 15-20 days to typical delivery schedules and increasing shipping costs proportionally. The Cape of Good Hope route presents even longer alternatives, effectively doubling transit times for Asian deliveries.
Overland transportation through rail and truck networks offers extremely limited capacity for bulk energy products. While some refined products can move via these modes, the volumes represent negligible percentages of normal maritime flows. The infrastructure simply lacks the scale necessary to replace major shipping routes.
Regional pipeline coordination presents possibilities for enhanced alternative routing. Analysis suggests that several factors may help reduce the impact of any disruption in the strait, including the presence of alternative pipelines bypassing the strait and spare production capacity that can partially offset shortages. However, these alternatives collectively handle only a fraction of total Strait flows. In addition, the trade war oil impact complicates these supply chain alternatives as tariff policies affect energy trade relationships.
How Do Oil Price Shocks Trigger Global Inflation Spirals?
Energy-Driven Cost Push Inflation
Energy price increases create immediate inflationary pressure through transportation and manufacturing cost transmission. Historical precedents from the 1973 oil embargo, 1979 Iranian Revolution, and 2008 commodity crisis demonstrate how energy shocks propagate through economic systems, typically appearing in consumer price indices within 30-60 days through transportation costs.
Current inflation data already reflects emerging pressures, with the US consumer price index rising 0.3 percent in February. However, analysts noted this data carries limited relevance given that the Iran war has begun to fuel inflation beyond normal economic patterns. The compounding effect of energy-driven cost increases creates policy dilemmas for central banks attempting to balance growth support with inflation control.
Bond markets immediately priced in inflation expectations, with yields on 10-year Treasury notes rising 3 basis points to 4.2374 percent, having jumped 7 basis points overnight. This movement reflects market assessment that rising energy costs will prove more persistent than temporary supply disruptions, requiring sustained monetary policy responses.
Regional Economic Vulnerability Assessment
Asia-Pacific economies face particular vulnerability due to their concentration of Hormuz crude oil imports. Approximately 69% of crude flows through the strait ultimately reach China, India, Japan, and South Korea, making these economies directly exposed to supply disruption and price volatility. Import cost inflation becomes particularly acute for developing economies with limited fiscal buffers.
European energy security concerns extend beyond crude oil to include LNG import dependencies, where price elasticity remains limited due to infrastructure constraints. According to reports from the BBC, the risk of energy-driven inflation has led markets to wager the next move in rates from the European Central Bank could be up, possibly as early as June.
Federal Reserve policy expectations shifted dramatically, with Fed funds futures extending their slide as investors feared higher inflation would make it harder for the Federal Reserve to ease policy. Markets currently anticipate just one more rate cut from the Fed this year, representing a significant reduction from previous expectations.
How quickly do oil price shocks translate into consumer inflation?
Energy price increases typically appear in consumer inflation within 30-60 days through transportation costs, with broader economic impacts manifesting over 3-6 months as businesses adjust pricing across supply chains. However, during severe disruptions like Strait of Hormuz closure impact, these timelines can accelerate significantly as panic buying and supply hoarding amplify price pressures.
What Financial Market Disruptions Follow Energy Supply Crises?
Equity Market Sector Rotation
Financial markets experience immediate sector rotation during energy crises, with upstream energy producers benefiting from price spikes while energy-intensive industries face margin compression. Airlines, shipping companies, and chemical manufacturers encounter immediate cost pressure that translates into equity underperformance relative to energy exploration and production companies.
Defensive asset flows accelerate toward utilities and consumer staples as investors seek revenue streams less sensitive to energy cost fluctuations. This rotation pattern typically intensifies during sustained supply disruptions, creating distinct performance divergence across market sectors.
Market psychology shifts toward risk aversion, as demonstrated by EUROSTOXX 50 futures declining 0.8 percent while DAX futures lost 1 percent. These movements reflect European market concerns about energy import dependency and manufacturing competitiveness during periods of elevated energy costs.
Currency and Bond Market Responses
Currency markets demonstrate clear patterns during energy crises, with dollar strengthening reflecting safe-haven demand during geopolitical stress. Energy-importing nations face current account deterioration as import costs rise, creating pressure on their currencies relative to the dollar and energy-exporting currencies.
Inflation-protected securities outperform conventional bonds as investors hedge against energy-driven price increases. Treasury Inflation-Protected Securities (TIPS) and inflation-linked bonds from other developed economies typically see increased demand as energy supply concerns translate into sustained inflation expectations.
The risk of rising inflation outweighed safe-haven considerations to push yields higher globally, demonstrating how energy crises create complex cross-currents in fixed income markets. Traditional flight-to-quality patterns become complicated when energy supply disruption creates inflation rather than deflationary pressures.
The next major ASX story will hit our subscribers first
How Do Geopolitical Risk Premiums Reshape Energy Investment Flows?
Capital Allocation Shifts
Energy security premiums drive increased investment toward domestic production capabilities as nations reassess supply chain vulnerabilities. This shift accelerates development of previously uneconomical energy resources, including higher-cost shale formations, deepwater projects, and alternative energy infrastructure that provides supply diversification.
Infrastructure redundancy becomes a strategic priority, with governments and private sector entities investing in pipeline diversification projects and additional terminal capacity. These investments typically carry higher costs than existing infrastructure but provide insurance value against supply disruption risks.
Strategic reserve expansion initiatives gain political and financial support as nations recognise the limitations of current stockpiling levels. Government investment in storage capacity and emergency response infrastructure increases substantially following supply crisis events.
Long-term Energy Transition Acceleration
Energy supply crises create political momentum for renewable energy investment by highlighting the risks associated with geopolitical concentration in fossil fuel production. Crisis-driven policy support often provides subsidies and regulatory frameworks that accelerate alternative energy deployment beyond normal market-driven timelines.
Energy efficiency mandates gain support as demand destruction through conservation provides immediate relief during supply constraints. Industrial and transportation efficiency improvements that might otherwise face cost-benefit resistance become economically attractive during high energy price periods.
Supply chain regionalisation accelerates as companies and governments seek to reduce dependency on vulnerable chokepoints. This trend involves higher costs but provides strategic value through reduced exposure to geopolitical supply disruption.
What Historical Precedents Reveal About Economic Recovery Timelines?
Past Energy Crisis Recovery Patterns
The 1980s Iran-Iraq War period provides relevant precedent for understanding Strait of Hormuz disruption impacts. During the "Tanker War" phase of this conflict, global markets adapted through increased strategic reserve utilisation, alternative routing development, and temporary demand destruction. Recovery timelines typically extended 12-18 months for market normalisation following conflict resolution.
The 1990-91 Gulf War demonstrated the effectiveness of coordinated strategic reserve releases in managing acute supply disruptions. Market recovery occurred within 6-8 months following conflict resolution, though this timeframe reflected relatively brief disruption duration and overwhelming international coalition response.
More recent events, including 2019 drone attacks on Saudi infrastructure, revealed modern market resilience and rapid recovery capabilities. Financial market and pricing normalisation occurred within weeks, though these incidents involved temporary rather than sustained supply disruption.
Economic Scarring Effects
Permanent behavioural changes emerge from supply crisis experiences, particularly regarding corporate inventory strategies and supplier diversification. Companies typically maintain higher buffer stocks and develop alternative supplier relationships that persist beyond the immediate crisis period.
Policy infrastructure enhancement occurs through crisis experience, with enhanced international cooperation mechanisms and improved reserve coordination protocols. These institutional improvements provide better responses to future disruptions but require sustained political commitment and resource allocation.
Market structure evolution includes development of derivatives markets and risk management tools that provide better hedging capabilities for energy price volatility. These financial innovations typically emerge during crisis periods and persist as permanent market infrastructure improvements.
How long before alternative supply routes fully compensate for Strait closure?
Complete compensation requires 6-18 months for pipeline capacity expansion and shipping route optimisation, assuming no further geopolitical escalation and sustained investment in alternative infrastructure. However, the Strait of Hormuz closure impact involves such massive volumes that full replacement capacity may require several years to develop effectively.
Which countries benefit economically from Strait of Hormuz disruptions?
Non-Gulf oil producers including US shale operators, Norway, and Canada gain market share and pricing power during disruption periods, while alternative energy suppliers benefit from accelerated investment and deployment. These nations can expand production to partially offset lost Gulf supplies, though the scale remains insufficient for complete replacement.
Building Resilience Against Energy Chokepoint Vulnerabilities
Strategic Recommendations for Economic Stability
Diversified energy portfolio development represents the fundamental approach to reducing single-point-of-failure risks in global energy supply. This requires coordinated investment in alternative supply sources, transportation infrastructure, and storage capacity that provides genuine redundancy rather than marginal improvements to existing systems.
Enhanced international coordination through multilateral reserve sharing agreements provides improved crisis response capabilities. The current IEA framework requires expansion to include major consuming nations outside the OECD and pre-positioned release mechanisms that activate automatically during supply disruptions.
Investment in alternative infrastructure must address both immediate bypass capabilities and long-term energy transition objectives. Pipeline and shipping route redundancy projects require substantial capital commitments but provide essential insurance against geopolitical supply manipulation.
The Strait of Hormuz closure impact extends far beyond energy markets to encompass global financial stability, industrial production capability, and international political relationships. Understanding these interconnections enables better preparation for supply crisis events and more effective policy responses that minimise economic disruption while maintaining strategic energy security objectives.
Further Exploration:
Readers interested in learning more about global energy security and geopolitical risk assessment can explore educational content from the Oxford Institute for Energy Studies and research institutions that provide additional perspectives on critical maritime chokepoints and their economic implications.
Ready to Capitalise on Energy Market Volatility?
Discovery Alert's proprietary Discovery IQ model delivers real-time alerts on significant ASX mineral discoveries, enabling subscribers to identify actionable opportunities in energy and commodity markets before broader market recognition. With geopolitical tensions creating unprecedented volatility in global energy markets, understanding major mineral discoveries becomes crucial for positioning investment portfolios to benefit from supply chain disruptions and commodity price fluctuations.