July 29, 2026
Global energy markets face perpetual vulnerability to maritime chokepoint disruptions, with critical shipping lanes serving as economic pressure points that can trigger cascading crises across interconnected supply chains. The strait of Hormuz closure impact demonstrates how concentration of energy flows through narrow waterways creates systemic risks that extend far beyond immediate price volatility, fundamentally reshaping economic relationships and strategic decision-making processes across multiple sectors.
Understanding Critical Energy Transit Vulnerabilities
The global energy system depends heavily on maritime chokepoints that channel massive volumes of crude oil and natural gas through geographically constrained passages. These narrow waterways represent critical infrastructure bottlenecks where even temporary disruptions can generate profound economic consequences.
Geographic Concentration of Energy Flows
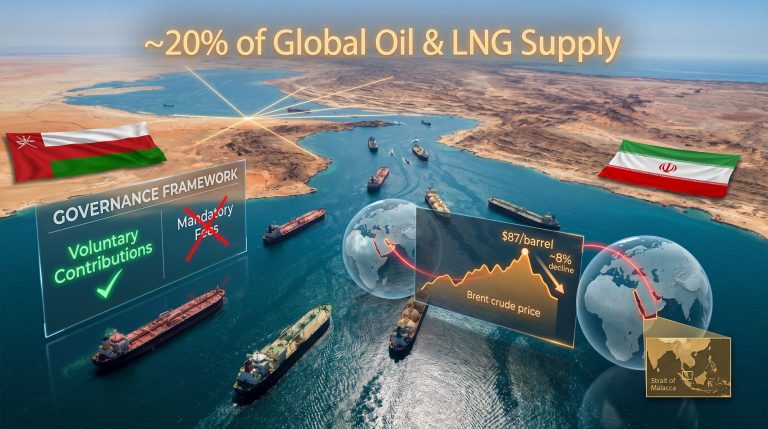
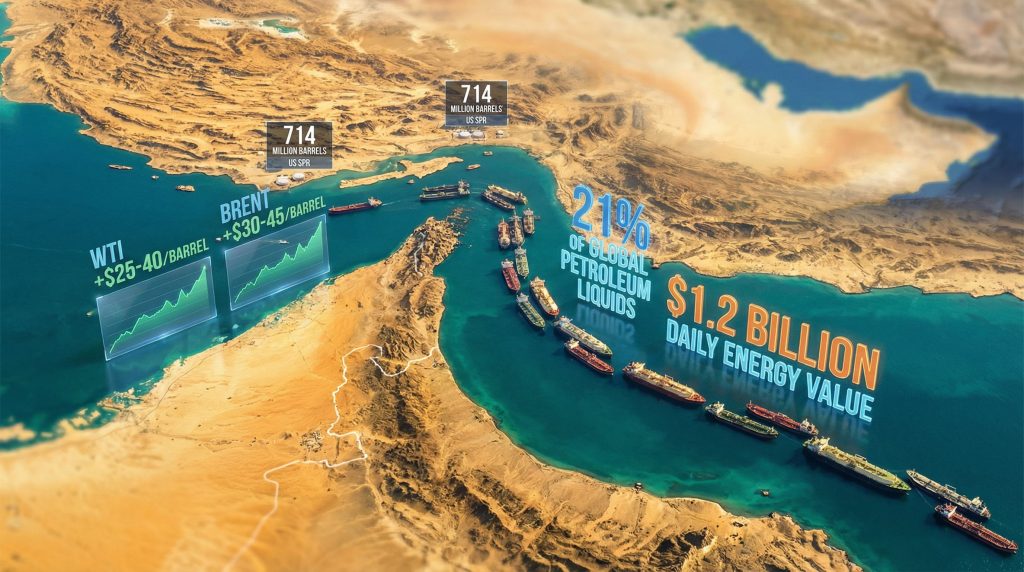
The strait of Hormuz closure impact demonstrates how geographic constraints create vulnerability in global energy security. This narrow passage spans approximately 21 miles at its narrowest point, yet facilitates the transit of roughly 21% of global petroleum liquids and 20% of seaborne liquefied natural gas. Furthermore, the daily energy value flowing through this chokepoint reaches approximately $1.2 billion in crude oil and petroleum products.
Recent events in 2026 provide concrete evidence of these vulnerabilities. Multiple targeted attacks by Iran led to a de facto closure of the Strait in early March 2026, creating immediate supply disruptions. Despite a U.S.-Iran ceasefire negotiated on April 9, 2026, traffic through the waterway remained at near-standstill levels, demonstrating how geopolitical tensions can override diplomatic agreements in maintaining energy flow restrictions.
Strategic Infrastructure Dependencies
Alternative routing options remain severely limited when primary chokepoints become unavailable. Pipeline bypass capacity offers minimal substitution for seaborne energy transport, particularly for Gulf Cooperation Council nations that depend heavily on maritime exports. Consequently, the concentration risk becomes apparent when considering that 30% of global oil production originates from Gulf states, creating regional supply dependencies that cannot be easily redirected through terrestrial infrastructure.
Standard Chartered analysis reveals that the 2026 Hormuz closure removed approximately 8 million barrels of crude per day from global flows, with Saudi Arabia alone experiencing 700,000 barrels per day in pipeline flow reductions. These figures illustrate the immediate supply shock magnitude that results from chokepoint disruptions.
When big ASX news breaks, our subscribers know first
Market Response Mechanisms During Supply Disruptions
Energy markets exhibit complex pricing dynamics when confronted with chokepoint closure scenarios, with immediate price reactions followed by structural adjustments that can persist for extended periods. However, the interconnected nature of these markets means oil price trade war considerations often compound during crisis periods.
Price Shock Amplification Patterns
Oil price movements during the 2026 Strait of Hormuz crisis demonstrate typical market response patterns to supply disruptions. WTI Crude traded at $95.81 (down 2.06%) while Brent Crude reached $95.20 (down 0.72%) as of April 12, 2026, reflecting market uncertainty despite ceasefire announcements.
Goldman Sachs projected that if Hormuz closure extends beyond one month, Brent crude would remain above $100 per barrel throughout 2026. In addition, JP Morgan estimates suggested oil could reach $120 per barrel if the stalemate continued into July 2026. These forecasts highlight how market participants price extended disruption scenarios into forward curves.
| Timeframe | Price Impact Range | Market Characteristics | Intervention Triggers |
|---|---|---|---|
| Week 1-2 | +$25-45/barrel | Panic buying, inventory drawdown | Emergency consultations |
| Month 1 | +$40-65/barrel | Strategic reserve releases | IEA coordination |
| Month 2+ | +$60-90/barrel | Demand destruction, substitution | Alternative supply agreements |
Insurance Market Transformation
War-risk insurance premiums provide clear indicators of perceived transit risks through affected waterways. During the 2026 crisis, insurance costs for Persian Gulf transits surged dramatically from 0.20%-0.25% of vessel value before the conflict to 7.5%-10% of vessel hull value per transit during peak risk periods. This represents a 1,000-4,000% increase in insurance costs.
For instance, a practical example illustrates the scale of cost escalation: a $150 million tanker faced insurance bills of up to $7.5 million for a single Hormuz transit, compared to a few hundred thousand dollars under normal conditions. These insurance premium increases effectively price many commercial operators out of affected transit routes.
Strategic Reserve Deployment Protocols
Emergency oil release mechanisms activate when supply disruptions reach critical thresholds. The International Energy Agency maintains 60-day emergency release protocols, while the United States Strategic Petroleum Reserve holds 714 million barrels available for market intervention. Moreover, regional variations exist, with Asian nations typically maintaining 90-day import coverage through strategic stockpiling.
However, the effectiveness of strategic releases depends on the ability to transport released volumes to affected markets. When chokepoints remain closed, strategic reserves may provide limited immediate relief to regions that depend on seaborne imports. The US natural gas forecast often factors in these supply constraints during crisis periods.
Industrial Supply Chain Disruption Cascades
Chokepoint closures generate ripple effects throughout interconnected supply chains, affecting industries far beyond direct energy consumption. Furthermore, the strait of Hormuz closure impact extends through complex manufacturing networks that depend on continuous energy flows.
Petrochemical Manufacturing Vulnerabilities
The petrochemical sector faces immediate production constraints when feedstock availability becomes restricted. Approximately 40% of global ethylene capacity depends on feedstock supplies that transit through major chokepoints. The 2026 crisis demonstrated these vulnerabilities when Iranian missiles hit LNG facilities in Qatar's Ras Laffan industrial hub, causing extensive damage to Shell facilities and forcing force majeure declarations.
Key petrochemical impacts include:
- Naphtha and LPG shortages cascading through plastics manufacturing
- Production capacity shifts toward facilities with alternative feedstock access
- Geographic redistribution favouring European and North American facilities
- Contract force majeure declarations affecting global supply agreements
Transportation Fuel Crisis Development
Aviation sector vulnerabilities become apparent within weeks of major supply disruptions. The headline "Europe's Jet Fuel Shortage Arriving in Weeks" from April 10, 2026, illustrates how quickly transportation fuel shortages develop. In addition, China implemented airline bailout considerations as fuel shock impacts spread through commercial aviation markets.
Marine bunker fuel costs increase substantially as alternative sourcing becomes necessary, adding $200-500 per tonne for vessels seeking fuel supplies outside affected regions. These cost increases compound with elevated insurance premiums to create significant barriers to commercial shipping operations.
Agricultural Input Dependencies
Fertiliser production faces severe constraints when natural gas supplies become restricted, as approximately 35% of global ammonia capacity depends on Gulf gas supplies. However, seasonal timing amplifies these impacts, with spring planting disruptions affecting global food security for entire growing seasons.
Regional food price inflation of 15-25% typically occurs in import-dependent markets when agricultural input costs surge due to energy supply disruptions. Consequently, the 2026 crisis prompted warnings of broader regional food security challenges as essential supplies including fuel and fertiliser faced distribution difficulties.
National Economic Adaptation Strategies
Different economic structures create varying vulnerabilities and response capabilities when confronted with energy supply disruptions. The OPEC production impact often influences how nations develop their adaptive strategies.
Advanced Economy Resilience Mechanisms
United States Response Framework:
- Domestic production surge from Permian Basin operators
- Enhanced cooperation with Canadian and Mexican suppliers
- Maximum utilisation of existing pipeline and refinery capacity
- Strategic partnership acceleration with non-affected suppliers
European Union Crisis Management:
- Industrial rationing protocol activation
- Accelerated African and North American import agreements
- Emergency renewable energy project fast-tracking
- Demand reduction mandate implementation
Emerging Market Vulnerability Patterns
Asian manufacturing hubs face particular challenges due to energy import dependencies and limited strategic reserve capacity. China's teapot refiners demonstrated opportunistic behaviour by rushing to secure Iranian crude as prices fluctuated, indicating adaptive purchasing strategies during market volatility hedging scenarios.
Regional impact variations:
- China: State-controlled energy allocation prioritising industrial production
- India: Fuel subsidy expansion straining government budget resources
- Southeast Asia: Export competitiveness erosion due to energy cost inflation
- Gulf States: Revenue losses exceeding $3 billion daily during closure periods
Economic Impact Quantification
The 2026 Strait of Hormuz crisis provides concrete data on national economic impacts. For instance, the strait of Hormuz closure impact created measurable GDP contractions across affected regions.
Gulf Cooperation Council GDP Contractions:
- Kuwait and Qatar: Up to 14% GDP contractions
- Saudi Arabia: Approximately 5% GDP reduction
- UAE: Approximately 3% GDP decline
Financial Market Responses:
- Dubai market: 15% decline
- Abu Dhabi and Qatar markets: 5-10% decreases
- Credit default swap spreads: Sharp increases for Bahrain and Dubai
Long-Term Economic Restructuring Effects
Extended chokepoint disruptions accelerate structural changes in energy infrastructure, trade relationships, and economic dependencies that persist beyond immediate crisis resolution. Moreover, global trade and development implications continue to evolve long after immediate crises end.
Infrastructure Investment Acceleration
Pipeline Development Priorities:
- Trans-Arabian route capacity expansion
- Iraq-Turkey pipeline throughput increases
- Alternative routing infrastructure construction
- Strategic bypass capacity development
LNG Terminal Expansion:
Asian import capacity increases of 40% within five years following major supply disruptions reflect long-term infrastructure adaptation. Furthermore, storage capacity expansions across OECD nations provide enhanced buffer capacity for future supply interruptions.
Technology Adoption Acceleration
Energy security concerns drive accelerated adoption of alternative technologies and supply sources. Renewable energy investment increases by 25-30% annually following major supply disruptions, while industrial process optimisation becomes critical for maintaining competitiveness under higher energy costs.
Alternative fuel development receives emergency funding prioritisation:
- Hydrogen production infrastructure
- Biofuel capacity expansion
- Energy efficiency technology deployment
- Grid-scale energy storage systems
Financial Market Risk Pricing Mechanisms
Financial markets develop sophisticated pricing mechanisms for chokepoint closure risks, incorporating geopolitical assessments, insurance market signals, and macroeconomic impact projections. However, these mechanisms must also consider tariff market impact when evaluating comprehensive economic scenarios.
Derivatives Market Responses
Oil volatility premiums increase 200-400% during active chokepoint closure scenarios, reflecting elevated uncertainty in forward price projections. Currency impacts extend beyond energy markets as petrodollar recycling disruption affects USD strength relative to other major currencies.
Equity sector rotation becomes pronounced, with energy stocks surging while transportation and manufacturing sectors decline due to elevated input costs. Consequently, the correlation breakdown between traditional asset classes creates challenging portfolio management conditions for institutional investors.
Central Bank Coordination Requirements
Policy Response Mechanisms:
- Inflation targeting suspension to accommodate energy price shocks
- Enhanced swap lines between major central banks
- Banking sector stress testing for energy exposure
- Financial stability measure implementation
Central bank coordination becomes essential when energy price shocks threaten broader financial stability. The interconnected nature of global financial systems requires coordinated responses to prevent localised energy disruptions from generating systemic financial crises.
The next major ASX story will hit our subscribers first
Emergency Response Protocol Activation
International cooperation mechanisms activate automatically when supply disruptions reach predetermined thresholds, though effectiveness depends on maintained access to strategic reserves and alternative supply sources.
International Energy Agency Coordination
Collective Action Triggers:
- 30-day supply disruption threshold activation
- Member country strategic reserve release obligations
- Coordinated demand restraint measure implementation
- Transportation fuel allocation system deployment
The 60-day emergency release protocol requires careful coordination between member nations to ensure released volumes reach affected markets effectively. However, when chokepoints remain closed, strategic releases may provide limited immediate relief to import-dependent regions.
Regional Cooperation Frameworks
ASEAN Energy Security:
Joint procurement and sharing agreements enable smaller nations to maintain supply security during regional disruptions. Furthermore, enhanced cross-border energy flows between ASEAN members provide partial substitution for disrupted seaborne supplies.
EU Emergency Protocols:
Industrial priority allocation systems determine energy distribution during shortage periods, with essential services receiving allocation preference over discretionary industrial uses.
Private Sector Adaptation
Supply Chain Risk Management:
- Geographic risk distribution acceleration
- Just-in-time model shifts toward strategic stockpiling
- Contract restructuring with force majeure clauses
- Alternative sourcing agreement development
Private sector adaptation strategies evolve rapidly during extended disruptions, with companies implementing permanent changes to supply chain structures rather than temporary adjustments. These structural modifications persist beyond immediate crisis resolution, creating lasting changes in global trade patterns.
Tourism and Travel Industry Impact:
The regional travel and tourism industry loses an estimated $600 million per day during major disruptions, with total visitor spending losses projected between $34 billion and $56 billion annually. These losses reflect both direct transportation cost increases and reduced consumer confidence in affected regions.
Environmental Consequences:
Long-term environmental damage from infrastructure attacks includes massive oil spills, toxic smoke from burning refineries, and widespread contamination from damaged facilities. For instance, the U.S. military alone released nearly 2 billion metric tons of greenhouse gases in the initial days of the 2026 conflict, highlighting the environmental costs of energy supply disruptions.
The strait of Hormuz closure impact demonstrates how geographic chokepoints create systemic vulnerabilities in global energy security architecture. Understanding these complex interdependencies enables better preparation for future supply disruptions and more effective emergency response coordination when critical infrastructure becomes unavailable.
This analysis is based on publicly available market data and expert assessments. Energy market conditions remain subject to rapid change based on geopolitical developments and supply-demand dynamics. Readers should conduct independent research before making investment decisions in energy markets.
Are You Ready to Navigate Energy Market Volatility?
Discovery Alert's proprietary Discovery IQ model delivers real-time notifications on significant ASX mineral discoveries in the energy and resources sector, empowering subscribers to identify actionable opportunities before broader market reactions to supply disruptions and geopolitical events. During times of heightened market volatility, immediate access to discovery alerts can provide crucial positioning advantages for both short-term traders and long-term investors seeking to capitalise on emerging opportunities in the resources sector.