June 17, 2026
The Geography of Vulnerability: Why One Waterway Holds the Global Economy Hostage
Energy markets operate on the assumption of continuity. Traders, refiners, utilities, and governments build their planning around the uninterrupted flow of crude oil and liquefied natural gas through established corridors. That assumption rests on remarkably fragile physical infrastructure. Of all the world's maritime chokepoints, none concentrates more economic risk into a smaller geographic space than the Strait of Hormuz. Understanding the relationship between Strait of Hormuz closure and oil prices is no longer a theoretical exercise reserved for geopolitical risk analysts. It is one of the most consequential real-time variables in global commodity markets today.
When big ASX news breaks, our subscribers know first
Why the Strait of Hormuz Functions as a Global Energy Pressure Point
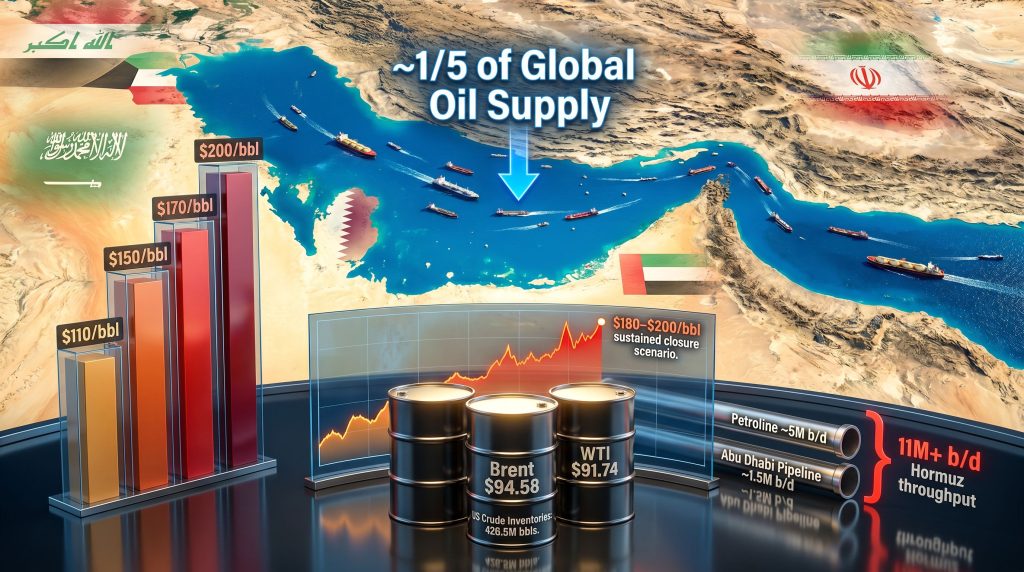
The strait sits between Iran to the north and the Oman peninsula to the south, connecting the Persian Gulf to the Gulf of Oman and ultimately the Arabian Sea. Its physical dimensions are almost absurdly mismatched with its economic importance. The navigable shipping channel narrows to just two miles wide in each direction at its tightest point, yet this corridor carries roughly one-fifth of the world's daily oil supply, equivalent to approximately 17 to 20 million barrels per day.
Beyond crude oil, the strait is also the sole maritime exit for Qatar's liquefied natural gas exports, making it a dual-commodity chokepoint with simultaneous leverage over both global oil benchmarks and gas markets. Furthermore, global LNG supply dynamics mean the nations whose export revenues depend on unobstructed passage — including Saudi Arabia, Iraq, Kuwait, the UAE, and Qatar — face uniquely concentrated risk. No other single waterway in the world concentrates this volume of economically critical energy flows.
What Closure Actually Looks Like in Practice
The term closure is frequently misunderstood in media coverage. A full closure involves direct military interdiction of commercial traffic, including credible threats of force against vessels attempting transit. Iran's top joint military command formally announced such a closure in June 2026, explicitly stating that any vessel attempting passage would be targeted.
A partial or effective closure, which had already been underway for months prior, works differently. It functions through elevated insurance premiums, war-risk surcharges, and voluntary rerouting decisions made by tanker operators and cargo owners who calculate that the cost and risk of transit outweigh the alternatives. Markets do not wait for a formal declaration to begin repricing. Credible escalation signals have historically moved Brent crude by several dollars per barrel within the first 24 to 48 hours.
The 1980s Tanker War provides useful historical context. During that conflict, attacks on vessels transiting the Persian Gulf created sustained market disruption and elevated insurance costs over nearly a decade, without ever achieving a complete halt to traffic. The lesson: partial disruption is commercially damaging even when the waterway technically remains open.
How Oil Markets Respond to Hormuz Escalation: The First 72 Hours and Beyond
The immediate market response to escalation events follows a predictable pattern, though the magnitude varies with the perceived credibility and duration of the threat. Consequently, understanding these patterns is essential for anyone monitoring crude oil price trends in the current environment.
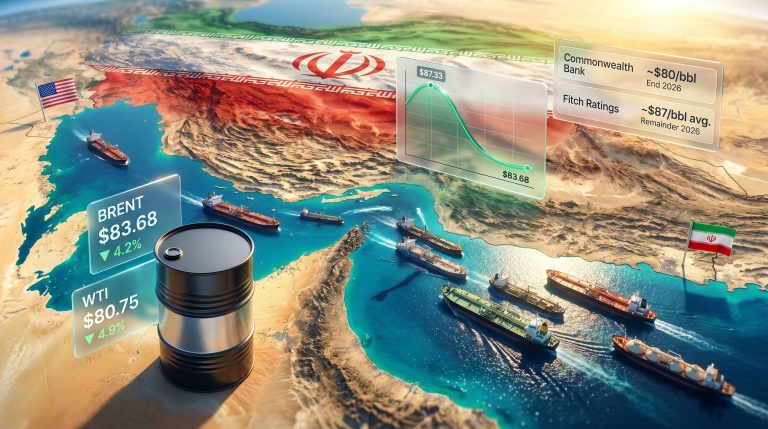
In active trading sessions tied to the June 2026 escalation, Brent crude futures rose $1.48 per barrel to $94.58, while WTI climbed $1.71 to $91.74. Earlier in the same session, US crude futures had surged more than $3 per barrel before partially retracing as traders assessed conflicting military statements. The US military confirmed on its official channels that commercial ships continued to transit the strait, even as Iran's state media reported missile and drone strikes targeting US vessels near the waterway.
This kind of intraday oil price volatility — where prices spike aggressively on headline risk and then partially correct on ground-truth information — reflects a fundamental feature of commodity markets during geopolitical crises. The direction of initial movement is nearly always higher; the question is magnitude and persistence.
Short-Term Price Scenarios Under Different Disruption Levels
| Disruption Severity | Estimated Brent Price Range | Approximate Supply Removed |
|---|---|---|
| Credible Threat / Partial Disruption | $90 to $110 per barrel | Insurance and rerouting costs only |
| Significant Flow Reduction | $120 to $150 per barrel | 5 to 8 million barrels per day |
| Full Closure, Short Duration | $150 to $170 per barrel | ~11 million barrels per day |
| Sustained Full Closure | $180 to $200 per barrel | Structural supply deficit |
The $200 per barrel threshold represents the outer boundary of sustained-closure scenario modelling. At that price level, demand destruction begins to act as a natural ceiling, but the economic damage during the transition is severe and broadly distributed.
The Supply Destruction Already Underway: Inventory Data Tells the Story
One of the most significant but underappreciated aspects of the current crisis is the degree to which supply destruction has already materialised before any formal full closure. The data from the US Energy Information Administration (EIA) illustrates this clearly.
In the week ending June 5, 2026, US crude inventories drew down by 7.2 million barrels to reach 426.5 million barrels. Analysts surveyed by Reuters had expected a draw of approximately 4 million barrels, meaning the actual drawdown was nearly double consensus expectations. That kind of inventory surprise, particularly on the downside, reinforces bullish price momentum in futures markets.
More strikingly, US crude inventories including strategic petroleum reserves have fallen by approximately 79 million barrels since active conflict began in late February 2026. The United States, operating as the world's largest crude producer, has been drawing on strategic reserves to compensate for supply gaps created by the effective closure of the strait. This represents a material depletion of emergency buffers that takes years to rebuild under normal replenishment conditions.
OPEC's Multi-Decade Production Low
Compounding the inventory picture, OPEC production in May 2026 fell to its lowest level in over two decades, according to Reuters survey data. In addition to OPEC's market influence being structurally constrained, two forces drove this collapse simultaneously:
- A US naval blockade directly curtailing Iranian crude exports, removing a significant supplier from global markets.
- Tehran's effective closure of the strait reducing shipment volumes from neighbouring Gulf producers who have no alternative export route.
This double supply shock is what makes the current scenario structurally different from past episodes. Removing Iran's exports alone would be manageable. Simultaneously constraining Saudi, Kuwaiti, and UAE exports through physical interdiction creates a volume gap that no single alternative can fill.
Alternative Routes: Why Bypass Infrastructure Cannot Solve the Problem
A common misconception is that pipeline alternatives can substantially offset a Hormuz closure. The reality is more constrained:
- Saudi Arabia's East-West Pipeline (Petroline): Maximum capacity of approximately 5 million barrels per day, providing the largest single bypass option.
- UAE's Abu Dhabi Crude Oil Pipeline: Operational capacity of approximately 1.5 million barrels per day, terminating at Fujairah on the Gulf of Oman.
- Combined bypass capacity: Roughly 6 to 7 million barrels per day against a potential closure-related shortfall of 11 or more million barrels per day.
The arithmetic leaves a structural gap of 4 to 5 million barrels per day with no near-term solution. Non-Gulf producers including US shale operators, Canadian oil sands producers, and Brazilian deepwater operators can theoretically increase output, but realistic incremental supply within a three to six month window amounts to perhaps 1 to 2 million barrels per day. This leaves a persistent deficit in any prolonged closure scenario, which is precisely what underpins the $150 to $200 price range in worst-case modelling.
The Downstream Cascade: Inflation, Monetary Policy, and Economic Growth
The consequences of sustained Strait of Hormuz closure and elevated oil prices extend well beyond crude benchmarks. The transmission mechanism into the broader economy operates across several layers.
Fuel Cost Transmission
For every $10 per barrel increase in crude prices, retail gasoline prices in the US typically rise by approximately $0.25 per gallon within two to four weeks. At $150 per barrel, the cumulative fuel cost increase relative to pre-conflict levels becomes economically significant for households, logistics operators, and aviation companies.
Inflationary Feedback
Sustained crude prices above $120 per barrel historically generate second-order inflation through multiple channels:
- Higher freight and transportation costs embedded in the price of consumer goods at every stage of the supply chain.
- Agricultural input cost increases, particularly for fertilisers derived from natural gas and machinery operating on diesel fuel.
- Utility price rises passed through to residential and commercial customers as power generators face higher fuel input costs.
Monetary Policy Dilemma
Central banks face a particularly difficult policy environment when oil-driven inflation coincides with economic stress. Raising interest rates to combat inflation risks further suppressing economic activity that is already disrupted by supply shocks. Holding rates steady risks allowing inflationary expectations to become entrenched. Neither option is clean.
The next major ASX story will hit our subscribers first
Regional Exposure: Who Bears the Greatest Risk
The asymmetry of exposure across regions is one of the less-discussed dimensions of a Hormuz disruption scenario.
| Country | Estimated Hormuz-Dependent Oil Imports | Key Vulnerability |
|---|---|---|
| Japan | ~85 to 90% of crude imports | Extremely limited alternative supply routes |
| South Korea | ~70% of crude imports | Petrochemical and manufacturing sector exposure |
| India | ~60 to 65% of crude imports | Fuel subsidy fiscal pressure and inflation |
| China | ~40 to 45% of crude imports | Refining capacity and strategic stockpile adequacy |
Asian economies face the most direct exposure given their structural dependence on Persian Gulf crude. European nations carry indirect but meaningful exposure through global Brent pricing benchmarks, which affect all crude regardless of geographic origin. The United States, as a net exporter, has some insulation but remains connected through domestic gasoline pricing and global price linkages that cannot be fully decoupled.
How Investors Should Think About the Three-Layer Risk Premium
Geopolitical risk premiums in oil markets are not monolithic. They operate across distinct timeframes and respond to different informational signals. Indeed, geopolitical oil shocks have historically demonstrated that understanding each layer is critical for accurate risk assessment.
- Immediate disruption premium: Priced within hours of credible escalation news. Reflects the direct probability of physical supply interruption. This component can be large but is also the most volatile and subject to rapid reversal if ground-truth information contradicts the threat.
- Duration uncertainty premium: Builds over days to weeks as conflict resolution timelines remain unclear. Becomes embedded in futures curves across near-term contracts. More persistent than the immediate premium.
- Structural vulnerability premium: Persists even after partial resolution. Reflects market recognition that the chokepoint remains contested and that insurance underwriters, shipping operators, and cargo owners continue to price in the probability of renewed disruption. This layer can persist for months.
Understanding which layer of the premium is driving price action at any given moment is critical for investors making positioning decisions in energy markets.
Historical Analogues and What They Suggest
| Historical Episode | Price Impact | Key Characteristic |
|---|---|---|
| 1973 Arab Oil Embargo | Prices quadrupled within months | Supply weaponisation; demand-side adjustment was slow |
| 1980 to 1988 Tanker War | Elevated prices with high volatility throughout | Persistent but incomplete disruption; no full closure |
| 2019 Tanker Attacks | ~15% Brent spike before retracing | Escalation without full closure; premium collapsed quickly |
| 2026 US-Iran Conflict | Active ongoing repricing | Combines military conflict, formal closure declaration, and SPR depletion |
The current environment most closely resembles a combination of all three historical analogues. However, the added complexity is that strategic petroleum reserves are being drawn down simultaneously, reducing the buffer capacity available to governments seeking to moderate prices.
Frequently Asked Questions: Strait of Hormuz Closure and Oil Prices
How much oil transits the Strait of Hormuz each day?
Approximately one-fifth of global daily oil supply, representing roughly 17 to 20 million barrels per day, moves through the strait. It is also the primary maritime export corridor for Qatari LNG, making it a dual-commodity chokepoint with no equivalent in global energy logistics.
What would a full Hormuz closure do to oil prices?
Based on current scenario modelling, a full and sustained Strait of Hormuz closure and oil prices could see Brent crude rise to between $170 and $200 per barrel within weeks to months, depending on the pace of strategic reserve deployment and the ability of non-Gulf producers to increase output.
Has the strait ever been fully closed before?
No sustained full closure has occurred in the modern era. The 1980s Tanker War caused significant disruption without halting traffic entirely. The current situation represents an unprecedented formal closure declaration by Iran, though physical enforcement remains contested.
How quickly do prices respond to escalation signals?
Oil markets typically respond within hours. Even credible threats without physical closure have historically moved Brent crude by $3 to $10 per barrel in single trading sessions. The June 2026 escalation saw intraday moves of more than $3 before partial retracement.
Are there any realistic alternatives if the strait is closed?
Existing pipeline bypass capacity totals approximately 6 to 7 million barrels per day. Against a potential shortfall of 11 or more million barrels per day, this leaves a structural gap of 4 to 5 million barrels per day that no combination of bypass infrastructure, strategic reserve releases, and non-Gulf production increases can fully bridge in the near term.
Key Takeaways for Understanding Hormuz Risk
- The strait's physical geography makes it irreplaceable in global energy logistics. No bypass infrastructure covers more than roughly half its throughput capacity.
- Oil price sensitivity to Hormuz disruption is asymmetric: escalation drives prices sharply and rapidly higher, while resolution-driven declines tend to be slower and less complete as structural risk premiums persist.
- Supply destruction is already measurable and significant. US inventories have fallen by 79 million barrels since late February 2026, and OPEC production has dropped to multi-decade lows under the combined pressure of the naval blockade and effective strait closure.
- Worst-case scenario modelling places Brent at $180 to $200 per barrel under sustained closure conditions, a range with severe downstream implications for inflation, monetary policy, and economic growth globally.
- Asian economies carry the greatest direct exposure, but no major economy is insulated from the price consequences of a disruption at this scale.
This article contains forward-looking scenario analysis and price projections based on publicly available market data and historical analogues. Such projections involve significant uncertainty and should not be interpreted as financial advice or a prediction of specific outcomes. Energy markets are subject to rapid and unpredictable change, and readers should conduct independent research before making investment decisions.
Want to Stay Ahead of the Next Major Commodity Market Shift?
When geopolitical shocks send energy and resource markets into turmoil, timing is everything — Discovery Alert's proprietary Discovery IQ model delivers real-time alerts on significant ASX mineral discoveries, instantly translating complex commodity data into actionable opportunities for investors at every level. Explore historic discovery returns on Discovery Alert's dedicated discoveries page and begin your 14-day free trial to position yourself ahead of the next major market move.