June 11, 2026
The World's Most Critical Energy Chokepoint: A Strategic Overview
Few geographic features carry as much weight in global commodity markets as a narrow waterway measuring just 33 kilometres at its tightest point. The Strait of Hormuz, positioned between the Omani coastline and the southern edge of Iran, functions as the singular exit valve for the Persian Gulf's vast hydrocarbon output. Understanding how the Strait of Hormuz closure and oil prices interact requires first appreciating the scale of what transits this corridor every single day.
Approximately 17 to 21 million barrels of crude oil, condensates, and refined petroleum products pass through the strait daily. This single passage accounts for roughly 20% of the world's total oil supply and approximately 25 to 30% of all seaborne oil trade globally. Furthermore, around 20% of global liquefied natural gas shipments also transit this corridor, making it equally critical for gas-dependent economies in East Asia and Europe. The implications for LNG supply markets are therefore enormous.
The strait connects the oil fields of Saudi Arabia, Iraq, Kuwait, the UAE, Qatar, and Iran to the rest of the world. Without it, those nations would need to rely entirely on overland pipelines and alternative port infrastructure, neither of which exists at anywhere near sufficient scale to compensate.
Critical Context: The Strait of Hormuz is not simply a preferred shipping route. It is the structural backbone of Persian Gulf hydrocarbon distribution. A sustained closure does not redirect supply flows; it eliminates them.
When big ASX news breaks, our subscribers know first
How a Strait of Hormuz Closure Transmits Into Oil Price Spikes
The Supply Shock Mechanism
When a physical closure occurs, the price transmission pathway operates on two simultaneous tracks. The first is the physical market, where refineries and end-users begin competing for available non-Gulf crude supplies, pushing spot prices higher as near-term availability shrinks. The second is the futures market, where traders reprice forward contracts almost instantaneously in response to perceived supply risk, often before a single barrel of physical supply is actually disrupted.
This dual-track repricing is why oil price spikes during geopolitical chokepoint events frequently appear to overshoot what pure supply-demand fundamentals would suggest. Trader psychology and speculative positioning amplify the initial price signal, sometimes adding a $10 to $30 per barrel geopolitical risk premium on top of what the physical balance alone would justify. The impact of trade wars on oil prices demonstrates a similar dynamic, where market sentiment often outruns underlying fundamentals.
Historical analogues help frame the magnitude of risk. During the 1973 Arab Oil Embargo, supply disruptions of approximately 5 million barrels per day contributed to a roughly 400% increase in oil prices over several months. The 1980 to 1988 Iran-Iraq War tanker conflict produced sustained insurance cost surges, freight rate explosions, and persistent volatility across global crude benchmarks, even though the strait was never fully sealed. A modern full closure, affecting far greater daily volumes in a tighter global inventory environment, would carry consequences that dwarf either precedent.
Analyst Price Forecasts Across Closure Scenarios
| Scenario | Estimated Brent Price Range | Projected Timeframe |
|---|---|---|
| Threat-only / partial restriction | $85 to $100 per barrel | Immediate to 2 weeks |
| Full closure, short duration (days) | $120 to $150 per barrel | Within days of closure |
| Sustained full closure (months) | $180 to $200 per barrel | End-2026 projection |
| Diplomatic reopening | $75 to $90 per barrel | Normalisation within weeks |
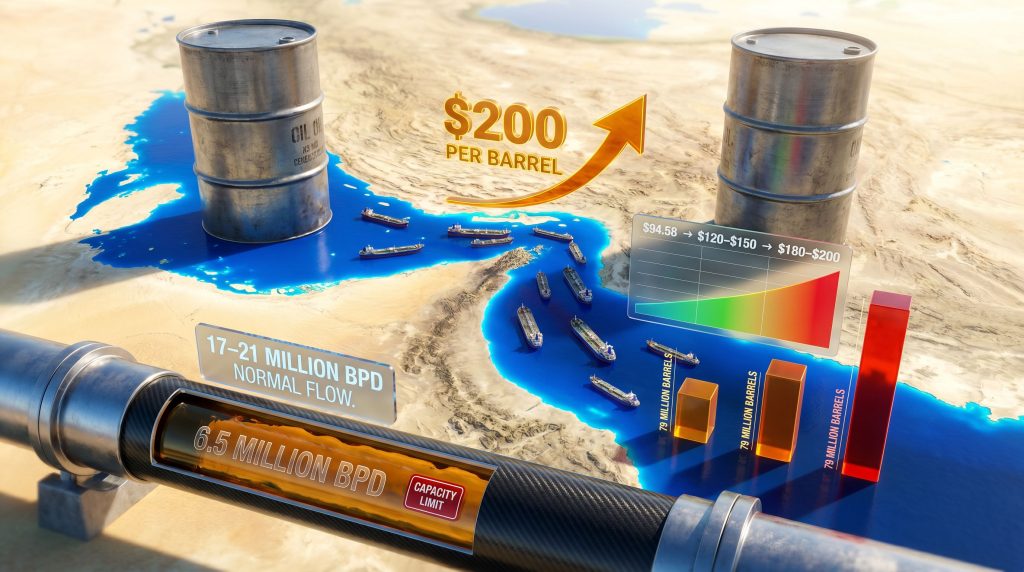
Wood Mackenzie analysis indicates Brent crude could approach $200 per barrel by end-2026 if the strait remains largely closed. Under a rapid full-closure scenario, prices in the $120 to $150 per barrel range are considered achievable within days, according to multiple commodity analyst projections. For a broader picture of where current crude oil prices stand heading into this crisis, the baseline context is essential.
Disclaimer: Price forecasts carry inherent uncertainty and are subject to rapid revision based on geopolitical developments, diplomatic outcomes, and supply-side responses. These figures represent analytical scenarios, not guaranteed outcomes.
Current Conflict Escalation and Its Immediate Market Impact
The June 2026 Escalation Timeline
The current crisis traces its origins to the outbreak of hostilities on February 28, 2026, when a fragile regional equilibrium collapsed. A ceasefire reached in early April 2026 temporarily paused direct military exchanges, but that pause has since broken down comprehensively.
On June 11, 2026, US forces launched additional strikes against multiple targets inside Iran beginning at 5:15 p.m. EDT (21:15 GMT). This triggered Iran's top joint military command to formally declare the Strait of Hormuz closed to oil tankers and all commercial shipping, with an explicit warning that any vessel attempting transit would be engaged militarily.
In response to the renewed escalation:
- Brent crude futures rose $1.48 (1.59%) to $94.58 per barrel as of early June 11, 2026 trading
- WTI crude climbed $1.71 (1.90%) to $91.74 per barrel in the same session
- Intraday WTI futures spiked more than $3 per barrel in early morning trading before partially retracing
ING analysts described the situation by noting that the renewed confrontation makes a near-term diplomatic agreement appear increasingly distant, and that severely constrained energy flows from the Persian Gulf should now be treated as a structural pricing input rather than a temporary risk premium. This framing is significant: markets are beginning to price the supply disruption as a persistent condition rather than a short-term spike.
The US military did confirm, via its official communications channel, that commercial vessels were continuing to transit the strait as of Wednesday, June 11, and that no US warships had been struck, contradicting Iranian state media reports of successful missile and drone strikes against vessels near the waterway. However, oil prices surging on Hormuz fears remain a dominant market theme regardless of the ground truth.
Quantifying the Supply Destruction Already Underway
Inventory Drawdowns Since February 2026
The market impact of the Strait of Hormuz closure and oil prices is no longer purely theoretical. The physical supply destruction has been accumulating for months, reflected most clearly in US crude inventory data.
| Metric | Figure |
|---|---|
| Total US crude drawdown since Feb 28, 2026 | 79 million barrels |
| Weekly draw (week ending June 5, 2026) | 7.2 million barrels |
| Current US crude inventory level | 426.5 million barrels |
| Analyst consensus expectation for weekly draw | 4 million barrels |
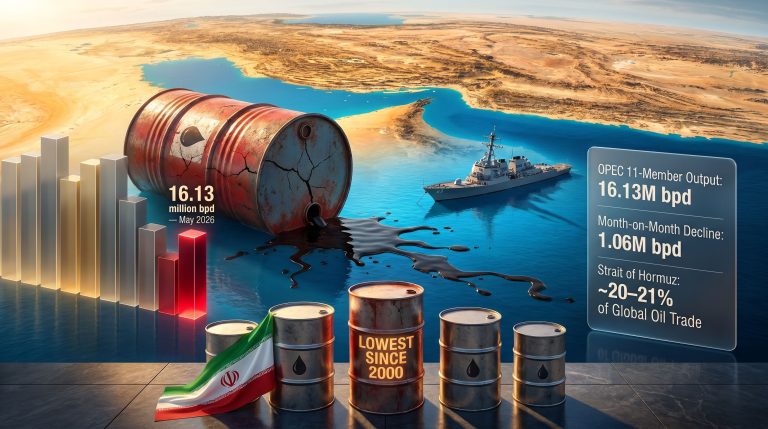
| OPEC output trend (May 2026) | Lowest level in over 20 years |
The weekly EIA draw of 7.2 million barrels for the week ending June 5, 2026 was nearly double the analyst consensus expectation of 4 million barrels, signalling that the supply squeeze is intensifying rather than stabilising. The cumulative 79-million-barrel drawdown since the conflict began in late February reflects both the physical elimination of Gulf export volumes and the US domestic production response attempting to compensate.
Adding further gravity to the supply picture, OPEC output in May 2026 fell to its lowest level in over two decades, according to Reuters survey data. This decline was driven by two concurrent forces: a US naval blockade suppressing Iranian export capacity, and Iran's effective closure of the strait reducing the export capacity of other Gulf producers who also rely on Hormuz for maritime access. Consequently, OPEC's influence on global oil markets has rarely been more acutely felt than in the current environment.
Which Nations and Sectors Face the Greatest Exposure
Asia-Pacific Import Dependency
The geographic concentration of Hormuz-dependent demand is heavily skewed toward Asia. Japan, South Korea, India, and China collectively source the overwhelming majority of their crude oil imports through this corridor. For Japan and South Korea specifically, 70 to 90% of crude import volumes transit Hormuz, leaving both economies structurally exposed with minimal short-term diversification options.
India's vulnerability is compounded by the subcontinent's limited near-term alternative supply infrastructure. Unlike China, which has been systematically expanding its strategic petroleum reserve capacity and diversifying supply relationships, India's import infrastructure remains heavily oriented toward Gulf crude grades that move through Hormuz.
China's strategic petroleum reserve drawdown capacity does provide a partial buffer, but it is a finite resource. Repeated drawdowns reduce the buffer available for subsequent disruptions, making each successive crisis more difficult to absorb.
Downstream Price Contagion
Crude price spikes do not remain confined to oil markets. The transmission into refined products typically occurs within two to six weeks, as refiners pass through higher feedstock costs into diesel, jet fuel, and gasoline pricing.
| Sector | Impact at $120/bbl | Impact at $180 to $200/bbl |
|---|---|---|
| Aviation | Significant margin compression | Route cancellations, carrier financial stress |
| Shipping and Logistics | Elevated freight rates | Supply chain disruption and cost pass-through |
| Petrochemicals | Input cost surge | Production curtailments |
| Automotive | Accelerated EV demand shift | Demand destruction for combustion-engine vehicles |
| Emerging Market Economies | Currency pressure and inflation | Sovereign debt crisis risk in oil-importing nations |
| Oil Producing Nations | Windfall revenues | Amplified geopolitical leverage |
European industrial and residential consumers face meaningful diesel and heating oil exposure, while US gasoline prices have already begun rising in response to current price levels. The aviation sector, which spent years recovering post-pandemic margins, faces a particularly acute threat at $150+ crude. In addition, the oil price rally under Trump tariffs had already introduced volatility prior to the current escalation, compounding existing market stresses.
Pipeline Bypass Capacity and Its Critical Limitations
The Infrastructure Gap
Two primary pipeline alternatives exist for moving Gulf crude without using Hormuz:
- Saudi Arabia's East-West Pipeline (Petroline): Capacity of approximately 5 million barrels per day, running from the Eastern Province to the Red Sea port of Yanbu
- Abu Dhabi Crude Oil Pipeline (ADCOP): Capacity of approximately 1.5 million barrels per day, terminating at Fujairah on the Gulf of Oman
Combined, these pipelines offer roughly 6.5 million barrels per day of bypass capacity. The strait, under normal conditions, carries 17 to 21 million barrels per day. Even at full simultaneous utilisation, the bypass infrastructure covers less than 40% of normal strait throughput.
The Substitution Myth: Pipeline bypass is frequently cited as a mitigation tool, but the arithmetic does not support the narrative. No combination of available alternative infrastructure can absorb the volume normally transiting Hormuz. There is no logistical substitute for an open strait.
Strategic Petroleum Reserve Constraints
The US SPR has already absorbed significant drawdowns in the current crisis, with the 79-million-barrel cumulative decline since February 2026 materially reducing the buffer available for sustained emergency release. International Energy Agency member nations collectively hold approximately 1.2 to 1.5 billion barrels in accessible strategic storage, theoretically providing 60 to 90 days of coverage at current drawdown rates, assuming coordinated release and no additional supply disruptions elsewhere. Both assumptions carry substantial uncertainty.
US shale production can respond to price signals, but meaningful output increases require three to six months of lead time due to drilling, completion, and infrastructure constraints. West African and North Sea producers offer partial swing capacity, but neither region can replace Gulf volumes at scale or speed.
The next major ASX story will hit our subscribers first
What $150 to $200 Oil Would Mean for the Global Economy
Historical Precedent and Recession Modelling
The 2008 oil price spike to $147 per barrel contributed materially to the demand destruction and financial system stress that culminated in the global financial crisis. A sustained $150+ environment today would arrive against a backdrop of already elevated debt levels, post-pandemic monetary tightening, and fragile consumer balance sheets across major economies.
IMF and World Bank sensitivity frameworks suggest that each $10 per barrel sustained increase in oil prices reduces global GDP growth by approximately 0.1 to 0.2 percentage points. Under a $180 to $200 per barrel scenario sustained over multiple quarters, the cumulative GDP drag could reach 1.5 to 3 percentage points, sufficient to tip multiple economies into contraction.
Central banks face an acute dilemma: energy-driven inflation would conventionally warrant tighter monetary policy, but rate increases into a demand-destruction environment risk compounding the economic damage. The stagflationary dynamics of the 1970s oil shocks serve as the historical warning template. Bloomberg's detailed analysis of an Iran war and Hormuz closure oil shock provides further depth on how these macro-financial dynamics could unfold.
The Energy Transition Paradox
Sustained high oil prices create a contradictory dynamic for the energy transition. On one hand, they accelerate investment in renewable energy and electric vehicles by widening the cost differential with fossil fuels. On the other hand, they incentivise new hydrocarbon development at a scale that locks in production infrastructure for decades, potentially extending the fossil fuel era beyond what climate modelling assumes.
This paradox is particularly acute for emerging market nations, which face the immediate inflation and debt service pressures of expensive oil while lacking the capital to rapidly deploy renewable alternatives.
Frequently Asked Questions: Strait of Hormuz Closure and Oil Prices
How much oil passes through the Strait of Hormuz each day?
Approximately 17 to 21 million barrels of oil and petroleum products transit daily, representing roughly 20% of global supply and 25 to 30% of all seaborne oil trade.
What would oil prices reach if the strait closed completely?
Analyst projections suggest Brent crude could reach $120 to $150 per barrel within days of a full closure. A prolonged blockade extending across months could push prices toward $180 to $200 per barrel by late 2026, based on Wood Mackenzie forecasting scenarios.
Has the Strait of Hormuz ever been fully closed before?
No full and successful closure has occurred in modern history. During the Iran-Iraq War tanker conflict of the 1980s, the strait was heavily threatened and commercial shipping faced severe insurance and safety risks, but physical closure was never fully achieved.
How long could global markets absorb a complete Hormuz closure?
IEA member strategic reserves theoretically provide 60 to 90 days of buffer at current drawdown rates, though this assumes coordinated international release mechanisms and no simultaneous supply disruptions in other producing regions.
Which countries are most exposed to a sustained closure?
Japan, South Korea, India, and several Southeast Asian economies source 70 to 90% of their crude imports through the strait, making them structurally the most vulnerable to prolonged disruption.
Does a pipeline bypass exist?
Yes, but with severe capacity limitations. Saudi Arabia's Petroline and Abu Dhabi's ADCOP together provide approximately 6.5 million barrels per day, covering less than 40% of normal strait throughput.
Geopolitical Endgame: Pathways to Resolution or Escalation
Diplomatic Scenarios
A negotiated resolution would require formalising ceasefire conditions between Washington and Tehran, almost certainly involving third-party mediators. Qatar and Oman have historically served as backchannels between the two governments, and multilateral diplomatic frameworks remain the most viable pathway to a durable reopening of the strait.
The critical variable is the negotiating posture of both sides. The Trump administration has publicly stated preconditions for halting strikes, while Tehran's decision to formally announce a strait closure represents an escalation in leverage rather than a concession. The gap between stated positions remains wide, and as ING analysts note, current signals suggest a deal remains some considerable distance away.
Market Stabilisation Asymmetry
One underappreciated dynamic is the asymmetry of price response between closure and reopening. When a major chokepoint closure is announced, prices spike rapidly as traders front-run the physical shortage. When reopening is announced, price normalisation is typically slower and incomplete, as the market must verify that flows have actually resumed, insurance markets need to reprice, and shipping companies must assess vessel safety before committing tonnage to the route.
This asymmetry means that even a successful diplomatic resolution would likely leave oil prices structurally elevated for weeks to months after the physical strait reopens, as the market rebuilds confidence and depleted inventories gradually recover.
Investor Consideration: Markets historically reprice closure risk faster than reopening relief. Traders and energy sector investors should account for this asymmetric response profile when constructing scenario-based positioning. This article does not constitute financial advice.
Key Takeaways
- The Strait of Hormuz carries approximately 20% of global oil supply, making it the single most consequential energy chokepoint on earth
- US crude inventories have declined 79 million barrels since the conflict began on February 28, 2026, reflecting real and measurable supply destruction
- Brent crude is currently trading near $94.58 per barrel, with consensus analyst warnings pointing to $120 to $150 per barrel in a full closure scenario and up to $200 per barrel in a prolonged disruption
- OPEC output in May 2026 fell to its lowest level in over two decades, amplifying the underlying supply squeeze
- Combined pipeline bypass infrastructure covers less than 40% of normal strait throughput, confirming there is no adequate logistical alternative
- Resolution depends on diplomatic breakthroughs, military de-escalation, and coordinated SPR deployment, all of which carry material uncertainty and no guaranteed timeline
Disclaimer: This article presents analytical scenarios and market data for informational purposes only. It does not constitute financial or investment advice. All price forecasts are subject to rapid revision based on evolving geopolitical, diplomatic, and supply-side conditions. Readers should consult qualified financial and energy market professionals before making investment decisions.
Want To Capitalise On The Next Major Commodity Discovery Before The Market Moves?
While energy market volatility driven by geopolitical chokepoints dominates headlines, Discovery Alert's proprietary Discovery IQ model continuously scans ASX announcements in real time, instantly identifying significant mineral discoveries across 30+ commodities and delivering actionable alerts to subscribers before the broader market reacts — explore historic discovery returns on the Discovery Alert discoveries page and begin your 14-day free trial today to secure a genuine market-leading edge.