July 16, 2026
The Geography of Concentrated Risk: Why One Waterway Holds the Global Economy Hostage
Global commodity markets are built on an assumption so deeply embedded it rarely surfaces in boardroom discussions or central bank models: that the physical infrastructure connecting producers to consumers will remain functional. That assumption is currently being stress-tested at the world's most consequential maritime chokepoint, the Strait of Hormuz, where a Strait of Hormuz commodity disruption is exposing the extraordinary fragility of supply chains spanning energy, agriculture, industrial manufacturing, and the materials underpinning the green economy.
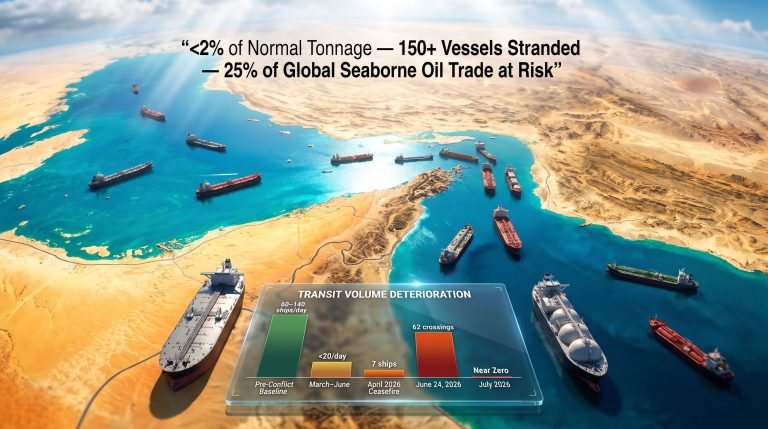
What makes this Strait of Hormuz commodity disruption categorically different from previous Gulf tension episodes is not simply its scale, though the scale is unprecedented. It is the simultaneous compression of multiple, interconnected supply systems at a moment when global inventories are thin, alternative supply routes are constrained, and the insurance markets underpinning commercial shipping have effectively withdrawn coverage from the affected corridor.
Understanding the full economic fallout requires moving well beyond the crude oil price chart that dominates financial media coverage. At least nine distinct commodity categories face structural supply stress, and the transmission mechanisms connecting energy prices to food security, chemical manufacturing, and battery materials are operating in parallel rather than sequentially.
The Physical Constraints That Make Rerouting Structurally Impossible at Scale
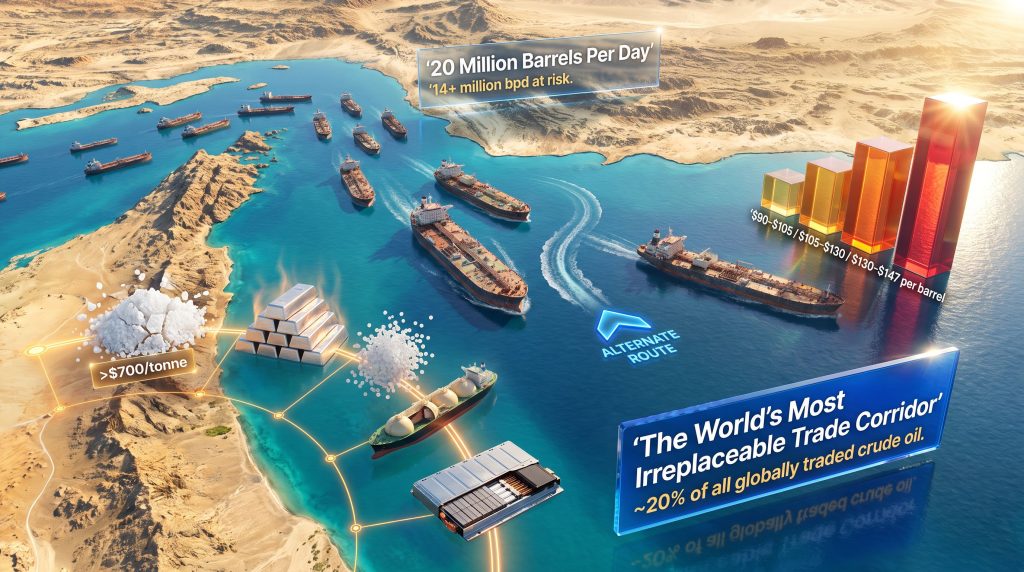
The strait itself spans roughly 33 kilometres at its narrowest navigable point, but commercial traffic is further constrained by separation schemes that divide inbound and outbound lanes, with buffer zones reducing effective working width considerably. Under normal conditions, approximately 20 million barrels per day of crude oil transit this passage, representing close to 20% of all globally traded crude and roughly one-fifth of total world oil supply.
The exporting nations feeding this flow include Saudi Arabia, Iraq, the UAE, Kuwait, Iran, and Qatar, collectively accounting for the overwhelming majority of Persian Gulf output. Roughly 80% of Hormuz-transiting crude is bound for Asian markets, with Japan, South Korea, China, and India representing the largest volume importers. This directional concentration matters enormously: unlike European buyers who retain meaningful access to Atlantic Basin suppliers and Norwegian production, Asian importers have structurally fewer short-term substitution pathways.
No alternative pipeline network or maritime route exists that could absorb full volume displacement at comparable speed. The Iraq-Turkey pipeline and the Saudi East-West pipeline provide partial relief options, but their combined throughput capacity falls far short of the volumes at risk under a sustained closure scenario.
Disruption Severity Framework: Translating Volume Loss Into Price Consequences
Analysts and energy economists have developed scenario-based frameworks for quantifying the relationship between transit volume reduction and crude price response. The following table presents the principal scenario tiers currently being modelled across commodity markets:
| Scenario | Estimated Daily Barrels Lost | Projected Brent Range | Assumed Duration |
|---|---|---|---|
| Partial disruption (10-30% reduction) | 2-6 million bpd | $90-$105/barrel | Days to weeks |
| Sustained partial closure | 8-10 million bpd | $105-$130/barrel | Weeks to months |
| Effective full closure | 14+ million bpd | $130-$147/barrel | Months or longer |
The current disruption trajectory, as characterised by the International Energy Agency, involves the removal of more than 14 million barrels per day from accessible global supply — a scale of shock with no direct modern historical parallel. The 1973-74 oil embargo removed roughly 4-5 million bpd. The 1979 Iranian Revolution disrupted approximately 5-6 million bpd. The present scenario, if sustained, represents a multiple of those historical disruptions.
Furthermore, oil price movements in the current environment are being amplified by pre-existing trade war pressures, creating compounding volatility that extends well beyond the immediate corridor.
Critical perspective: Previous Gulf disruption episodes produced market shocks that were severe but ultimately self-limiting because physical transit was never fully interrupted. The current situation differs because commercial insurance withdrawal, rather than physical blockade alone, is creating the effective closure. This insurance dynamic is poorly understood outside specialist shipping circles and significantly changes the recovery calculus.
When big ASX news breaks, our subscribers know first
Beyond Crude Oil: Mapping the Full Commodity Stress Cascade
The instinct to frame Hormuz disruption as an oil price story reflects a narrow analytical lens. Energy markets capture headlines, but the deeper and in some ways more consequential disruptions are unfolding across agricultural inputs, industrial chemicals, and the material supply chains feeding manufacturing sectors from automotive to pharmaceuticals. According to analysis from the World Economic Forum, at least nine commodity categories face material exposure beyond crude oil alone.
LNG and the Asian Energy Security Paradox
Approximately 20% of globally traded liquefied natural gas transits the Strait of Hormuz under normal conditions, with Qatar representing the dominant origin point. Qatar's position as a top-tier LNG exporter makes it uniquely exposed to any sustained disruption: its customers in Japan, South Korea, China, and India depend on seaborne deliveries that have no immediate land-based alternative.
The secondary market effect is equally significant. As Asian buyers compete for Atlantic Basin cargoes, European LNG markets absorb repricing pressure from the demand surge. Spot LNG premiums under a 90-day closure scenario would likely reach levels not seen since the acute European energy crisis of 2022-23. The broader LNG supply outlook for 2025 was already under pressure before this disruption, and the current crisis has materially accelerated supply-side stress.
The timeline sensitivity here is critical and underappreciated: LNG cargo commitments operate on multi-week lead times, meaning the full pricing impact of sustained disruption takes one to two months to fully transmit into spot markets.
The Fertilizer Crisis Hidden Inside an Energy Conflict
Between 30% and 33% of all globally traded fertilizers move through the Strait of Hormuz, sourced primarily from Gulf producers including Iran, Saudi Arabia, and Qatar. This figure tends to be absent from mainstream commentary, yet its implications for global food security are potentially more severe and longer-lasting than the direct energy price shock.
Urea prices from Middle Eastern origins have already surged approximately 40%, with spot prices reported above $700 per tonne against a pre-disruption benchmark of around $500 per tonne. Modelling exercises suggest nitrogen fertilizer costs could double if the disruption extends beyond three months. In addition, the United States' fertilizer import reliance means North American agricultural sectors are far from insulated from these pricing pressures.
| Fertilizer Type | Pre-Disruption Benchmark | Current Estimated Range | Doubling Scenario Trigger |
|---|---|---|---|
| Urea (Middle East origin) | ~$500/tonne | >$700/tonne | 90+ day closure |
| Ammonia | Moderate baseline | Elevated spot premiums | Sustained production curtailment |
| Nitrogen compounds (broad) | Stable | Rising 20-40% | Extended strait closure |
The food security transmission mechanism operates through a sequential but compounding chain: fertilizer price inflation raises farm input costs, which reduces planted area or application rates, which suppresses crop yields in the following one to two growing seasons, generating food price inflation that hits import-dependent lower-income nations with the greatest severity.
A non-obvious but critical timing factor is the planting season constraint. Farmers who cannot secure fertilizer supplies before the planting window closes face yield losses that cannot be recovered within the same production cycle, regardless of how quickly prices subsequently normalise.
Industrial Supply Chains Under Pressure: Aluminium, Methanol, and Petrochemicals
Aluminium: Energy Cost Transmission Into Metal Pricing
Gulf region aluminium smelters are among the world's most energy-intensive industrial operations, relying on natural gas feedstocks that originate within or transit through the disrupted zone. Rising gas input costs are transmitting directly into aluminium production cost structures, and the downstream exposure spans automotive, aerospace, packaging, and construction sectors globally.
When energy costs rise by 30-40%, the entire cost structure of Gulf aluminium production reprices upward, creating a floor under global aluminium prices regardless of demand conditions. Non-Gulf smelters in China, Canada, and Norway can absorb some market share, but their collective capacity expansion timeline is measured in years, not months.
Methanol and Petrochemical Feedstocks
Middle Eastern methanol production represents a significant portion of global seaborne supply. Methanol is a critical feedstock for formaldehyde production, acetic acid synthesis, and fuel blending applications including marine bunker fuels. Supply tightening at the origin point transmits almost immediately into global methanol spot markets.
The chlor-alkali and vinyls sectors are experiencing parallel tightening as regional conflict disrupts feedstock availability underpinning polyvinyl chloride production. PVC is a foundational material in construction, plumbing, and electrical insulation, sectors where demand is relatively price-inelastic in the short term, meaning cost increases transmit to end-users with limited absorption.
| Sector | Key Materials Affected | Primary Disruption Mechanism | Downstream Industry Impact |
|---|---|---|---|
| Petrochemicals | Methanol, sulfur, aromatics | Feedstock supply reduction | Plastics, adhesives, coatings |
| Chlor-alkali/Vinyls | Ethylene dichloride, caustic soda | Regional production disruption | PVC, construction materials |
| Polymers | Polyethylene, polypropylene | Feedstock and freight cost increase | Packaging, automotive, consumer goods |
| Battery materials | Graphite, precursor chemicals | Transit disruption | EV batteries, grid storage |
| Pharmaceuticals | Active ingredient precursors | Supply chain rerouting delays | Healthcare supply chains |
The Green Transition Paradox: Battery Materials Through a Geopolitical Flashpoint
Perhaps the most structurally ironic dimension of the current disruption is its impact on the materials supply chain for the energy transition. Graphite, battery raw materials, and related critical materials face transit disruptions through the same corridor that the transition is theoretically designed to reduce dependence upon. Electric vehicle manufacturing timelines and battery cell production costs are being affected by a geopolitical crisis rooted in fossil fuel economics. This feedback loop between the old energy system and the new one is rarely acknowledged in transition planning frameworks.
The Insurance Withdrawal That Created a Commercial Closure
Critical Market Dynamic: The strait has become effectively impassable for standard commercial shipping not solely because of physical threat, but because war risk insurance has been withdrawn by major underwriters. Without valid coverage, vessels cannot legally complete voyages under standard charter agreements, creating a de facto commercial blockade that operates independently of whether the physical channel remains open.
War risk insurance premium surges have rendered standard commercial transit economically unviable across the Persian Gulf. Seafarer welfare organisations and maritime labour unions have separately flagged crew safety concerns, further constraining vessel availability as operators weigh reputational and legal exposure against commercial opportunity.
Reports suggest a small number of vessels are transiting under arrangements involving the Iranian Revolutionary Guard Corps (IRGC), creating extraordinary compliance, sanctions, and legal risks for any connected operator, financier, or insurer. Protection and Indemnity clubs, along with hull underwriters, are reassessing their entire Persian Gulf book as the risk calculus shifts from incident-specific to systemic.
Cape of Good Hope Rerouting: The Cost and Capacity Reality
Adding the Cape of Good Hope routing extends transit time by approximately 10 to 14 days and adds an estimated 15 to 25% to freight costs above pre-disruption baselines. For VLCC and LNG carriers, already operating at elevated utilisation rates on extended routes, scheduling pressure is compounding. Port congestion risk is emerging at alternative transit hubs as rerouted volumes concentrate through facilities not designed to absorb the displaced throughput.
India's styrene trade flows provide a concrete example: sourcing and delivery patterns have already shifted measurably, with Indian petrochemical manufacturers facing a dual squeeze of higher input costs and extended supply lead times. As Jefferies has warned, the combination is structurally more damaging than either factor in isolation.
Stagflation Risk: The Macroeconomic Transmission Mechanism
The conditions created by a sustained Strait of Hormuz commodity disruption align closely with the classic stagflationary framework: supply-driven price inflation across energy, food, and industrial goods occurring simultaneously with demand destruction that suppresses economic output. Central banks facing this combination encounter a genuine policy dilemma, as the inflation signal calls for tightening while the growth signal argues for easing.
The sequential transmission mechanism operates as follows:
- Energy price spikes raise production costs across all manufacturing sectors simultaneously
- Fertilizer price surges transmit into food price inflation within one to two planting cycles, affecting consumer budgets globally
- Chemical and polymer cost increases feed through to consumer goods pricing with a lag of one to three months
- Central banks face conflicting signals: suppressing inflation requires tightening, but demand destruction argues for accommodation
- Emerging market economies with dollar-denominated commodity import bills face simultaneous currency depreciation and debt stress as the import cost burden escalates
At $130 to $147 per barrel, natural demand destruction in price-sensitive markets begins to function as a partial price ceiling. Industrial buyers accelerate fuel-switching and efficiency investments under sustained high prices, and recessionary demand compression partially offsets supply-side pressure. This self-limiting dynamic does not eliminate the stagflationary episode but shortens its acute phase.
| Economy Type | Primary Exposure Channel | Stagflation Risk Level |
|---|---|---|
| Asian net oil importers (Japan, South Korea, India) | Energy import bill surge | High |
| Sub-Saharan African food importers | Fertilizer and food price inflation | Very High |
| European industrial manufacturers | Energy and chemical feedstock costs | Moderate to High |
| Gulf Cooperation Council exporters | Revenue windfall but infrastructure disruption | Mixed |
| US domestic producers | Partial insulation via domestic production; export opportunity | Low to Moderate |
Three Post-Crisis Scenarios: What Markets Could Look Like After Resolution
Scenario 1: Rapid De-escalation Within 60 Days
Markets reprice relatively quickly as physical transit resumes, though structural inventory-building behaviour persists longer than the disruption itself. Insurance markets implement permanent Persian Gulf risk premium adjustments, meaning the era of pre-conflict insurance pricing does not return. Opportunistic diversification investments begin across buyer portfolios, but wholesale supply chain reconfiguration does not occur at scale.
Scenario 2: Prolonged Disruption Over Three to Six Months
Permanent rerouting of a meaningful portion of Gulf LNG and crude flows becomes established practice rather than emergency response. Investment accelerates into alternative supply sources including US LNG export capacity expansion, East African gas development, and Australian LNG contracting. Furthermore, the broader geopolitical mining landscape is being permanently reshaped as buyers accelerate diversification away from single-corridor dependency.
Scenario 3: Extended Structural Closure Beyond Six Months
Asian energy import portfolios undergo fundamental reconfiguration. Emergency acceleration of renewable energy deployment and grid-scale storage investment occurs across import-dependent nations as energy security overrides cost optimisation in policy frameworks. Fertilizer supply chains diversify away from Gulf producers on a permanent basis, with lasting implications for which nations become the dominant nitrogen exporters of the 2030s.
| Commodity | Best Alternative Sources | Substitution Capacity | Activation Timeline |
|---|---|---|---|
| Crude oil | US shale, West Africa, North Sea | Partial (3-5 million bpd) | 3-6 months |
| LNG | US Gulf Coast, Australia, East Africa | Limited short-term | 6-18 months |
| Urea/Nitrogen fertilizers | Eastern Europe, North Africa, Southeast Asia | Limited | 3-6 months |
| Methanol | US, China domestic production | Partial | 2-4 months |
| Aluminium | China, Canada, Norway smelters | Moderate | Immediate to 3 months |
The next major ASX story will hit our subscribers first
Frequently Asked Questions: Strait of Hormuz Commodity Disruption
What percentage of global oil supply transits the Strait of Hormuz?
Under normal operating conditions, approximately 20% of all globally traded crude oil, equivalent to roughly 20 million barrels per day, transits the strait. This makes it the single most critical maritime chokepoint in the global energy system, with no alternative route capable of absorbing equivalent volumes at comparable speed.
How high could oil prices go under an extended closure?
Scenario modelling under sustained closure conditions projects Brent crude reaching $130 to $147 per barrel, depending on disruption duration and the pace of strategic reserve releases by IEA member nations. These are scenario projections rather than price targets, and actual outcomes depend heavily on geopolitical resolution timelines and demand-side responses.
Which commodities beyond oil face serious supply risk?
At least nine distinct commodity categories face significant disruption, encompassing LNG, urea and nitrogen fertilizers, ammonia, aluminium, methanol, sulfur, petrochemical feedstocks including olefins and polymers, battery precursor materials, and pharmaceutical active ingredient precursors.
Why does rerouting around the strait not resolve the problem?
While the Cape of Good Hope route is physically navigable, it adds 10 to 14 days to voyage times and 15 to 25% to freight costs. More critically, war risk insurance withdrawal has made standard commercial transit financially and legally unviable for most operators, creating an effective commercial closure that persists regardless of whether physical passage remains theoretically open.
Which regions carry the greatest economic exposure?
Asian net oil and LNG importers, particularly Japan, South Korea, India, and China, face the most direct energy cost exposure. Sub-Saharan African nations dependent on fertilizer imports face acute and potentially multi-season food security risks. European industrial manufacturers face elevated chemical feedstock and energy input costs with limited short-term substitution flexibility.
Does this disruption create stagflationary conditions?
Sustained disruption creates the precise conditions associated with stagflation: supply-driven inflation across energy, food, and industrial goods occurring alongside demand destruction that suppresses growth. Emerging market economies carrying dollar-denominated commodity import obligations face the most acute combined pressure from currency stress, rising import costs, and weakening domestic demand.
Disclaimer: Price forecasts, scenario projections, and duration assumptions presented in this article reflect analytical scenario modelling and published market intelligence. They do not constitute investment advice and are subject to material revision as geopolitical conditions evolve. Readers should conduct independent analysis before making financial or commercial decisions based on any projected commodity price ranges or supply disruption timelines.
From Chokepoint to System Failure: Reframing What This Crisis Actually Means
The persistent tendency to frame Hormuz disruption as an oil price story systematically underestimates both the breadth of economic exposure and the duration of structural consequences. What is unfolding is better understood as a multi-system stress event, where energy markets, agricultural input chains, industrial chemical supply networks, and the material flows supporting the energy transition are all experiencing simultaneous compression.
The lasting structural legacy of this disruption is likely to include:
- A permanent Persian Gulf risk premium embedded in insurance, shipping, and commodity pricing models
- An accelerated diversification of Asian energy import portfolios away from single-corridor dependency
- A reconfiguration of global fertilizer supply architecture with long-term implications for food security
- A sobering recognition that the green energy transition's material supply chains run through exactly the same geopolitical flashpoints as the fossil fuel system they are designed to replace
Supply chain resilience, long discussed as a strategic priority in corporate boardrooms and government policy papers, is no longer theoretical. It has become commercially urgent in a way that will reshape investment decisions, trade policy, and infrastructure planning well beyond the eventual resolution of the current crisis.
For further market intelligence on commodity disruption scenarios and energy supply chain analysis, the Argus Media analytics team provides ongoing coverage of how key commodity groups are responding to Strait of Hormuz commodity disruption, available at argusmedia.com.
Want to Capitalise on the Market Opportunities Emerging From Global Commodity Disruptions?
Discovery Alert's proprietary Discovery IQ model scans ASX announcements in real time, instantly identifying high-potential mineral discoveries across critical commodities — from battery materials to industrial metals — that stand to benefit from supply chain reconfiguration and surging commodity prices. Explore how historic ASX mineral discoveries have generated extraordinary returns and begin your 14-day free trial today to position yourself ahead of the broader market.