August 5, 2026
The Architecture of Vulnerability: How the World's Most Critical Shipping Lane Became a Near-Total Blockade
Few systems in global commerce are as deceptively fragile as the world's energy supply chain. Decades of optimisation for efficiency have quietly eroded redundancy, leaving the entire architecture exposed to failure at a handful of geographic pinch points. No single location embodies this fragility more completely than the Strait of Hormuz shipping traffic corridor, a narrow waterway separating the Arabian Peninsula from Iran, through which a staggering share of the world's daily energy consumption has historically flowed without interruption.
The events of 2026 have transformed that assumption permanently. What was once treated as a theoretical risk scenario in energy security planning has become an operational reality. Consequently, the consequences are reshaping freight markets, petrochemical supply chains, and global gas pricing in ways that will take years to fully unwind.
When big ASX news breaks, our subscribers know first
Why the Strait of Hormuz Occupies an Irreplaceable Position in Global Energy Infrastructure
To understand the severity of the current disruption, it helps to place the Strait of Hormuz within the broader hierarchy of maritime chokepoints. The world's major energy transit corridors include the Strait of Malacca, the Bab-el-Mandeb, the Suez Canal, and the Turkish Straits. Each carries strategic importance, and each has experienced periodic disruption. However, none of them shares the defining characteristic that makes Hormuz structurally unique: the complete absence of any large-scale bypass capable of absorbing its full commercial throughput.
When the Suez Canal is closed, as it was briefly in 2021 following the grounding of the Ever Given, cargo routes are extended but trade continues around the Cape of Good Hope. When the Bab-el-Mandeb becomes dangerous, as occurred during the Houthi missile campaign, tankers reroute through longer passages. These disruptions are costly and disruptive, but they are fundamentally logistical problems with logistical solutions.
Hormuz offers no such escape valve. A full closure does not redirect trade. It eliminates it.
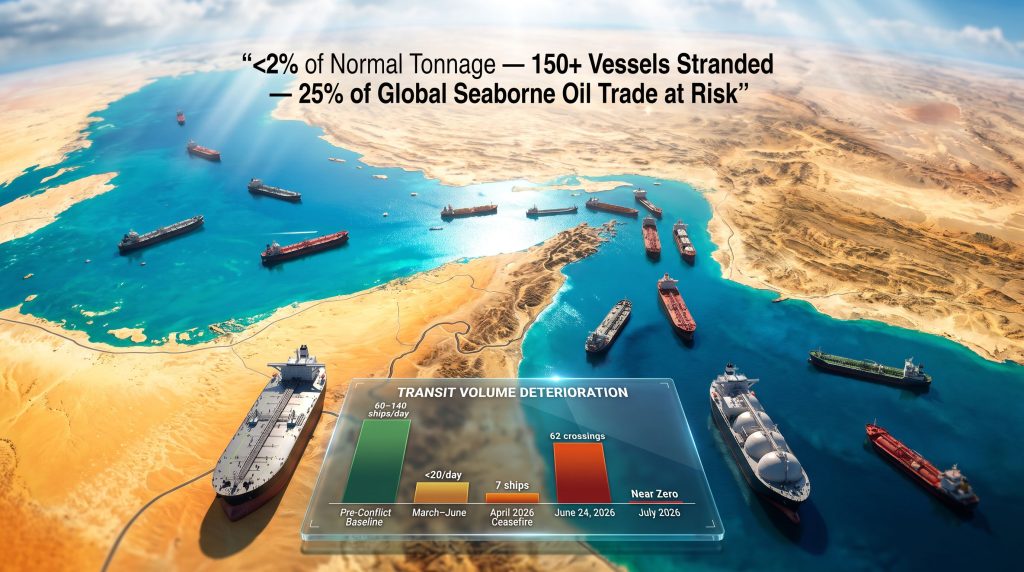
Under normal operating conditions, the strait handled approximately 20% of global oil consumption and accounted for roughly 25% of total seaborne oil trade, according to analysis published by the U.S. Energy Information Administration. Daily transit volumes under pre-conflict conditions ranged between 60 and 140 vessel crossings per day, carrying crude oil, liquefied natural gas, LPG, refined products, and general cargo. The concentration of energy exports from Qatar, the UAE, Kuwait, Iraq, and Saudi Arabia that depend on this passage makes it categorically different from any other chokepoint on Earth. Furthermore, understanding the broader oil price movements associated with this disruption is essential for grasping the full scale of the crisis.
Mapping the Collapse: Strait of Hormuz Shipping Traffic From February to July 2026
The timeline of how Strait of Hormuz shipping traffic deteriorated from a functioning global artery into a near-total blockade is both rapid and instructive.
The sequence began in late February 2026, when U.S. and Israeli military operations targeting Iran triggered a declaration from Iran's Islamic Revolutionary Guard Corps that passage through the strait was no longer permitted. The effective commercial closure took hold on February 28, 2026, trapping a significant number of vessels inside the Gulf and cutting off outbound laden tankers from reaching their destinations.
What followed was not a clean, sustained closure but a series of volatile partial reopenings and re-closures that have been arguably more damaging to market confidence than a straightforward blockade. The brief reopening on April 21, 2026, followed by immediate re-closure just 24 hours later, established the pattern: diplomatic gestures generating transit activity, followed swiftly by renewed hostilities eliminating it.
The table below captures the trajectory of Strait of Hormuz shipping traffic across the key phases of the crisis:
| Period | Approximate Daily Transits | Throughput vs. Normal Baseline |
|---|---|---|
| Pre-Conflict Baseline | 60-140 ships/day | 100% |
| Early March to Mid-June 2026 | Fewer than 20 ships/day | Less than 15% |
| April 21 Ceasefire Window | Approximately 7 ships per 24-hour period | Less than 10% |
| June 20, 2026 (Partial Recovery) | 25 ships | Approximately 18-40% |
| June 24, 2026 (Brief Surge) | 62 crossings recorded | Approximately 45-100% range |
| Last Three Weeks to Mid-July | 20-50 ships/day, two days at 80+ | 15-60% range |
| July 2026 (Current Status) | Near zero | Less than 2% of normal tonnage |
The June 17 U.S.-Iran memorandum of understanding created genuine market optimism. A noticeable accumulation of ballast LNG carriers was observed entering the Persian Gulf in anticipation of stronger exports. Those expectations did not materialise. The subsequent escalation of hostilities, including the July 7 attack on Qatar's Al Rekayyat Q-Flex LNG carrier and July 14 strikes on two UAE-linked VLCCs, effectively ended the recovery window before it could establish itself.
Commodities analysts at Hartree Partners observed that the last three weeks of transits had ranged between 20 and 50 vessels per day, with two days recording figures at or above 80. While that represents a marked improvement over the sub-20 daily figures recorded between early March and mid-June, it remains dramatically below the 120 to 140 vessels per day that characterised normal pre-conflict operations. For a broader crude oil market overview, these figures place the current disruption in sharp historical context.
The 150+ Stranded Vessel Problem
Among the least-discussed consequences of the strait closure is the accumulation of stranded commercial shipping. More than 150 vessels became trapped following the February 28 effective closure, unable to transit outward into open ocean. These include:
- VLCCs (Very Large Crude Carriers) loaded with crude oil
- Suezmax and Aframax tankers carrying refined products
- LPG carriers serving Pacific Basin markets
- Container ships carrying manufactured goods
- Bulk carriers transporting raw commodities
The backlog itself has created secondary logistics crises as port facilities and anchorage zones within the Gulf absorb vessels that have nowhere to go. Some operators have managed to extract their vessels through brief transit windows using a shuttle-and-transfer model, but a significant residual backlog persists. Real-time vessel positions can be monitored through tools such as Marine Vessel Traffic, which provides live tracking of activity in the strait.
How Vessel Traffic Has Been Structured During Partial Reopening Windows
The composition of what little Strait of Hormuz shipping traffic has managed to transit reveals the prioritisation logic that has emerged under the current crisis. According to analysis from Hartree Partners, roughly one-third of transits during partial reopening periods have involved crude oil carried aboard VLCCs, Suezmax, and Aframax tankers. Product tankers have accounted for approximately four to six vessels per day, while LPG carriers have typically contributed just one vessel per day on active transit days.
Bulk carriers have ranged from three to seven per day, container ships from three to five per day, and miscellaneous vessel categories have added a further four to eleven transits daily during active windows.
A particularly notable feature of recent transit patterns is the directional imbalance. Outbound vessels have consistently outnumbered inbound traffic, primarily because the backlog of laden crude carriers that accumulated inside the Gulf since February 28 has been working its way out during each available window.
How Has the VLCC Shuttle Model Emerged?
The VLCC shuttle model that has emerged deserves specific attention. VLCC counts have reached nine to ten vessels on peak days, operating a circuit that involves transiting out of the Gulf laden with crude, completing ship-to-ship (STS) transfers in safer waters outside the strait, and then returning inbound for additional cargo loads. The operators willing to run this circuit are almost exclusively state-owned enterprises or sovereign-linked operators, accepting risk profiles that private commercial shipowners have declined.
This bifurcation of the tanker market into two tiers, state-operated vessels accepting transit risk versus privately-owned fleets refusing entry, represents a structural shift with lasting consequences for insurance markets, freight pricing benchmarks, and global tanker fleet deployment patterns.
Energy Aspects analysts have noted that the focus during recent partial openings has been on prioritising VLCCs through the U.S.-guided Omani southern route, while the northern route has delivered inconsistent and unreliable results. In addition, the LNG supply outlook for the broader region has deteriorated significantly as a direct result of these constraints.
How the Petrochemical Industry Is Being Gutted by Gulf Supply Disruption
The petrochemical sector is absorbing some of the most acute downstream pain from the Hormuz disruption, and the mechanism operates through feedstock supply rather than finished product markets.
Under normal pre-conflict conditions, five to ten LPG carriers per day departed the Gulf region, predominantly heading toward Pacific Basin destinations to supply Asian petrochemical crackers with the feedstocks they require for ethylene, propylene, and other critical chemical building blocks. LPG and naphtha sourced from Gulf producers have historically offered Asian crackers competitive economics that underpin the entire regional petrochemical cost structure.
That supply has been reduced to an intermittent trickle. During most days of the recent partial transit windows, zero LPG carriers departed the Gulf. On occasional days, a single vessel managed to transit. Only on rare instances were three to four departures recorded within a single day. The consequence for Asian cracker operators is not merely a supply shortage but a planning crisis.
Energy Aspects analysts have described the drop and inconsistency of naphtha and LPG flows as making it extremely difficult for Asian cracker operators to schedule production, with most alternative sourcing options requiring significantly longer shipping distances from the United States at considerably higher freight costs.
When feedstock arrival windows become unpredictable by days or even weeks, downstream production scheduling transforms from an optimisation challenge into an economically irrational exercise. Crackers face the compounding problem of not just scarcity, but structural uncertainty in supply timing.
The Escalating Risk Architecture: What Recent Attacks Signal
The attack pattern evolving within the Hormuz conflict zone carries implications that extend beyond the immediate shipping disruption. Two incidents in July 2026 have materially altered the risk calculus for all commercial operators in the region.
The July 7 strike on Qatar's Al Rekayyat Q-Flex LNG carrier was significant specifically because the vessel had disabled its AIS transponder, a measure that had previously been assumed to reduce targeting risk by reducing vessel identifiability. The attack demonstrated that AIS transponder status no longer provides meaningful protection.
The July 14 dual strikes on UAE-linked VLCCs reinforced a further conclusion: nationality-linked vessels are no longer treated as lower-risk targets by the parties conducting attacks. The combination of these two incidents has eroded the final layers of assumed protection that commercial operators had been relying on to assess whether transit was viable. Moreover, the geopolitical oil risks feeding into this environment have compounded pricing uncertainty across global energy markets.
Rystad Energy's vice president of gas and LNG research has noted publicly that even low-profile transits are no longer insulated from risk, and that the sustained erosion of confidence in strait security is causing markets to price in the prospect of more prolonged supply disruptions rather than a near-term return to normalcy. Global gas prices have firmed over the week preceding mid-July 2026 as this repricing has progressed.
Satellite tracking data has become an increasingly critical tool for energy market participants attempting to monitor real-time transit activity when official information is limited. The IMF PortWatch platform offers one such resource, providing data-driven insights into port and chokepoint traffic that traders and analysts have increasingly relied upon. However, the effectiveness of AIS-based monitoring is structurally compromised when vessels disable their transponders, creating gaps in the data picture that trading desks and commodity analysts must account for.
The next major ASX story will hit our subscribers first
Frequently Asked Questions: Strait of Hormuz Shipping Traffic
How many ships normally pass through the Strait of Hormuz each day?
Under normal pre-conflict operating conditions, approximately 60 to 140 vessels transited the Strait of Hormuz daily. This volume represented roughly 20% of global oil consumption and 25% of total seaborne oil trade, according to the U.S. Energy Information Administration.
Is the Strait of Hormuz currently open or closed to shipping?
As of July 2026, the strait is effectively closed to standard commercial shipping. Transit volumes have collapsed to near zero, representing less than 2% of normal daily deadweight tonnage. The standard pre-war commercial shipping lane remains physically obstructed by mines, and recent attacks on vessels including those with disabled AIS transponders have severely deterred commercial operators.
What happened to ships already in the Gulf when the strait closed?
More than 150 vessels became stranded following the effective closure on February 28, 2026. Some have extracted themselves through brief transit windows using shuttle-and-transfer operations, but a significant backlog persists.
Which vessel types have been prioritised during partial reopening windows?
VLCCs carrying crude oil have been prioritised, particularly through the Omani southern route. LPG carriers and container ships have had the least consistent access, with most days recording zero LPG departures from the Gulf.
How is the closure affecting LNG markets?
The disruption has heavily impacted LNG flows from Qatar and the UAE. Qatar has not dispatched an LNG vessel since the July 7 attack on the Al Rekayyat. Only one UAE LNG vessel completed a full transit following that incident, based on Rystad Energy satellite tracking data. Global gas prices have firmed in response. Furthermore, the broader oil price impacts rippling outward from this disruption are reinforcing bearish sentiment across interconnected commodity markets.
Long-Term Structural Implications: Is the World Prepared?
The Hormuz crisis has exposed gaps in global energy infrastructure planning that decades of efficiency-focused investment have left unaddressed. No pipeline bypass exists with the capacity to absorb full Hormuz throughput. LNG supply chains have insufficient redundancy for a Gulf-origin disruption of this scale. Strategic petroleum reserves were designed to buffer short-term supply shocks, not multi-month chokepoint closures.
The nations most exposed to sustained Strait of Hormuz shipping traffic disruption are concentrated in the Asia-Pacific region. Japan, South Korea, China, and India collectively represent the largest importers of Gulf energy transiting through Hormuz, and each faces compounding vulnerability as both crude and LPG supplies are disrupted simultaneously.
The geopolitical recalibration underway extends beyond the immediate crisis. The emergence of a two-tier tanker market, the repricing of Hormuz transit risk into long-term insurance and freight structures, and the demonstrated failure of diplomatic frameworks to sustain normalisation all point toward a world in which energy security planning must account for Strait of Hormuz shipping traffic disruption as a recurring rather than exceptional scenario.
Key Takeaways: Strait of Hormuz Shipping Traffic at a Glance
| Dimension | Key Finding |
|---|---|
| Current Transit Volume | Near zero, less than 2% of normal tonnage |
| Normal Daily Baseline | 60-140 vessels per day |
| Stranded Vessels | More than 150 ships |
| Highest Recent Single-Day Count | 62 crossings recorded on June 24, 2026 |
| LPG Carrier Departures (Current) | 0-1 per day versus 5-10 pre-conflict |
| LNG Status | Qatar and UAE dispatches effectively suspended |
| Primary Active Transit Route | Omani southern route (limited capacity) |
| Global Oil Trade Share at Risk | Approximately 25% of seaborne oil trade |
| Market Confidence Indicator | Global gas prices firming; normalisation expectations receding |
Disclaimer: This article contains forward-looking analysis, scenario projections, and market assessments drawn from analyst commentary and publicly available data as of mid-July 2026. These projections involve inherent uncertainty and should not be construed as investment advice. Geopolitical situations of this nature are subject to rapid and unpredictable change. Readers should consult independent financial and energy market advisors before making decisions based on this analysis.
Want to Stay Ahead of Commodity Market Disruptions Like the Hormuz Crisis?
When energy supply chains fracture and commodity markets reprice rapidly, Discovery Alert's proprietary Discovery IQ model delivers real-time alerts on significant ASX mineral discoveries — instantly identifying actionable opportunities across more than 30 commodities as the broader market is still catching up. Explore historic examples of major discovery returns or start your 14-day free trial today to position yourself ahead of the next major market shift.