
July 14, 2026
The current geopolitical tensions surrounding critical maritime energy corridors have thrust the Strait of Hormuz crisis impact on oil prices into sharp focus for market analysts and policymakers worldwide. Recent developments demonstrate how quickly established energy flows can halt when insurance mechanisms withdraw coverage from high-risk transit zones, effectively rendering legally open waterways commercially inaccessible. This dynamic illustrates the complex relationship between physical infrastructure, financial risk management, and geopolitical stability in maintaining global energy supply chains.
How Does the Strait of Hormuz Function as the World's Most Critical Energy Chokepoint?
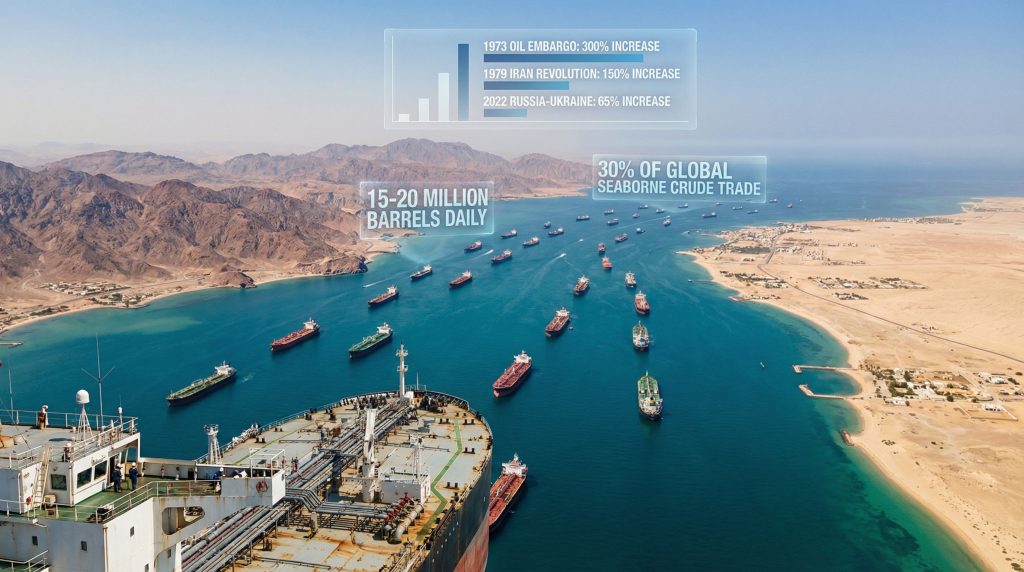
The Strait of Hormuz represents the most concentrated vulnerability point in global petroleum distribution infrastructure, handling approximately 15 million barrels per day of crude oil transit. This volume represents nearly 30 percent of global seaborne crude trade and roughly 15 percent of total global oil supply, according to energy market analysts. Furthermore, the geographical concentration creates an unprecedented single point of failure in international energy networks.
Geographic Strategic Importance and Traffic Volume Analysis
The strait's strategic significance extends beyond crude oil to encompass 20 percent of global liquefied natural gas supply, creating dual exposure for energy markets dependent on Middle Eastern production. The waterway maintains three navigable channels measuring approximately 33 nautical miles at its narrowest point, with sophisticated maritime piloting requirements for the largest tanker vessels.
Technical constraints prevent bypass routing through alternative shallow-water passages, as most vessel classes lack the specialised modifications required for such diversions. Consequently, the strait's operational characteristics create natural bottleneck conditions that concentrate risk across multiple energy commodity streams simultaneously.
Daily Throughput Statistics: Oil, LNG, and Refined Products
Primary energy flows through the Strait of Hormuz encompass three distinct commodity categories:
• Crude oil exports: 15 million barrels daily, primarily destined for Asian refineries
• Refined petroleum products: Approximately 5-8 million barrels daily equivalent
• Liquefied natural gas: Significant volumes representing one-fifth of global LNG trade
• Petrochemical feedstocks: Industrial inputs for downstream manufacturing
The concentration of these flows creates compounding effects during disruption events, as multiple energy sectors face simultaneous supply constraints. Unlike other chokepoints that primarily affect single commodity types, the Strait of Hormuz crisis impact on oil prices demonstrates how disruptions impact the entire energy complex.
Economic Dependencies of Major Oil-Importing Nations
Asian economies demonstrate the highest exposure to Strait of Hormuz supply disruptions, with several nations importing over 80 percent of petroleum needs through this corridor. The dependency structure creates asymmetric vulnerability patterns across different geographical regions, whilst Europe maintains greater supply diversity through pipeline networks and alternative shipping routes.
Historical precedent suggests that oil-importing nations maintain strategic reserves designed to offset supply disruptions lasting 60-90 days. However, the concentrated nature of Strait dependencies means that coordinated reserve releases become essential for market stability during extended closures.
| Region | Strait Dependency | Alternative Sources | Strategic Reserve Days |
|---|---|---|---|
| East Asia | 85% | Russia, North Sea | 90-120 |
| Europe | 25% | North Sea, Russia | 60-90 |
| North America | 15% | Domestic, Canada | 180+ |
| India | 75% | Venezuela, Russia | 45-60 |
When big ASX news breaks, our subscribers know first
What Are the Immediate Market Mechanisms Driving Oil Price Volatility?
Energy market pricing operates through distinct mechanisms during geopolitical crisis events, with initial responses reflecting risk premium incorporation rather than fundamental supply-demand recalibration. The March 2026 events demonstrated these dynamics through immediate repricing of geopolitical risk assumptions that had previously weighted such disruptions as improbable. Additionally, understanding oil price movements amid trade wars provides valuable context for these market dynamics.
Risk Premium Calculations in Commodity Trading
Market analysts projected Brent crude prices jumping $20 per barrel from Friday's closing price of $73 to Monday opening ranges of $93-95, representing rapid geopolitical risk premium integration. This price movement reflected fear-based premium incorporation rather than measured fundamental analysis, as market participants lacked real-time information about disruption duration.
The distinction between risk premium pricing and fundamental supply shortage responses becomes critical during crisis events. Initial price gaps reflect uncertainty and worst-case scenario planning, whilst sustained price levels depend on actual supply disruption measurements and replacement capacity mobilisation.
J.P. Morgan analysts had initially maintained base case assumptions that unprecedented Strait of Hormuz disruptions would remain improbable, acknowledging that this assumption failed when vessel transit slowed to near-complete stoppage for the first time in modern maritime history.
Backwardation Patterns and Forward Curve Adjustments
Futures market backwardation steepened dramatically from approximately $5 per barrel to $10-15 per barrel, creating financial incentives for immediate supply delivery rather than inventory storage. This backwardation pattern signals market expectations that supply constraints will ease over time, with near-term scarcity commanding premium pricing.
The forward curve adjustment pulled the entire price structure upward, with 12-month contract prices resetting into the low-$70s range. In addition, this curve movement reflects rapid reassessment of both near-term supply risk and duration expectations, as market participants incorporate extended disruption scenarios into pricing models.
Insurance Market Responses and Coverage Withdrawals
Insurance market mechanisms created the proximate cause of the March 2026 supply disruption, as underwriters withdrew coverage for vessels transiting the Strait of Hormuz within 24 hours of military escalation. This contractual action rendered the waterway commercially inaccessible despite remaining legally open under international maritime law.
The insurance withdrawal mechanism demonstrates how financial risk management protocols can create supply disruptions independent of physical blockades or military action. Market analysts noted that tanker rates and insurance costs represent only minor components of total oil price impacts during sustained flow curtailments.
Price Impact Timeline Analysis
| Disruption Duration | Brent Crude Range | Primary Market Driver |
|---|---|---|
| 1-3 days | $80-85/barrel | Initial risk premium incorporation |
| 1-2 weeks | $85-100/barrel | Supply shortage anticipation |
| 3+ weeks | $100-120/barrel | Production shut-in from storage limits |
| Extended closure | $120+/barrel | Strategic reserve coordination |
Which Alternative Supply Routes Can Mitigate Global Energy Shortfalls?
Middle Eastern oil producers maintain limited infrastructure capacity for bypassing Strait of Hormuz transit routes, creating structural constraints on supply diversification during crisis periods. The existing alternative transportation networks can accommodate only a fraction of normal throughput volumes, leaving substantial supply gaps during extended closures.
Saudi Arabia's East-West Pipeline Capacity Limitations
Saudi Arabia's East-West pipeline system provides the largest alternative route capacity, handling approximately 5 million barrels per day through connections to Red Sea export terminals. This infrastructure represents roughly one-third of normal Strait transit volumes, leaving significant supply shortfalls during complete closures.
The pipeline system requires operational lead time for capacity ramping and faces technical constraints during maximum utilisation periods. Moreover, Red Sea shipping routes currently experience their own security challenges, potentially limiting the effectiveness of this bypass option during regional conflict scenarios.
UAE Abu Dhabi Pipeline Infrastructure Assessment
The United Arab Emirates operates pipeline infrastructure with approximately 1.5 million barrels per day capacity for diverting production away from Strait-dependent export terminals. This secondary bypass route provides additional supply diversification but remains insufficient for replacing full Strait throughput.
Combined Saudi and UAE pipeline capacity totals roughly 6.5 million barrels per day, leaving a potential 8-10 million barrel daily shortfall during complete Strait closures. This infrastructure gap creates the mathematical foundation for severe supply shortages and corresponding oil price crash dynamics.
Cape of Good Hope Routing: Cost and Time Implications
Vessels diverted around the Cape of Good Hope face additional transit times of 10-14 days compared to Strait of Hormuz routing, creating delays in supply delivery and reducing effective tanker fleet capacity. The extended voyage requirements effectively remove shipping capacity from global markets through longer turnaround cycles.
Additional voyage costs include fuel consumption increases, crew expenses, insurance adjustments, and port scheduling complications. These cost factors translate into higher delivered petroleum prices independent of underlying commodity pricing adjustments.
Critical Infrastructure Assessment: Current Middle Eastern bypass pipeline capacity totals approximately 6.5 million barrels per day through Saudi and UAE systems, creating a potential 8-10 million barrel daily supply shortfall during complete Strait of Hormuz closures.
Cape routing also concentrates increased traffic through South African waters, potentially creating secondary bottleneck conditions during peak diversion periods. Port capacity limitations and vessel scheduling conflicts could compound supply chain disruptions beyond the initial Strait closure impacts.
How Do Strategic Petroleum Reserves Factor into Crisis Response Strategies?
Global strategic petroleum reserves represent the primary mechanism for offsetting supply disruptions during extended Strait of Hormuz closures, with International Energy Agency member nations maintaining combined reserves theoretically capable of supplying global markets for 60-90 days. However, release coordination and logistics present significant operational challenges during crisis periods.
Global SPR Capacity and Release Mechanisms
Strategic petroleum reserve deployment operates through coordinated release mechanisms designed to stabilise markets during supply emergencies. The United States maintains the world's largest strategic reserve system, with additional significant holdings across Europe and Asia providing regional supply security.
Reserve release effectiveness depends on both storage capacity and distribution infrastructure capabilities. Furthermore, reserves located far from affected markets may provide limited short-term relief due to transportation constraints, whilst regional reserves offer more immediate supply augmentation potential.
Historical Precedents: IEA Coordinated Actions
Previous International Energy Agency coordinated reserve releases during the 1991 Gulf War, 2005 Hurricane Katrina, and 2011 Libya crisis provide operational precedents for crisis response protocols. These historical examples demonstrate both the potential effectiveness and practical limitations of reserve deployment strategies.
The 2022 coordinated release following Russia-Ukraine conflict represented the largest strategic reserve deployment in IEA history, totalling over 200 million barrels across multiple nations. This precedent establishes frameworks for large-scale coordinated responses to geopolitical supply disruptions, particularly relevant to current energy security strategies.
Economic Effectiveness of Reserve Deployments
Strategic reserve releases demonstrate varying effectiveness based on market conditions, disruption scale, and coordination timing. Successful deployments typically achieve price moderation rather than complete price suppression, as markets continue pricing residual supply risk premiums.
The economic impact of reserve releases extends beyond immediate price effects to include inventory replacement costs and reduced future security margins. Nations must balance current crisis response against potential future disruption scenarios when determining optimal release volumes.
What Are the Broader Macroeconomic Consequences of Sustained Energy Disruptions?
Sustained energy supply disruptions create cascading effects throughout global economic systems, with inflation transmission mechanisms extending far beyond direct fuel cost increases. The modern economy demonstrates reduced oil intensity compared to historical periods, yet remains vulnerable to supply shocks through interconnected manufacturing and transportation networks.
Inflation Transmission Mechanisms Across Sectors
Energy cost increases propagate through multiple economic channels, beginning with direct transportation and heating expenses before affecting manufacturing input costs, agricultural production, and service sector operations. The speed of inflation transmission varies across sectors, with immediate impacts in transportation-intensive industries and delayed effects in service sectors.
Modern economic analysis suggests that oil prices would need to exceed $200 per barrel to create economic disruption equivalent to the 1973 oil embargo. However, the pace and scale of price increases matter more than absolute price levels for economic impact assessment.
Central Bank Policy Response Frameworks
Central banks face complex policy trade-offs during energy-driven inflation episodes, balancing supply shock accommodation against inflation expectations management. Traditional monetary policy tools prove less effective against supply-side inflation, creating challenges for conventional economic stabilisation approaches.
Interest rate policy responses to energy shocks risk amplifying economic disruption through demand destruction mechanisms that extend beyond energy sectors. Consequently, central bank communication strategies become critical for managing inflation expectations and preventing secondary price spiral effects.
GDP Impact Modelling for Oil-Dependent Economies
Economic impact modelling indicates that oil price increases above $100 per barrel create measurable GDP impacts across developed economies, with effects varying based on domestic energy production and consumption patterns. Oil-importing nations face direct current account pressures, whilst oil-exporting regions may experience offsetting revenue benefits.
The relationship between oil prices and GDP growth demonstrates non-linear characteristics, with modest price increases creating manageable economic adjustments. However, extreme price movements trigger broader economic disruption through multiple transmission channels.
Economic Impact Assessment Framework
• Direct effects: Transportation, heating, industrial input costs
• Secondary effects: Manufacturing cost adjustments, service sector impacts
• Tertiary effects: Consumer spending patterns, investment decision changes
• Financial effects: Currency adjustments, inflation expectations, monetary policy responses
Which Industries Face the Most Severe Supply Chain Disruptions?
Energy-intensive industries demonstrate the highest vulnerability to Strait of Hormuz supply disruptions, with petrochemical manufacturing, aviation, and maritime shipping sectors facing direct operational impacts. These industries lack short-term substitution alternatives and require sustained supply flows for normal operations.
Petrochemical Manufacturing Dependencies
Petrochemical production facilities rely on consistent feedstock supplies that become constrained during crude oil supply disruptions, creating cascading effects through plastic, synthetic materials, and chemical manufacturing sectors. Many petrochemical plants cannot easily switch between different feedstock types without significant operational adjustments.
Global petrochemical supply chains demonstrate high geographical concentration, with Middle Eastern production facilities representing significant portions of global capacity. Supply disruptions in these regions create worldwide shortages across multiple industrial sectors simultaneously.
Aviation Fuel Supply Chain Vulnerabilities
Commercial aviation demonstrates extreme sensitivity to jet fuel supply disruptions and price volatility, with fuel costs representing 20-30 percent of airline operating expenses. Limited fuel type substitution possibilities create operational constraints during supply shortages.
Airport fuel storage capacity provides only short-term supply security, typically maintaining 3-7 days of inventory under normal consumption patterns. Extended supply disruptions quickly exhaust local storage, forcing flight cancellations and route adjustments.
Maritime Shipping Cost Escalation Analysis
Maritime shipping industry costs escalate dramatically during energy supply crises through both fuel expense increases and charter rate adjustments reflecting supply-demand imbalances. Container shipping rates demonstrate high volatility during energy market disruptions.
Shipping companies implement fuel surcharge mechanisms that rapidly translate energy cost increases into freight rate adjustments. These surcharge systems create automatic inflation transmission mechanisms throughout global trade networks, often exacerbated by broader tariff impact analysis.
The next major ASX story will hit our subscribers first
How Do Historical Energy Crises Compare to Current Market Dynamics?
Historical energy crisis analysis provides context for understanding current market vulnerabilities whilst acknowledging significant structural changes in global energy consumption patterns and economic dependencies. Previous supply shock episodes demonstrate both the potential severity and typical duration characteristics of energy market disruptions.
1973 Oil Embargo: Price Adjustment Mechanisms
The 1973 oil embargo created a 300 percent price increase to approximately $12 per barrel, equivalent to roughly $90 in current terms. This historical precedent established the template for rapid price adjustment during supply shortage scenarios, with market psychology amplifying physical supply constraints.
The 1973 crisis demonstrated the importance of supply diversification and strategic reserve capabilities. These structural adaptations provide current economies with enhanced resilience compared to historical periods.
1979 Iranian Revolution: Supply Shock Parallels
The 1979 Iranian Revolution created supply disruptions comparable to current Strait of Hormuz scenarios, with revolutionary political change disrupting established export patterns and creating sustained supply uncertainty. Oil prices increased 150 percent to $40 per barrel during the crisis peak.
The 1979 crisis lasted approximately 12 months for supply normalisation and 24 months for complete market recovery. Current Strait tensions demonstrate similar political complexity and potential duration characteristics.
2022 Russia-Ukraine Conflict: Risk Premium Comparisons
The Russia-Ukraine conflict drove oil prices above $125 per barrel during peak concern periods, demonstrating how geopolitical supply fears can create rapid price escalation even without complete supply cutoffs. This recent precedent provides direct comparison to current dynamics, particularly when considering the Strait of Hormuz crisis impact on oil prices.
Historical Energy Crisis Timeline Comparison
| Crisis Event | Peak Price Increase | Duration Impact | Recovery Period |
|---|---|---|---|
| 1973 Oil Embargo | 300% ($12/barrel) | 6 months active | 18 months |
| 1979 Iran Revolution | 150% ($40/barrel) | 12 months active | 24 months |
| 2022 Russia-Ukraine | 65% ($125/barrel) | 3 months peak | 12 months |
| 2026 Strait Crisis | Projected 65-85% | Duration TBD | Timeline TBD |
What Long-Term Structural Changes Could Emerge from This Crisis?
Energy supply crises typically catalyse structural changes across global energy systems, accelerating investment patterns and policy frameworks that might otherwise develop over decades. The current situation creates potential inflection points for energy transition investment, regional security cooperation, and alternative transportation infrastructure development.
Accelerated Energy Transition Investment Patterns
Supply security concerns drive accelerated investment in renewable energy infrastructure and energy storage systems as nations seek to reduce dependency on vulnerable import routes. Crisis periods create political momentum for energy transition policies that face resistance during stable supply conditions.
Private sector investment flows typically shift toward energy security technologies during supply disruption periods. These investment pattern changes can create lasting impacts beyond immediate crisis resolution, particularly when combined with understanding of U.S. oil production decline.
Regional Energy Security Policy Reforms
Nations experiencing supply vulnerability typically implement energy security policy reforms including strategic reserve expansion, supply diversification requirements, and domestic production incentives. These policy changes often persist long after crisis resolution, creating permanent structural shifts.
International cooperation frameworks for energy security may emerge or strengthen during crisis periods. Regional energy security arrangements can reduce individual nation vulnerability to future supply disruptions.
Alternative Transportation Route Development
Pipeline infrastructure investment typically accelerates during maritime supply disruption periods, as nations seek land-based alternatives to vulnerable sea routes. These infrastructure projects require multiple years for development but create permanent supply diversification capabilities.
Transportation route diversification often involves geopolitical relationship adjustments, as nations develop supply partnerships with previously secondary suppliers. These relationship changes can outlast immediate crisis periods.
How Are Financial Markets Pricing Geopolitical Risk Premiums?
Financial market mechanisms for pricing geopolitical risk demonstrate sophisticated approaches to uncertainty quantification, with options markets, equity valuations, and currency relationships all reflecting supply disruption probabilities. Market pricing incorporates both immediate disruption impacts and longer-term structural change expectations.
Options Market Volatility Indicators
Energy options markets demonstrate elevated implied volatility during geopolitical crisis periods, with volatility premiums reaching levels typically associated with major supply disruptions. Options pricing incorporates tail risk scenarios that standard forecasting models often underweight.
Volatility term structures shift dramatically during crisis periods. This term structure pattern provides insight into market expectations for crisis duration and the potential for another Strait of Hormuz crisis impact on oil prices.
Energy Sector Equity Performance Analysis
Energy sector equities demonstrate complex performance patterns during supply crisis periods, with upstream oil and gas companies typically benefiting from higher commodity prices. Meanwhile, downstream refiners and consumers face margin pressure from input cost increases.
Regional energy company valuations reflect geographical exposure to supply disruption risks. Middle Eastern producers face potential operational disruption whilst North American and European companies may benefit from supply shortage pricing.
Currency Impact on Oil-Exporting Nations
Oil-exporting nation currencies typically demonstrate appreciation during supply crisis periods due to improved current account balances from higher export revenues. However, political instability can create offsetting depreciation pressures through capital flight.
Currency volatility increases substantially for nations directly involved in geopolitical conflicts affecting energy supplies. Market participants assess both revenue enhancement potential and political risk factors simultaneously.
Investment Risk Assessment Framework
• Direct exposure: Companies with operations in affected regions
• Commodity exposure: Price impact on input costs and revenues
• Supply chain exposure: Transportation and logistics dependencies
• Currency exposure: Exchange rate impacts on international operations
The interconnected nature of global energy systems ensures that regional supply disruptions create worldwide impacts across multiple sectors. Understanding these complex dynamics becomes essential for policymakers, investors, and business leaders navigating an increasingly volatile energy landscape. For further insight into regional disruption impacts, consider reviewing analysis on Middle East oil supply disruptions and their broader implications for European energy markets.
Disclaimer: This analysis is for informational purposes only and should not be considered as financial advice. Energy market investments carry substantial risks including geopolitical uncertainty, price volatility, and supply disruption impacts. Past performance does not guarantee future results. Readers should consult qualified financial advisors before making investment decisions.
Want to Capitalise on Energy Market Volatility?
Discovery Alert's proprietary Discovery IQ model delivers real-time alerts on significant ASX mineral discoveries, helping subscribers identify energy and commodity opportunities ahead of market movements during volatile periods like the current Strait of Hormuz crisis. Begin your 14-day free trial today and secure your market-leading advantage when energy sector opportunities emerge.