
June 24, 2026
The Strait of Hormuz crisis and oil market insights reveal how critical maritime passages create systemic vulnerabilities that extend far beyond immediate energy concerns. When OPEC production impact intersects with chokepoint disruptions, the resulting economic cascade affects monetary policy, trade relationships, and infrastructure investment strategies worldwide. Understanding these interconnected vulnerabilities requires examining how geographical bottlenecks shape not just oil flows, but the fundamental architecture of international economic stability.
Critical Maritime Infrastructure and Economic Vulnerability
The Strategic Importance of Energy Chokepoints
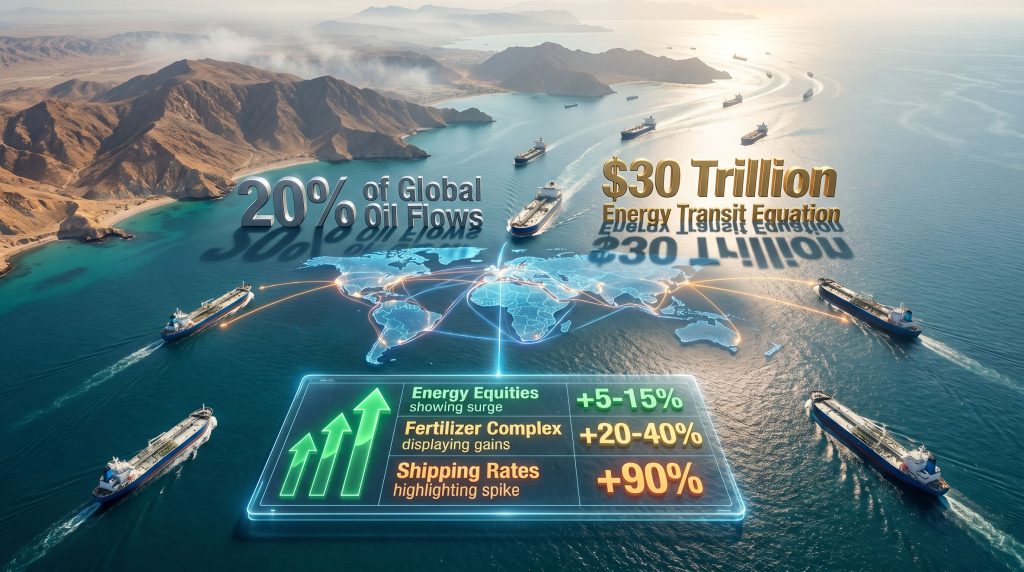
Maritime energy transportation relies on several critical passages that handle disproportionate volumes of global oil flows. According to analysis from the Center for Strategic and International Studies, the Strait of Hormuz crisis demonstrates how a single geographical bottleneck can affect approximately 21 million barrels per day of oil transit, representing roughly one-third of all globally traded seaborne petroleum. This concentration creates what economists term "single point of failure" risk in global energy systems.
Energy security analysts consistently identify three primary vulnerabilities in chokepoint-dependent systems:
- Geographical concentration where multiple supply routes converge through narrow passages
- Limited alternative routing capacity that cannot fully compensate for disrupted flows
- Asymmetric disruption potential where supply losses exceed available replacement infrastructure
The economic mathematics of chokepoint disruptions reveal stark realities. When normal transit routes face interference, alternative pathways can handle only 7-8 million barrels per day through combined pipeline networks, coastal shipping, and extended routing around geographical obstacles. This capacity gap creates immediate supply-demand imbalances that transmit rapidly through commodity markets.
Infrastructure Investment Requirements for Energy Security
Diversifying energy transportation networks requires substantial capital commitments across multiple infrastructure categories. Pipeline alternatives demand different engineering approaches depending on geographical constraints and political considerations.
Furthermore, these investments must align with broader energy transition strategy objectives while maintaining energy security.
Regional Pipeline Capacity Analysis:
| Route Alternative | Current Capacity (mb/d) | Expansion Potential | Investment Required |
|---|---|---|---|
| Turkish Pipeline Corridor | 1.0 | Limited by geography | $5-8 billion |
| Saudi East-West Pipeline | 5.0 | Moderate expansion possible | $15-25 billion |
| UAE-Oman Pipeline Network | 1.5 | Significant potential | $10-15 billion |
| Iraq-Turkey System | 0.6 | Reconstruction needed | $20-30 billion |
These infrastructure investments face complex risk-return calculations. Pipeline construction through politically unstable regions carries different risk profiles compared to maritime route diversification or strategic reserve expansions. Energy planners must balance construction timelines (typically 5-8 years for major pipeline projects) against immediate security needs and changing demand patterns.
When big ASX news breaks, our subscribers know first
Market Transmission Mechanisms During Supply Disruptions
Price Discovery Under Geopolitical Stress
Energy markets exhibit distinct behavioural patterns during supply disruptions that differ significantly from normal trading conditions. Risk premiums embed in commodity pricing through multiple channels, creating volatility patterns that can persist weeks beyond initial disruption events.
Historical analysis reveals that geopolitical energy shocks typically generate $5-15 per barrel risk premiums within the first 2-3 weeks. However, sustained disruptions involving major chokepoints can push premiums to $20-30 per barrel as markets price in extended uncertainty and inventory drawdown scenarios.
The forward curve behaviour during energy crises provides critical insights into market psychology. Under normal conditions, crude oil futures display contango (future prices exceed spot prices) when supply appears adequate. Crisis conditions trigger rapid shifts toward backwardation, where immediate delivery commands premium pricing over future contracts, reflecting urgent supply concerns.
Cross-Asset Correlation Dynamics
Energy disruptions create ripple effects across multiple asset classes, with varying response magnitudes and recovery timelines. Understanding these correlations helps investors and policymakers anticipate broader economic impacts, particularly when considering oil price movements in the context of trade tensions.
Historical Asset Response Patterns:
| Asset Class | Typical Response Range | Peak Impact Timeline | Recovery Duration |
|---|---|---|---|
| Energy Equities | +3% to +15% | Days 1-5 | 2-4 weeks |
| Shipping Rates (VLCC) | +50% to +150% | Weeks 1-4 | 3-6 months |
| Fertiliser Complex | +15% to +40% | Weeks 2-6 | 6-12 months |
| Consumer Discretionary | -5% to -12% | Weeks 1-2 | 1-2 quarters |
| Currency Markets (oil importers) | -2% to -8% | Days 3-7 | 4-8 weeks |
These correlations reflect fundamental economic relationships between energy costs and business profitability across sectors. Airlines, shipping companies, and industrial manufacturers face immediate cost pressures, while energy producers benefit from higher commodity prices. The magnitude and duration of these effects depend heavily on the perceived sustainability of supply disruptions and policy response effectiveness.
Central Bank Policy Coordination During Energy Shocks
Monetary Policy Challenges Under Supply Constraints
Energy-driven inflation presents unique challenges for central bank decision-making that differ markedly from demand-driven price pressures. In addition, financial market recession concerns complicate policy responses during energy crises. The Federal Reserve's dual mandate of price stability and maximum employment creates particular tension when supply shocks simultaneously increase inflation and threaten economic growth.
Central bank responses to energy shocks historically follow predictable patterns:
- Immediate assessment phase (weeks 1-2): Monitor inflation transmission mechanisms
- Policy evaluation phase (weeks 3-6): Distinguish temporary vs. persistent effects
- Response implementation (months 2-3): Adjust monetary stance based on second-round effects
- Coordination phase (ongoing): Collaborate with fiscal authorities on strategic reserves
The European Central Bank faces additional complexity due to varying energy import dependencies across eurozone members. Countries like Germany and Italy, with higher fossil fuel import ratios, experience amplified inflation transmission compared to nations with greater renewable energy capacity or domestic production.
Strategic Reserve Deployment Economics
Government intervention through strategic petroleum reserve releases represents a critical policy tool during energy crises, though effectiveness depends on release timing, volume, and international coordination mechanisms.
Policy Coordination Framework: The International Energy Agency maintains combined strategic reserves totalling approximately 1.5 billion barrels across member nations, representing roughly 90 days of net oil imports. However, release coordination requires consensus among politically diverse nations with varying economic interests.
Strategic reserve deployment economics involve complex trade-offs between immediate market stabilisation and long-term energy security preparedness. Releasing reserves during price spikes can moderate short-term volatility but reduces available buffers for future disruptions. Optimal deployment strategies consider both domestic economic impacts and international spillover effects.
Long-Term Structural Economic Implications
Energy Security Investment Acceleration
Geopolitical energy disruptions consistently accelerate investment in alternative energy infrastructure, though the magnitude and sustainability of these increases vary significantly across regions and timeframes. Consequently, the relationship between crisis events and renewable energy adoption follows well-documented patterns of "crisis-driven innovation."
Investment acceleration mechanisms include:
- Political priority elevation leading to enhanced government funding and regulatory support
- Private capital reallocation as investors reassess geopolitical risk in energy portfolios
- Technology cost reduction through increased research and development spending
- Infrastructure development prioritising energy independence over lowest-cost options
European renewable energy investment, for example, increased by approximately 40-60% following the 2022 Russian energy supply disruptions, with similar acceleration patterns observed during previous Middle Eastern conflicts. However, sustaining these investment levels requires continued political commitment beyond immediate crisis periods.
Regional Adaptation Strategies
Different economic regions develop distinct adaptation strategies based on their energy profile, geographical constraints, and available capital. These strategies reflect fundamental trade-offs between energy security, economic competitiveness, and environmental considerations.
Asian Economic Adaptation Approaches:
- Diversification strategies spreading supplier relationships across multiple regions
- Technology investments in energy efficiency and alternative fuel capabilities
- Regional cooperation through shared strategic reserves and emergency allocation protocols
- Infrastructure development emphasising LNG terminals and pipeline connectivity
European Energy Transition Acceleration:
- Renewable capacity expansion targeting 40-50% renewable electricity generation
- Energy storage development addressing intermittency challenges in wind and solar
- Industrial competitiveness balancing higher energy costs with manufacturing viability
- Regional integration enhancing cross-border energy sharing capabilities
Economic Recovery Pathways and Scenario Analysis
Short-Term Resolution Framework
Market normalisation following geopolitical energy disruptions typically follows predictable sequences, though timeline variations depend heavily on the underlying political resolution of conflicts and infrastructure restoration capabilities.
Rapid Resolution Indicators:
- Diplomatic breakthrough signalling conflict de-escalation
- Alternative supply activation demonstrating available replacement capacity
- Strategic reserve coordination providing temporary market stabilisation
- Forward curve normalisation as backwardation reduces and contango returns
Markets generally require 2-8 weeks for complete price normalisation following rapid conflict resolution, assuming no permanent infrastructure damage and successful diplomatic outcomes. However, risk premiums may persist at reduced levels ($2-5 per barrel) reflecting updated geopolitical risk assessments.
Extended Disruption Modelling
Prolonged energy supply disruptions create more complex economic adjustment mechanisms involving demand destruction, alternative supply development, and fundamental behavioural changes in energy consumption patterns.
Economic Multiplier Analysis:
Research from the International Energy Agency consistently shows that sustained $10 increases in oil prices typically reduce global GDP growth by 0.2-0.3 percentage points within 12 months. Emerging economies experience 40-60% higher impact ratios due to greater energy import dependencies and limited fiscal capacity for subsidies or economic stimulus.
Extended disruption scenarios (3-12 months) trigger demand destruction through multiple mechanisms:
- Industrial activity reduction as higher energy costs reduce manufacturing competitiveness
- Transportation demand modification including increased public transit usage and remote work adoption
- Economic recession effects reducing overall energy consumption through lower economic activity
- Behavioural adaptation including energy conservation measures and efficiency improvements
Permanent Risk Premium Integration
Markets may integrate permanent risk premiums into energy pricing following major disruptions, reflecting updated assessments of geopolitical stability and supply chain vulnerability. For instance, the Strait of Hormuz crisis and oil market insights demonstrate how infrastructure resilience becomes increasingly important in pricing models.
Long-term Risk Assessment Factors:
- Infrastructure resilience improvements including redundant transportation routes
- Strategic reserve capacity expansions reflecting lessons from disruption events
- Technology adoption accelerating renewable energy and energy storage deployment
- International cooperation mechanisms for crisis response and supply coordination
Investment Framework Development
Portfolio Diversification Under Energy Security Constraints
Investment managers increasingly incorporate geopolitical energy risk into portfolio construction, recognising that traditional diversification strategies may prove inadequate during major supply disruptions. This evolution requires new analytical frameworks combining energy security assessments with traditional financial metrics.
Energy Security Investment Priorities:
- Alternative energy infrastructure offering reduced geopolitical risk exposure
- Energy storage technologies providing supply intermittency solutions
- Transportation electrification reducing petroleum dependency in key economic sectors
- Regional energy independence projects minimising import dependency vulnerabilities
Risk-adjusted return calculations for energy infrastructure projects must incorporate geopolitical stability assessments, regulatory frameworks, and technology development trajectories. Traditional financial models require enhancement to capture the value of energy security benefits and reduced systemic risk exposure.
The next major ASX story will hit our subscribers first
Regional Economic Vulnerability Assessment
Import Dependency and Economic Exposure
Regional economic vulnerability to energy supply disruptions correlates directly with import dependency ratios, though the relationship varies based on economic structure, alternative energy capacity, and available fiscal resources for crisis management.
Furthermore, US-China trade impact considerations add complexity to regional vulnerability assessments, particularly for Asian economies.
Asian Economic Vulnerability Metrics:
- Japan: 99% oil import dependency, approximately 3.2 million barrels daily
- South Korea: 98% oil import dependency, approximately 2.8 million barrels daily
- India: 87% oil import dependency, approximately 5.1 million barrels daily
- China: 72% oil import dependency, approximately 11.0 million barrels daily
These dependency ratios translate into immediate economic vulnerability during supply disruptions, with effects amplified by limited alternative energy capacity and strategic reserve duration. Currency stability becomes particularly important for import-dependent economies as energy costs represent significant portions of total import expenditure.
Economic Adaptation Mechanisms
Regional economies develop distinct adaptation strategies reflecting their energy profiles, available resources, and strategic priorities. These adaptations often involve trade-offs between energy security, economic competitiveness, and environmental considerations.
Currency Stability Implications:
Energy import costs typically represent 15-25% of total import expenditure for major oil-consuming nations. During supply disruptions, currency depreciation amplifies imported inflation effects, creating feedback loops between energy costs, currency stability, and economic competitiveness. Central banks must balance currency intervention against domestic monetary policy objectives.
Frequently Asked Questions About Energy Crisis Economics
What determines oil price volatility during geopolitical crises?
Oil price volatility during crises stems from multiple factors including actual and perceived supply disruption magnitude, available alternative supply capacity, inventory levels across consuming regions, and speculative positioning in futures markets. Volatility typically peaks 2-3 weeks into major disruptions as initial uncertainty reaches maximum levels before resolution pathways become clearer.
How quickly can global oil markets rebalance after supply shocks?
Physical market rebalancing requires 3-6 months for complete normalisation, reflecting the time needed to activate alternative supply sources, redistribute inventory, and optimise transportation logistics. However, financial market price normalisation can occur within weeks if geopolitical tensions ease and alternative supplies successfully activate.
What economic indicators signal energy crisis resolution?
Key resolution indicators include shipping rate normalisation (particularly for Very Large Crude Carriers), inventory rebuild rates in strategic consuming regions, forward curve backwardation reduction toward normal contango, and central bank communication shifts regarding inflation expectations and monetary policy stances.
How do emerging market economies differ in crisis response?
Emerging economies typically experience 40-60% greater impact from energy price shocks due to higher import dependency ratios, limited fiscal capacity for subsidies, and currency depreciation amplification effects. Their recovery timelines often extend longer than developed economies due to structural economic vulnerabilities.
Energy Market Dynamics and Economic Resilience
The Strait of Hormuz crisis and oil market insights exemplify how single chokepoint disruptions can trigger cascading effects across global economic systems, affecting everything from shipping rates to central bank policy decisions. Understanding these transmission mechanisms enables more effective risk assessment, better policy coordination, and improved investment decision-making during periods of energy market stress.
The economic implications extend far beyond immediate supply concerns, influencing long-term infrastructure investment, monetary policy frameworks, and regional adaptation strategies. As global energy systems continue evolving, the lessons learned from chokepoint crisis management will shape future energy security planning and economic resilience development across both developed and emerging economies.
This analysis is provided for educational purposes and should not be considered investment advice. Energy market conditions are subject to rapid change based on geopolitical developments, technological advances, and policy decisions. Readers should consult qualified financial advisors for specific investment guidance and stay informed about current market developments through reliable energy industry sources.
Ready to Navigate Energy Market Volatility?
Discovery Alert's proprietary Discovery IQ model delivers real-time notifications on significant ASX mineral discoveries, including critical energy transition metals that become increasingly valuable during global supply disruptions. With energy security concerns driving unprecedented investment in alternative supply chains, explore how historic mineral discoveries have generated substantial returns whilst providing essential resources for economic resilience.