
July 19, 2026
Global energy markets operate within an intricate web of chokepoints and supply vulnerabilities that few outside the industry fully comprehend. The concentration of critical infrastructure within specific geographic corridors creates systemic risks capable of reshaping economic landscapes overnight. Understanding these vulnerability patterns becomes essential for investors, policymakers, and energy analysts navigating an increasingly volatile geopolitical environment, particularly when examining Strait of Hormuz disruption scenarios.
Among the world's most critical energy transit routes, certain waterways carry disproportionate influence over global supply chains, creating scenarios where localised conflicts can trigger worldwide economic disruption. The mechanics of these disruptions follow predictable patterns, yet their market impact often exceeds rational expectations due to psychological factors and structural market inefficiencies. Furthermore, the tariffs impact on markets adds another layer of complexity to global energy trade dynamics.
Understanding the Strategic Importance of the Strait of Hormuz
Geographic and Economic Fundamentals
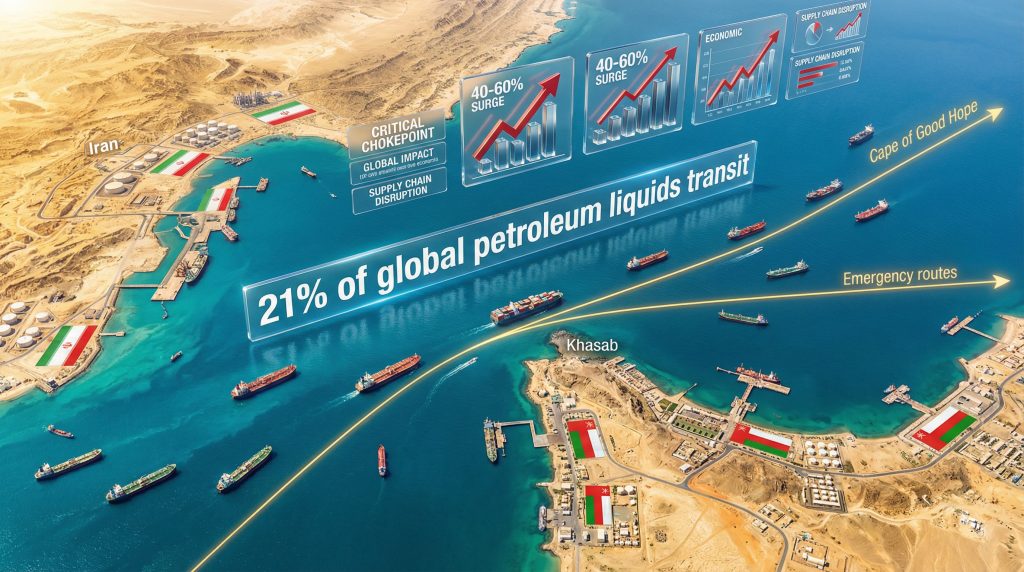
The Strait of Hormuz represents perhaps the most critical energy chokepoint globally, connecting the Persian Gulf to the Arabian Sea through a narrow waterway spanning approximately 21 nautical miles at its narrowest point between Oman's Musandam Peninsula and the Iranian coast. This seemingly modest geographic feature controls the flow of roughly 21% of globally traded petroleum liquids, equivalent to approximately 21 million barrels per day as of 2024-2025.
The strategic significance extends beyond crude oil transport. Qatar's liquefied natural gas exports, representing approximately 10% of global LNG supply with annual production reaching 77 million tonnes, predominantly transit through this waterway. The concentration of energy flows creates an asymmetric vulnerability where a single chokepoint controls access to resources valued at approximately $1.5-2 trillion USD annually.
Maritime navigation through the Strait operates under International Maritime Organisation protocols, utilising two-way traffic lanes with a separation zone. Northbound and southbound traffic each utilise 2-nautical-mile-wide lanes, making the actual navigable width for simultaneous traffic considerably narrower than the overall distance between shorelines. Additionally, the natural gas trends update provides crucial context for understanding how energy markets respond to supply disruptions.
Historical Context of Maritime Security Challenges
Historical disruption patterns provide crucial insight into market behaviour during crisis scenarios. The Iran-Iraq War's Tanker War phase (1984-1988) demonstrated the vulnerability of commercial shipping, with over 500 vessels destroyed or damaged. During this period, crude oil prices escalated from approximately $28 per barrel in 1985 to over $40 per barrel at peak disruption periods.
Insurance premiums during the Tanker War reached extraordinary levels, climbing to 50% of cargo value, effectively pricing many shipments out of commercial viability. This created a cascading effect where perceived risk exceeded actual physical danger, extending market disruption beyond the duration of active conflict. In addition, the trade war global impacts demonstrate how geopolitical tensions can amplify energy market volatility.
More recent precedents include the September 2019 drone attacks on Saudi Aramco facilities, which triggered a 19.5% single-day oil price surge without any direct Strait blockage. This reaction demonstrated heightened market sensitivity to supply source vulnerabilities, even when transit routes remained technically operational.
When big ASX news breaks, our subscribers know first
What Economic Scenarios Emerge During Strait of Hormuz Disruptions?
Immediate Market Response Patterns
Current market dynamics illustrate the persistent nature of disruption-related volatility. As of April 9, 2026, despite formal ceasefire announcements, Brent crude futures gained $2.60 (+2.74%) to $97.35 per barrel, while WTI crude rose $3.02 (+3.20%) to $97.43 per barrel. Notably, both benchmarks had fallen below $100 per barrel in the previous session, with WTI recording its largest single-day decline since April 2020.
This price behaviour reflects a critical market psychology principle: perceived risk persists longer than actual physical risk. Standard Chartered Bank analysts emphasised that transit through the Strait remains fundamentally dependent on Iranian discretion, creating ongoing uncertainty despite technical reopening. This uncertainty is further compounded by ongoing oil price rally details that highlight broader market sensitivities.
The bank's assessment highlighted that logistic disconnects, security concerns, elevated insurance premiums, and operational constraints would likely prevent significant additional energy supplies via the Strait for several weeks following formal reopening. This reflects the hysteresis effect in energy markets, where switching costs and risk perception create delays in returning to normal operations. According to reports from Australia's ABC News, the complexities of resuming normal shipping operations extend well beyond political declarations.
Supply Chain Reconfiguration Strategies
Alternative routing mechanisms during Strait of Hormuz disruption scenarios involve significant cost penalties and logistical challenges:
Cape of Good Hope Rerouting:
- Additional 6,000 nautical miles to transit distance
- 15-20 day voyage extension
- $2-4 million USD additional costs per supertanker voyage
- Transportation cost increase of $3.00-5.00 per barrel
Suez Canal Rerouting:
- $2.00-3.50 per barrel additional transportation costs
- Capacity constraints during high-volume periods
- Insurance premium adjustments for alternative routing
Pipeline Bypass Activation:
- Saudi East-West Pipeline: 5 million barrels per day capacity
- 20-30 day maximum activation timeline for full alternative capacity
- Vulnerability to regional attacks, as demonstrated in April 2026 Iranian strikes
| Disruption Duration | Oil Price Impact | Shipping Cost Increase | Global GDP Effect |
|---|---|---|---|
| 1-2 weeks | 15-25% surge | 300-500% premium | 0.1-0.2% contraction |
| 1-3 months | 40-60% surge | 800-1200% premium | 0.5-0.8% contraction |
| 6+ months | 100%+ surge | Indefinite rerouting | 2.0-3.5% contraction |
How Do Regional Powers Navigate Hormuz Crisis Management?
Iranian Strategic Calculations and Leverage Points
Iran's demonstrated capabilities during the April 2026 crisis period revealed sophisticated operational coordination. Iranian authorities issued detailed navigational maps for mine-cleared passages through the Strait and designated safe paths for passage in coordination with Revolutionary Guard units. This capability demonstrates Iran's ability to exercise discretionary control over transit operations rather than binary closure scenarios.
The Revolutionary Guard Naval Forces (IRGCN) operates approximately 450+ operational vessels including fast-attack craft, submarines, and missile boats, with personnel totalling 20,000-25,000. Their asymmetric warfare doctrine emphasises swarm attacks, mine warfare, and anti-ship cruise missiles with ranges extending 150-300+ kilometres.
Iran's strategic positioning allows for graduated escalation capacity, as demonstrated through surgical strikes on specific energy infrastructure, coordination with proxy actors described as Revolutionary Guards operations, and maintenance of navigational control through mine mapping and coordination protocols. However, it's worth noting that the oil price crash analysis suggests that prolonged disruptions may ultimately weaken Iran's economic position.
Gulf Cooperation Council Response Frameworks
GCC nations face varying degrees of Strait dependency that shapes their crisis response strategies:
| Country | Daily Production (mbbl/d) | Strait Transit Dependency |
|---|---|---|
| Saudi Arabia | 10.2 | 95%+ |
| Iraq | 4.5 | 100% |
| Iran | 3.2 | 100% |
| UAE | 3.0 | 90% |
| Kuwait | 2.7 | 100% |
| Qatar | LNG: 77 MT/year | 100% (for LNG) |
Total GCC Strait Dependency: ~24+ million barrels/day (approximately 27% of global supply)
Saudi Arabia's East-West Pipeline system provides the most significant bypass capability at 5 million barrels per day transport capacity. However, the April 2026 Iranian strikes on this pipeline infrastructure demonstrated the vulnerability of alternative export routes to regional conflicts.
International Maritime Security Coordination
The U.S. Fifth Fleet, stationed at Naval Support Activity Bahrain, commands approximately 50-70 ships and submarines across the Persian Gulf, Arabian Sea, and Indian Ocean. Historical precedents show convoy escort operations during high-threat periods, though coordination complexity increases significantly during multi-actor conflicts.
The April 2026 crisis revealed critical coordination failures, with shippers requiring additional clarity on ceasefire terms before resuming transit. Iran's issuance of navigational maps and Revolutionary Guard coordination protocols highlighted the practical reality that maritime security depends fundamentally on Iranian cooperation rather than international maritime protection alone.
What Alternative Energy Transit Routes Emerge During Disruptions?
Land-Based Pipeline Infrastructure Activation
Pipeline alternatives face both capacity and security constraints during regional conflicts. The Trans-Arabian Pipeline system provides theoretical backup capacity, but actual utilisation depends on security conditions across multiple jurisdictions. Iraq-Turkey pipeline networks offer additional routing possibilities, though throughput limitations prevent full compensation for Strait closure.
Central Asian pipeline networks through Russia and China provide partial substitution for Asian markets, but infrastructure integration requires months rather than weeks for significant volume increases. The 20-30 day activation timeline for full alternative pipeline capacity reflects both technical and political coordination requirements.
Maritime Rerouting Economics and Logistics
Extended voyage routing creates cascading effects throughout global shipping networks:
Tanker Charter Rate Dynamics:
- Normal Large Range (LR2) operations: $15,000-25,000 per day
- Disruption scenario rates: $150,000-300,000+ per day
- Voyage charter premiums: $0.50-1.50 to $5-15+ per barrel
Port Infrastructure Adaptation:
- Increased volume handling at alternative terminals
- Storage capacity constraints at receiving ports
- Berth availability bottlenecks during routing shifts
The 2011 Libya crisis provides relevant comparison data. When Libya's oil production declined 90% over 8 months, Brent crude increased from $108 to $127 per barrel (+17.6%). Crucially, this price premium occurred without any physical supply transiting Libyan ports, demonstrating market sensitivity to forward supply expectations. The UNCTAD analysis emphasises how such disruptions extend beyond energy markets into broader economic consequences.
How Do Energy Markets Adapt to Prolonged Strait Closures?
Strategic Petroleum Reserve Deployment Strategies
International Energy Agency coordinated release protocols provide 60-90 days of buffer capacity, allowing time for alternative supply route activation and market adjustment. However, SPR effectiveness depends on coordinated deployment timing and volume management to prevent market oversupply during recovery phases.
National reserve capabilities vary significantly:
- United States: 714 million barrel capacity
- China: Estimated 500+ million barrel capacity
- European Union: Combined 90-day import coverage requirement
- Japan: 90-day import coverage maintained
Demand Destruction and Conservation Responses
Prolonged disruptions trigger demand destruction mechanisms through multiple channels:
Industrial Sector Adaptations:
- Fuel switching to alternative energy sources where technically feasible
- Production scheduling adjustments to reduce energy intensity
- Strategic inventory drawdowns to maintain operations
Transportation Sector Responses:
- Modal shift toward rail and pipeline transportation
- Efficiency improvements through route optimisation
- Reduced discretionary travel and freight movements
Residential and Commercial Adjustments:
- Energy conservation behaviours during price spikes
- Accelerated adoption of alternative heating systems
- Demand timing shifts to avoid peak pricing periods
Economic research indicates that sustained oil prices above $120 per barrel for 6+ months typically trigger 2-4% demand destruction in developed economies, with emerging markets showing higher sensitivity due to subsidy removal pressures.
What Investment Implications Arise from Hormuz Disruption Scenarios?
Energy Sector Equity Performance Patterns
Strait of Hormuz disruption scenarios create divergent performance patterns across energy sector segments:
Upstream Oil and Gas Companies:
- Revenue increases from higher commodity prices
- Production cost inflation from security and logistics premiums
- Capital allocation shifts toward lower-risk geographic regions
Refining Sector Dynamics:
- Margin expansion opportunities during supply disruptions
- Feedstock sourcing challenges and cost volatility
- Geographic advantage for refineries outside affected supply chains
Renewable Energy Acceleration:
- Strategic hedge positioning during fossil fuel supply uncertainty
- Policy acceleration for energy security objectives
- Investment flow redirection toward supply-secure alternatives
Shipping and Logistics Sector Dynamics
Maritime transportation companies experience complex impacts during disruption scenarios:
Tanker Charter Markets:
- Rate escalation creates windfall profits for vessel owners
- Fleet utilisation optimisation challenges with extended voyages
- Insurance cost increases offset revenue gains
Port Infrastructure Investments:
- Capacity expansion requirements at alternative terminals
- Storage facility development for supply buffering
- Technology upgrades for enhanced cargo handling efficiency
Geopolitical Risk Premium Integration
Financial markets incorporate Strait disruption risk through multiple mechanisms:
Sovereign Bond Adjustments:
- Spread widening for oil-dependent economies during crisis periods
- Flight-to-quality effects benefiting stable government debt
- Currency volatility patterns reflecting energy import dependencies
Commodity Trading Strategies:
- Volatility premium integration in options markets
- Backwardation patterns reflecting immediate supply concerns
- Cross-commodity arbitrage opportunities between crude grades
The next major ASX story will hit our subscribers first
How Do Long-Term Regional Security Architectures Evolve?
Military Infrastructure Development Priorities
Persistent Strait vulnerabilities drive regional military capability investments:
Naval Defence Enhancement:
- Mine warfare countermeasure capabilities
- Anti-ship missile defence systems
- Surveillance and early warning networks
Air Defence Integration:
- Layered missile defence architectures
- Drone and small aircraft countermeasures
- Integrated command and control systems
Diplomatic Framework Reconstruction
Long-term stability requires diplomatic mechanisms addressing root causes of disruption risk:
Multilateral Security Guarantees:
- International maritime protection protocols
- Economic incentive structures for stable transit
- Verification and monitoring mechanisms
Confidence-Building Measures:
- Regular multilateral naval exercises
- Information sharing agreements
- Commercial shipping protection protocols
What Technological Solutions Address Chokepoint Vulnerabilities?
Advanced Maritime Monitoring Systems
Technology deployment can reduce disruption duration and improve crisis response:
Satellite Surveillance Integration:
- Real-time vessel tracking and threat detection
- Automated alert systems for anomalous activities
- Predictive analytics for crisis escalation patterns
Blockchain Cargo Verification:
- Supply chain transparency and security verification
- Smart contract execution for automatic insurance claims
- Immutable shipping documentation systems
Alternative Energy Infrastructure Development
Long-term chokepoint vulnerability reduction requires diversified energy systems:
Hydrogen Pipeline Networks:
- Overland transportation reducing maritime dependency
- Integration with renewable energy production systems
- Strategic storage capabilities for supply security
Floating LNG Terminals:
- Flexible deployment for alternative supply routes
- Reduced infrastructure vulnerability to land-based attacks
- Rapid capacity scaling during crisis periods
Preparing for Future Strait of Hormuz Disruption Scenarios
Corporate Risk Management Framework Development
Energy-dependent industries require sophisticated risk management approaches:
Supply Chain Diversification:
- Multiple sourcing agreements across geographic regions
- Flexible contract terms allowing supplier substitution
- Strategic inventory management for extended disruptions
Financial Hedging Strategies:
- Commodity price volatility protection through derivatives
- Currency hedging for international energy purchases
- Insurance coverage for supply interruption scenarios
National Energy Security Policy Evolution
Government policy frameworks must address both immediate crisis response and long-term vulnerability reduction:
Strategic Reserve Modernisation:
- Capacity expansion beyond current 90-day coverage
- Geographic distribution for regional supply security
- Technology upgrades for rapid deployment capabilities
International Cooperation Enhancement:
- Bilateral and multilateral supply sharing agreements
- Joint investment in alternative transportation infrastructure
- Coordinated crisis response protocols
Emergency Response Capabilities:
- Rapid deployment teams for infrastructure protection
- Communication systems for crisis coordination
- Public-private partnership frameworks for resource mobilisation
The Strait of Hormuz disruption scenarios demonstrate how geographic chokepoints create systemic vulnerabilities in global energy systems. Historical patterns show that market impacts often exceed physical disruption duration due to psychological factors and structural inefficiencies. Understanding these dynamics becomes essential for stakeholders navigating energy security challenges in an increasingly complex geopolitical environment.
Important Disclaimer: This analysis contains forward-looking statements and speculative scenarios based on historical patterns and expert assessments. Actual market outcomes may vary significantly from projected scenarios due to unpredictable geopolitical developments, technological changes, and market psychology factors. Readers should conduct independent research and consult qualified financial advisors before making investment decisions based on geopolitical risk assessments.
Looking for Investment Opportunities in Energy-Sensitive Markets?
Discovery Alert's proprietary Discovery IQ model delivers real-time alerts on significant ASX mineral discoveries, helping investors identify actionable opportunities in resource sectors particularly sensitive to global energy dynamics. With complex geopolitical scenarios affecting commodity markets, subscribers gain immediate insights into discoveries that could benefit from supply chain disruptions and energy security concerns through Discovery Alert's specialised service. Begin your 14-day free trial today to position yourself ahead of market movements driven by evolving energy security landscapes.