
June 17, 2026
The Hidden Architecture of Global Oil Dependency: Why One Narrow Passage Controls Everything
Most investors think about oil prices in terms of OPEC decisions, US shale output, or demand signals from Chinese manufacturing data. Yet beneath all of these variables sits a single physical constraint that none of those forces can override: the requirement that roughly one-fifth of the world's daily petroleum supply pass through a waterway measuring just 33 kilometres at its narrowest navigable point.
The Strait of Hormuz is not simply a geographic feature. It is the foundational pressure point of the entire global energy system, and when military activity threatens its operation, the consequences radiate outward through oil prices, inflation data, monetary policy, corporate margins, and asset valuations in ways that most market participants underestimate until the disruption is already underway.
Understanding how Strait of Hormuz disruption and oil prices interact requires moving beyond headline price reactions and examining the deeper transmission mechanisms that connect a military incident in the Persian Gulf to a Federal Reserve rate decision in Washington. Furthermore, these mechanisms are increasingly relevant given the convergence of crude oil trade geopolitics and regional military tensions in 2025 and beyond.
When big ASX news breaks, our subscribers know first
Why the Strait of Hormuz Stands Apart From Every Other Maritime Chokepoint
The Scale of Dependency That No Alternative Can Replace
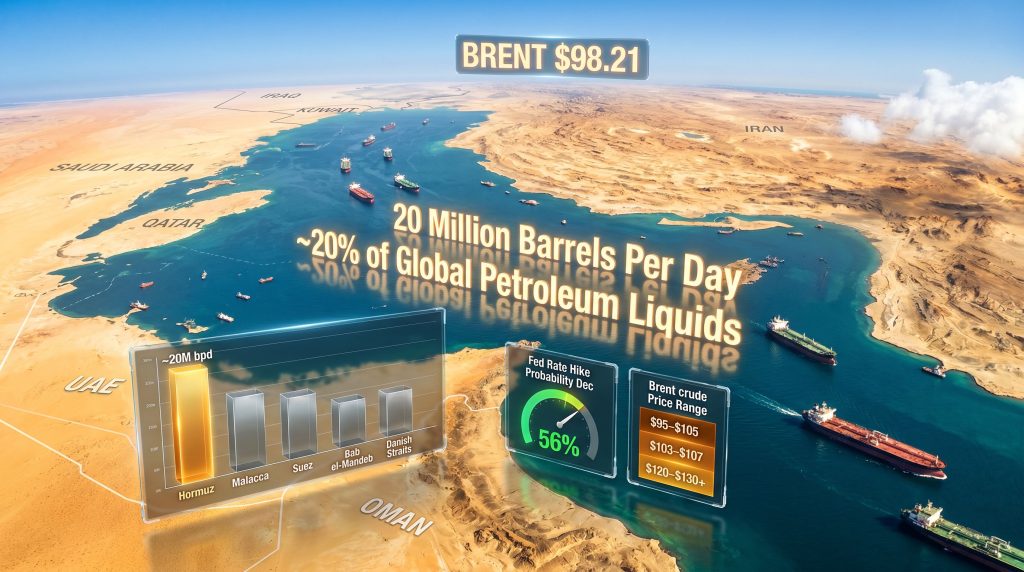
According to the U.S. Energy Information Administration's 2025 maritime chokepoint assessment, approximately 20 million barrels per day transited the Strait of Hormuz in 2024. That figure represents roughly 20% of all global petroleum liquids consumption moving through a single passage connecting the Persian Gulf to the Gulf of Oman.
No other maritime corridor carries a comparable share of global energy supply. The comparison across major chokepoints reveals how categorically different Hormuz is from any other single point of vulnerability:
| Maritime Chokepoint | Estimated Daily Oil Flow | Primary Risk Factor | Alternative Route Available? |
|---|---|---|---|
| Strait of Hormuz | ~20 million bpd | Military conflict / mining | Partial (pipeline only) |
| Strait of Malacca | ~16 million bpd | Piracy / congestion | Limited |
| Suez Canal / SUMED | ~9 million bpd | Political instability | Cape of Good Hope |
| Bab el-Mandeb | ~7 million bpd | Houthi activity | Cape of Good Hope |
| Danish Straits | ~3 million bpd | Geopolitical tension | Baltic rerouting |
The critical distinction is that most other chokepoints have viable, if costly, alternative routes. Hormuz does not. Existing pipeline bypass infrastructure, including Saudi Arabia's Petroline and the Abu Dhabi Crude Oil Pipeline, can redirect only a fraction of normal Hormuz throughput. Alternative maritime routes require circumnavigating the entire Arabian Peninsula, adding substantial transit time and dramatically increasing freight costs.
Strategic petroleum reserves held by IEA member nations provide coverage measured in weeks rather than months under sustained disruption scenarios, functioning as a bridge mechanism rather than a structural solution. OPEC's market influence over production levels, moreover, cannot compensate for physical chokepoint closure when the transit route itself is compromised.
A less commonly discussed constraint compounds the problem further: refinery configuration. Asian and European refineries optimised over decades to process Gulf crude grades cannot simply substitute alternative crude varieties without significant yield penalties. The physical infrastructure of global downstream processing has been built around the assumption of continuous Hormuz access, which means disruption creates ripple effects far beyond the crude oil market itself.
How Strait of Hormuz Disruption Moves Oil Prices: The Full Transmission Chain
From Military Incident to Brent Crude Benchmark
The relationship between Strait of Hormuz disruption and oil prices does not operate through a single mechanism. It works through a sequential chain of market adjustments that unfold over hours, days, and weeks:
- Tanker operator risk reassessment begins within hours of a security incident. Shipping companies suspend transit bookings pending naval clearance and updated route security assessments.
- War risk insurance premiums escalate rapidly. Maritime insurers apply conflict zone surcharges that can substantially increase voyage costs before any physical supply shortage has materialised.
- Spot market tightening follows as buyers who cannot secure near-term delivery compete for available cargoes across alternative markets, driving prices upward.
- Futures market repricing occurs as Brent and WTI contracts adjust to reflect both current supply risk and the market's collective estimate of how long disruption will persist.
- Refinery margin compression emerges as downstream processors face higher feedstock costs before they can pass increases through to consumers.
The May 26, 2026 escalation illustrated this chain in compressed form. US strikes on Iranian missile sites and vessels allegedly attempting to deploy sea mines near Gulf shipping lanes pushed Brent crude above $98.21 per barrel during Asian trading sessions, representing a move exceeding 2% within a single session. This occurred against a backdrop of simultaneous diplomatic talks between Iranian and Qatari officials in Doha regarding a potential framework for reopening the strait, demonstrating a dynamic that investors frequently misunderstand.
According to reporting on the Hormuz crisis, markets have historically struggled to price in the full duration of disruption when diplomatic signals are mixed with operational uncertainty.
Critical investor distinction: Diplomatic progress and operational normalisation are entirely independent variables. Negotiations can advance while shipping lanes remain physically unusable due to active mining threats, ongoing naval clearance requirements, and insurer risk assessments that operate on their own separate timelines.
Historical escalation events reinforce this price sensitivity. During periods of acute Hormuz tension, Brent crude has previously moved into the $103 to $107 per barrel range, while even partial disruption signals have demonstrated the market's willingness to price in supply risk aggressively.
The Demining Problem: A Bottleneck That Diplomacy Cannot Accelerate
One of the least discussed aspects of Hormuz disruption is how long operational normalisation takes even after a political agreement is reached. The reopening sequence involves stages that cannot be compressed regardless of political will:
- Active demining operations must be conducted by naval authorities and independently verified before commercial transit can resume
- Maritime insurers must complete their own risk assessments and formally approve resumed transit before operators will commit vessels
- Tankers that were diverted to alternative routes during disruption must be recalled and physically repositioned, a process measured in days to weeks depending on vessel locations
- Port authority and terminal operator verification must confirm safe passage before loading and discharge schedules return to normal patterns
This sequential operational requirement means that even a verified diplomatic breakthrough translates into continued elevated oil prices for a period that markets consistently underestimate when pricing diplomatic headlines.
Strait of Hormuz Disruption, Inflation, and the Federal Reserve's Impossible Calculus
How Energy Shocks Reach Consumer Price Data
The pathway from Hormuz disruption to CPI data involves a transmission lag that creates persistent policy complexity for central banks. The sequence unfolds across multiple cost layers:
- Fuel and freight costs rise first, immediately affecting logistics-intensive sectors including retail, manufacturing, and agriculture
- Petrochemical input costs increase for plastics, fertilisers, synthetic fibres, and industrial chemicals, all of which are upstream inputs to an enormous range of consumer goods
- Electricity generation costs rise in markets where gas-fired generation sets the marginal price, most notably across Europe and parts of Asia
- CPI headline data typically reflects these cumulative cost increases with a lag of four to eight weeks, meaning central banks are frequently reacting to data that already understates current inflationary conditions
This lag creates a compounding policy problem. By the time elevated energy costs appear in official inflation readings, the actual inflationary impulse may have advanced significantly beyond what the data captures. Consequently, the broader discussion around trade war oil prices adds a further layer of complexity to an already difficult environment for policymakers.
What the 56% Federal Reserve Rate Hike Probability Signals
Following the May 26 escalation, CME Group FedWatch data showed markets assigning a 56% probability to a Federal Reserve rate hike by December, a substantial repricing from pre-escalation expectations that had leaned toward an easing cycle. This single data point carries significant implications for investors across multiple asset classes.
A 56% implied probability of a rate hike is not a prediction. It is the market's aggregate assessment of the balance of risks. But it represents a meaningful shift that compresses equity multiples, increases debt-servicing burdens, and reduces the present value of future cash flows across the entire asset universe.
Standard Chartered strategist Eric Robertsen highlighted that higher debt-servicing costs combined with slower growth are intensifying fiscal pressure globally, particularly in economies that entered the current cycle carrying elevated debt-to-GDP ratios. Powell on inflation has consistently signalled that persistent energy-driven price pressures complicate the path back to neutral policy. This observation captures a compounding dynamic that extends well beyond the energy sector itself:
- Higher oil prices drive higher inflation, which delays central bank easing and increases borrowing costs
- Higher borrowing costs increase government interest expense, reducing available fiscal space for growth-supporting stimulus
- Reduced fiscal space produces slower growth, which erodes tax revenues and deepens fiscal deterioration further
Sector Exposure: Which Asset Classes Face the Greatest Vulnerability
The Sector Vulnerability Landscape
Not all sectors absorb Hormuz disruption equally. The combination of elevated fuel costs and rising interest rates creates a differentiated impact profile that investors need to map across their portfolios:
| Sector | Primary Exposure Channel | Vulnerability Level | Potential Offset |
|---|---|---|---|
| Airlines | Jet fuel (typically 20-30% of operating costs) | Very High | Fuel hedging programs |
| Freight and Logistics | Diesel and bunker fuel costs | High | Fuel surcharge pass-through |
| Petrochemicals and Plastics | Feedstock cost inflation | High | Limited short-term |
| Consumer Discretionary | Input cost and freight inflation | Medium-High | Demand elasticity |
| Small-Cap Growth Companies | Refinancing cost sensitivity | High | Longer debt maturities |
| Utilities (gas-fired) | Generation fuel cost | Medium | Regulated pricing mechanisms |
| Energy Producers (non-Gulf) | Positive revenue impact | Low (beneficiary) | Production capacity constraints |
Energy-exporting nations outside the Gulf region, particularly the United States, Canada, and Algeria, occupy a structurally advantaged position during Hormuz disruption. Their production becomes relatively more attractive to buyers seeking supply security, and sustained price premiums directly benefit their export revenues and fiscal positions.
Why Precious Metals React Counterintuitively
During the May 26 escalation, spot silver fell 1.8% and platinum declined 0.9%, a pattern that appears paradoxical in a tightening commodity environment. The explanation lies in the interest rate transmission mechanism rather than direct commodity dynamics.
Rising oil prices increase inflation expectations. Higher inflation expectations raise the probability of central bank tightening. Higher real and nominal interest rates increase the opportunity cost of holding non-income-producing assets. Silver and platinum, both of which carry significant industrial demand components, face simultaneous headwinds from growth slowdown risk and yield competition.
Gold safe-haven demand during oil shocks is more nuanced, as it simultaneously responds to safe-haven impulses, inflation hedging, and interest rate headwinds. This multi-directional sensitivity makes gold a more complex position to evaluate during sustained Hormuz disruption than the conventional inflation-hedge narrative suggests.
Three Scenarios: Mapping Possible Hormuz Outcomes to Market Implications
Scenario 1: Rapid Diplomatic Resolution
Probability assessment: Lower probability under current conditions
Required conditions: Verified ceasefire, completed and confirmed demining operations, formal insurer approval of resumed transit, and sustained Brent crude decline below pre-escalation levels
Market implications:
- Brent crude retraces toward the $85 to $90 range
- Fed rate hike probability falls below 30%, restoring easing cycle expectations
- Leveraged equity sectors recover as refinancing pressure eases
- Precious metals face continued headwinds from declining inflation expectations
Scenario 2: Prolonged Stalemate (Base Case)
Required conditions: Diplomatic negotiations continue without operational resolution; shipping lanes remain partially constrained; oil prices hold elevated without further spike
Market implications:
- Brent crude holds in the $95 to $105 range
- Federal Reserve maintains restrictive policy stance through year-end
- Margin pressure accumulates progressively in airlines, chemicals, and leveraged growth sectors
- Non-Gulf producers sustain price premiums, supporting their equity valuations
Scenario 3: Full Escalation and Extended Closure (Tail Risk)
Required conditions: Conflict expands significantly; shipping lanes become operationally impassable; IEA strategic reserve releases are activated
Market implications:
- Brent crude tests the $120 to $130+ range based on historical disruption analogues
- Inflation expectations re-anchor at materially higher levels
- Emergency monetary policy responses become possible
- Countries most dependent on Gulf energy imports, particularly across South and Southeast Asia, face acute balance-of-payments pressure and currency stress
The next major ASX story will hit our subscribers first
Investor Strategy: Navigating Hormuz Uncertainty Without Mistiming Diplomacy
Why Trading Diplomatic Headlines Is a Systematic Trap
One of the most consistent behavioural errors during geopolitical energy disruptions is attempting to position around specific diplomatic milestones. The fundamental flaw in this approach is that a negotiated framework does not clear sea mines, a political announcement does not restore insurer confidence, and a headline agreement does not reposition diverted tankers. Investors who buy risk assets on diplomatic progress and then face continued physical supply constraints experience a pattern of repeated disappointment.
Portfolio Resilience Principles During Sustained Energy Disruption
Building portfolio durability through Hormuz uncertainty involves a set of principles that prioritise staying power over precise timing:
- Prioritise lower financial leverage and longer debt maturity profiles to reduce near-term refinancing exposure when borrowing costs are elevated
- Assess free cash flow stability rather than earnings multiples, which can be distorted by temporary margin compression across energy-intensive operations
- Evaluate energy cost as a proportion of total operating costs for each major holding to identify which positions face the greatest direct fuel cost exposure
- Maintain liquidity buffers rather than deploying capital aggressively into positions that require precise timing of geopolitical resolution
- Avoid forced-risk positioning that assumes a specific diplomatic or operational timeline
Key Normalisation Indicators to Monitor
The thesis that sustained Strait of Hormuz disruption and oil prices will continue to pressure inflation and monetary policy weakens only when three conditions occur simultaneously:
| Indicator | Signal of Normalisation |
|---|---|
| Brent Crude Price | Sustained decline below pre-escalation levels |
| US 10-Year Treasury Yield | Declining yield signalling reduced inflation expectations |
| CME FedWatch Rate Hike Probability | Falling below 30% |
| War Risk Insurance Premiums | Declining Gulf conflict zone surcharges |
| Tanker Booking Activity | Resumption of normal Hormuz transit bookings |
| Doha Negotiation Status | Verified operational agreement, not just political statement |
Investors monitoring only one or two of these indicators risk misreading partial signals as confirmation of full normalisation. All three primary conditions — verified Brent crude decline, confirmed operational transit resumption, and US 10-year Treasury yield retreat — need to move together before the higher-inflation, higher-rates thesis can be credibly set aside.
Frequently Asked Questions: Strait of Hormuz Disruption and Oil Prices
How much oil passes through the Strait of Hormuz each day?
Approximately 20 million barrels per day transited the Strait of Hormuz in 2024, representing roughly 20% of global petroleum liquids consumption according to the U.S. Energy Information Administration's 2025 maritime chokepoint assessment.
How high could oil prices go if the Strait of Hormuz is fully closed?
Scenario modelling and historical disruption analogues suggest Brent crude could test the $120 to $130+ per barrel range under a full, extended closure. Partial disruption has historically moved Brent into the $103 to $107 range, while the May 2026 escalation pushed prices above $98 per barrel on disruption risk alone before any confirmed physical supply shortage.
Why does Hormuz disruption increase the probability of Federal Reserve rate hikes?
Oil price increases feed into freight costs, petrochemical inputs, and electricity prices across a lag period of four to eight weeks before appearing in official CPI data. This inflation pressure reduces the Federal Reserve's ability to cut rates and increases tightening probability, as reflected in the 56% December rate hike probability priced by CME FedWatch markets following the May 26, 2026 escalation.
Which countries benefit when the Strait of Hormuz is disrupted?
Energy-exporting nations outside the Gulf region benefit from higher global crude prices during Hormuz disruption. The United States, Canada, and Algeria are among the primary beneficiaries, as their production becomes more attractive to buyers seeking supply security away from the conflict zone.
Can strategic petroleum reserves offset a Hormuz closure?
IEA strategic petroleum reserves provide a buffer measured in weeks rather than months under sustained disruption scenarios. They serve as a bridging mechanism for short-term supply shocks, not a structural solution to prolonged chokepoint closure.
This article contains forward-looking analysis, scenario projections, and market probability assessments that are subject to change based on evolving geopolitical and economic conditions. Nothing in this article constitutes financial advice. All investment decisions should be made in consultation with qualified financial professionals.
Want to Stay Ahead of the Next Major Commodity Discovery Driven by Geopolitical Shifts?
While geopolitical tensions reshape global energy markets, significant mineral discoveries on the ASX can offer compelling opportunities for investors seeking exposure beyond oil price volatility — and Discovery Alert's proprietary Discovery IQ model delivers real-time alerts the moment those discoveries are announced, turning complex data across 30+ commodities into clear, actionable insights. Explore why historic discoveries have generated substantial returns on Discovery Alert's dedicated discoveries page, and begin your 14-day free trial today to position yourself ahead of the broader market.