May 10, 2026
The Hidden Architecture of Vulnerability: How Energy Supply Chains Break
The Strait of Hormuz energy crunch is more than a geopolitical flashpoint. It is a real-time stress test of an energy system built for efficiency rather than resilience. Every decade or so, markets face a shock that exposes hidden fragilities, and this episode is doing so on a scale few policymakers or traders expected.
Understanding why this crisis is different from prior oil shocks requires stepping back from the headlines. The Strait is not simply a narrow waterway. Rather, it is a load-bearing pillar of global energy infrastructure, and that pillar is under extraordinary strain.
Why the Strait of Hormuz Is the Single Most Dangerous Chokepoint in Global Energy Markets
The Geometry of Vulnerability
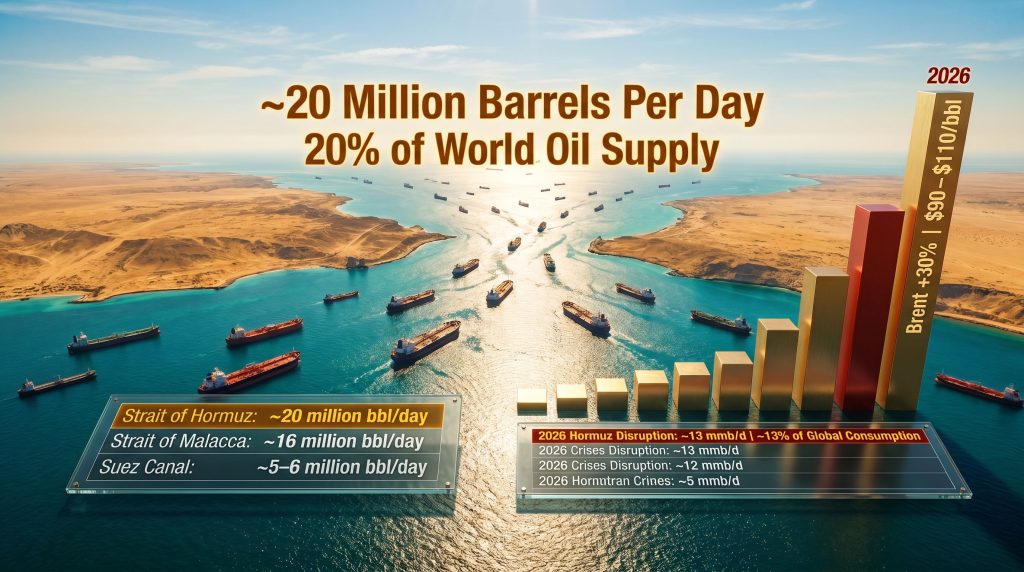
Approximately 20 million barrels of oil per day normally transit the Strait of Hormuz. That equals roughly one-fifth of global oil consumption. In addition, the corridor is essential for Qatari LNG exports, naphtha, refined fuels and petrochemical feedstocks bound for Asia and Europe.
What makes the Strait uniquely dangerous is not only the volume, but also the lack of a workable alternative. Unlike the Suez Canal, where ships can reroute around the Cape of Good Hope, Hormuz offers no scalable bypass. Saudi and UAE pipelines help, but their combined capacity remains far below normal throughput.
Comparing the Strait to Other Maritime Corridors
The contrast becomes clearer when measured against other bottlenecks:
- Strait of Hormuz: ~20 million bbl/day, bypass options extremely limited
- Suez Canal: ~5–6 million bbl/day, rerouting possible though costly
- Strait of Malacca: ~16 million bbl/day, partial alternatives exist
- Turkish Straits: ~3 million bbl/day, pipeline options available
Consequently, a closure or partial shutdown in Hormuz is structurally more severe than delays elsewhere. As the Council on Foreign Relations notes in its analysis of an unprecedented energy crunch, even temporary restrictions can trigger outsized disruption across oil and gas markets.
How Does the 2026 Hormuz Disruption Compare to Previous Oil Crises?
The Largest Supply Disruption on Record
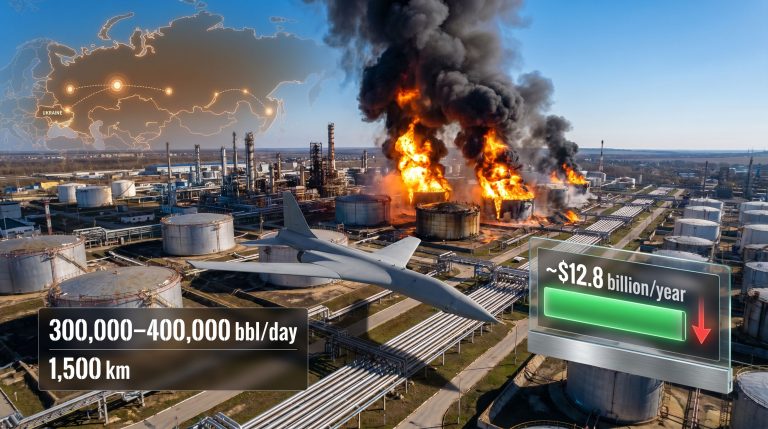
Most major oil disruptions in the last half century removed between 1.5 million and 4.3 million barrels per day. By contrast, the current crisis has stripped an estimated 13 million barrels per day from markets, or about 13% of global oil consumption.
Since conflict began on 28 February 2026, lost flow has exceeded half a billion barrels. The International Energy Agency has described it as the largest oil market supply loss on record. No earlier crisis has matched this scale.
The February 28 Trigger
The immediate trigger was military escalation involving Iran on 28 February 2026, which rapidly disrupted tanker traffic. Although a ceasefire was announced on 8 April 2026, shipping has not returned to normal. War-risk insurance remains elevated, and many operators are still reluctant to resume regular schedules.
That is why the Strait of Hormuz energy crunch has outlived the battlefield phase. In practical terms, insurance, security protocols and damaged infrastructure are now shaping supply just as much as the original conflict.
What Is Actually Flowing — and What Is Not?
The often-cited 20 million barrels per day figure includes several categories, each with separate downstream impacts:
- Crude oil, the main export stream
- Liquefied natural gas, especially from Qatar
- Naphtha and petrochemical feedstocks
- Refined products, including jet fuel, diesel and heating oil
The Petrochemical Dimension
Most commentary centres on crude benchmarks and petrol prices. However, the interruption in naphtha flows could prove just as significant over time. Around 85% of Middle Eastern polyethylene exports transit this corridor, feeding industries such as textiles, electronics and pharmaceuticals.
As a result, today’s shipping disruption may become tomorrow’s manufacturing inflation. Packaging, synthetic fibres, electronic housings and pharmaceutical materials could all face delayed cost pressure.
Which Regions Are Most Exposed?
Asia-Pacific: The Epicentre of Physical Stress
India is especially vulnerable. Around 90% of its LPG imports transit the Strait, and over 40% of its fertiliser imports come from Middle Eastern suppliers. Furthermore, roughly 30% of global fertiliser trade passes through Hormuz, making the region’s wider fertilizer import reliance a key vulnerability.
This matters because shortages in fuel and fertiliser can reinforce each other. With the monsoon planting season approaching, pressure on Indian agriculture could feed directly into food inflation and crop risk.
Japan and South Korea also face major exposure, receiving roughly 11% and 12% respectively of Strait-transiting oil shipments. Both countries have strategic reserves, yet replacement cargoes are becoming more expensive and harder to secure.
The Philippines may be even more financially exposed, sourcing roughly 98% of its oil imports from the Middle East. Across Southeast Asia, weaker currencies and limited reserve capacity amplify the danger.
Europe: Price Contagion and Jet Fuel Stress
Europe’s exposure is less about direct physical dependence and more about price transmission. Around half of European jet fuel imports previously came from Middle Eastern refineries. The IEA has warned of a possible critical shortfall by June 2026.
Lufthansa has said a prolonged closure could add around $2 billion to fuel costs. Meanwhile, the EU has absorbed roughly €24 billion in extra fossil fuel import costs since the conflict began.
In addition, Europe is now competing more aggressively for replacement gas cargoes. That is tightening the global LNG supply outlook and raising prices across both European and Asian spot markets.
The United States: Buffered, Not Protected
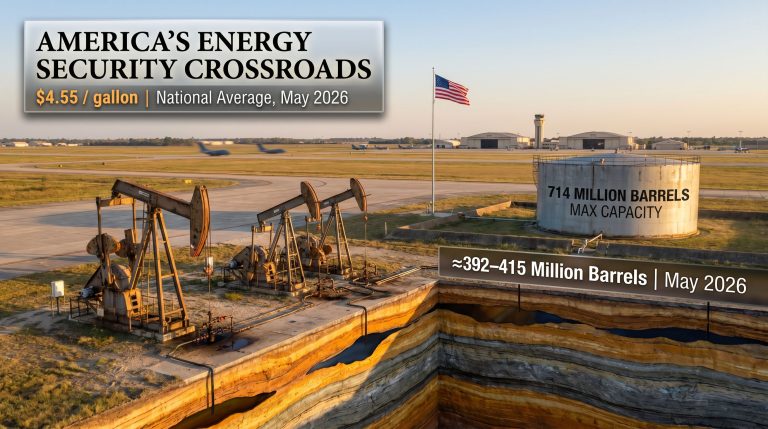
The United States is better insulated than many importers because of strong domestic production and refining capacity. Persian Gulf crude makes up only a modest share of total imports. Even so, globally traded oil means domestic motorists still feel the pain.
U.S. average petrol prices have exceeded $4.50 per gallon, while diesel has climbed even faster. That pattern matters because diesel inflation often feeds directly into freight, agriculture and industrial costs. For context on how these pricing mechanisms spread, the oil price rally dynamics seen in broader commodity markets offer a useful comparison.
The Three-Phase Anatomy of a Major Oil Supply Shock
Phase One: Price Repricing
This stage is already underway:
- Brent crude up roughly 30%
- Trading in the $90–$110 per barrel range
- About 0.8 percentage points of added global inflation pressure
Phase Two: Physical Tightening
This stage is already visible in parts of Asia and Europe:
- Fuel rationing in South Asia
- European aviation route cuts
- Petrochemical-linked manufacturing delays
- 10-year seasonal lows in jet fuel exports during April 2026
- More than 40 India-bound ships trapped near the Strait
Phase Three: Demand Destruction
If conditions persist, the next stage may include:
- Refinery run cuts
- Strategic reserve drawdowns
- Forced demand reduction
- Slower GDP growth in import-dependent economies
Therefore, the Strait of Hormuz energy crunch is no longer just a pricing story. In several regions, it is becoming a real-economy constraint.
Is There Any Viable Alternative to the Strait of Hormuz?
Pipeline Bypass Reality
Saudi Arabia’s East-West Pipeline and UAE export infrastructure can only cover part of normal traffic. Combined capacity is nowhere near the 20 million barrels per day usually moving through the corridor. That makes bypass talk far less reassuring than it sounds.
Why This Is Different from a Canal Blockage
A canal blockage delays cargo. Hormuz removes scale from the system. That is the crucial distinction. Time, insurance and logistical reconfiguration all add friction, but the deepest problem is that the missing volumes simply cannot be replaced quickly.
This also intersects with wider global trade disruption risks, because delayed energy flows often ripple into shipping, manufacturing and commodity markets far beyond the Gulf itself.
What Happens to Manufacturing When Feedstocks Are Disrupted?
The Naphtha-to-Consumer Pipeline
Naphtha from Gulf crude underpins a long chain of products:
- Plastics and polymer packaging
- Synthetic textiles
- Pharmaceutical packaging
- Semiconductor and electronics components
Because 85% of Middle Eastern polyethylene exports transit the Strait, a prolonged slowdown could raise costs across multiple industrial sectors. Moreover, these pressures tend to surface with a lag, making them easy to underestimate in the early weeks of a crisis.
According to the United States Studies Centre’s global energy crisis risks analysis, the cumulative effects on fuel, shipping and industrial inputs could be more economically damaging than the immediate crude spike alone.
Post-Ceasefire Reality: Why the April 8 Truce Did Not End the Crisis
What the Ceasefire Changed — and What It Did Not
The ceasefire halted active hostilities, but it did not restore confidence. Tanker movements remain well below pre-conflict levels, and insurers continue to charge steep premiums. One tanker reaching South Korea through the Strait was treated as a milestone, which says a great deal about how abnormal conditions still are.
Qatar’s LNG Damage and the Wider Transition Question
Damage to Qatari infrastructure has created a structural gas shortfall that cannot be repaired overnight. Since Qatar is the world’s largest LNG exporter, the implications reach far beyond the Gulf. Europe and Asia are bidding against each other for replacement cargoes, pushing prices higher.
Longer term, crises like this may accelerate the energy security transition already under way. The more often chokepoints fail, the stronger the economic case for diversification, electrification and strategic redundancy becomes.
FAQ: Strait of Hormuz Energy Crunch
What percentage of global oil passes through the Strait of Hormuz?
Roughly 20% of global oil supply, or about 20 million barrels per day, normally passes through the Strait.
How much supply has been disrupted?
Current estimates suggest around 13 million barrels per day have been removed from normal flow since 28 February 2026.
Can strategic reserves solve the problem?
No. The 2022 U.S. SPR release supplied about 1 million barrels per day, whereas this disruption is roughly 13 times larger.
Why does this affect food prices as well as fuel?
Because fertiliser, gas and petrochemical inputs all depend on reliable energy trade. If those flows remain unstable, crop yields and food prices can also come under pressure.
The Long-Term Structural Lesson
For decades, the global economy prioritised speed, low inventories and just-in-time delivery. However, the Strait of Hormuz energy crunch shows what happens when that model meets a disruption too large for reserve systems to absorb.
Investors, businesses and policymakers should now be modelling several risks:
- Reserve adequacy
- Refinery margin compression
- Agricultural input shortages
- Manufacturing cost cascades
- Faster non-fossil investment
Ultimately, energy shocks rarely stay local. They spread through shipping, pricing and trade channels before appearing in household budgets. What looks like a regional security episode is, in practice, a global systems failure unfolding in slow motion.
Want To Capitalise On The Market Opportunities Created By Major Resource Discoveries?
Discovery Alert's proprietary Discovery IQ model scans ASX announcements in real time, instantly identifying high-potential mineral discoveries and translating complex data into actionable investment insights — the same kind of structural shifts in commodity demand that crises like the Hormuz disruption ultimately drive. Start your 14-day free trial today, or explore Discovery Alert's discoveries page to see how historic ASX discoveries have delivered exceptional returns for well-positioned investors.