June 20, 2026
Energy markets worldwide operate within a complex web of geographic vulnerabilities where single points of failure can trigger cascading economic disruptions. The concentration of global petroleum flows through narrow maritime passages creates systemic risk exposures that extend far beyond immediate supply calculations. These chokepoint dependencies have evolved into critical infrastructure concerns where geopolitical tensions translate directly into price volatility across interconnected energy systems. The recent Strait of Hormuz disruption scenarios have highlighted the fragility of global energy supply chains and their potential for widespread economic impact.
What Makes the Strait of Hormuz Critical to Global Energy Security?
Geographic Bottleneck Analysis
The strategic positioning of this critical maritime passage between the Persian Gulf and Arabian Sea creates one of the world's most significant energy infrastructure vulnerabilities. At its narrowest point, known as the Strait Proper, the passage measures approximately 21 nautical miles between Oman's Musandam Peninsula and Iranian territory. However, the operational reality proves even more constrained, with main traffic lanes restricted to approximately 2 nautical miles in each direction, separated by a 2-nautical-mile buffer zone.
This geographic configuration forces approximately 90+ vessels daily through a confined corridor where collision risks escalate during peak transit periods. The International Maritime Organization's Traffic Separation Scheme provides structural organisation, yet the fundamental constraint remains: northbound and southbound traffic must navigate within close proximity at the narrowest chokepoint, creating inherent operational vulnerabilities during crisis scenarios.
Navigation challenges intensify during monsoon seasons when southwest weather patterns from June through September compound geopolitical risks with natural transit constraints. These seasonal variations demonstrate how environmental factors can amplify supply chain vulnerabilities beyond human conflict considerations, as noted in the oil price rally analysis.
Global Energy Flow Dependencies
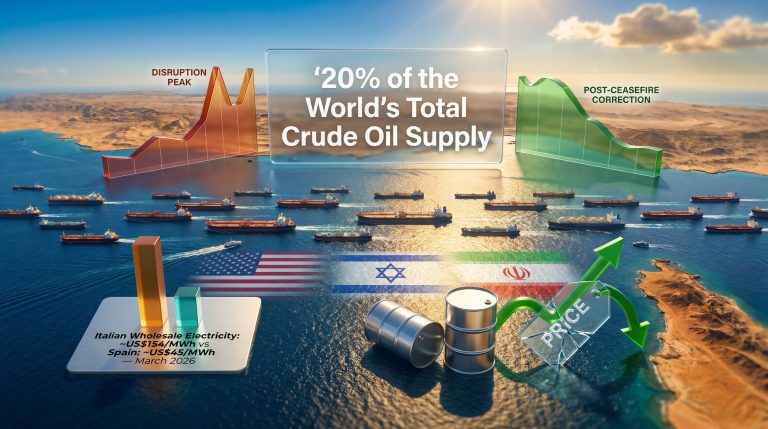
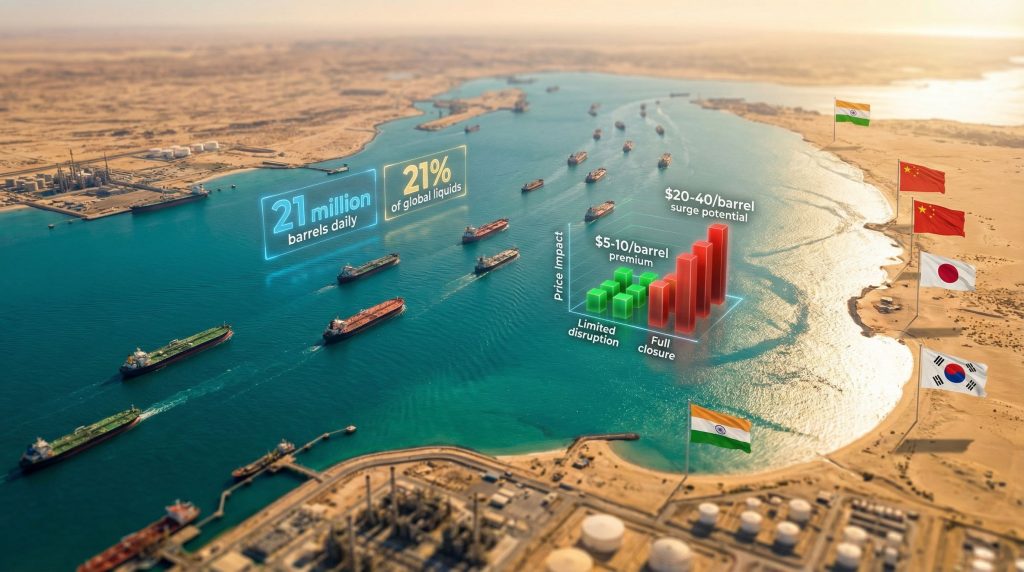
The scale of energy dependency flowing through this single passage creates asymmetric risk exposure across global markets. Current transit volumes represent approximately 21 million barrels per day of petroleum liquids, constituting roughly 21% of global trade. Simultaneously, 70-75 million tonnes of liquefied natural gas move through these waters annually, representing approximately 20% of worldwide seaborne LNG commerce.
Regional Producer Dependencies by Transit Volume:
| Country/Region | Daily Production | Strait Dependence | Export Volume via Strait |
|---|---|---|---|
| Saudi Arabia | 13.5 million bbl/d | 85-90% of exports | 7-8 million bbl/d |
| Iraq | 4.5-5.0 million bbl/d | 70-80% of exports | 3.5-4.0 million bbl/d |
| Iran | 3.2-3.5 million bbl/d | 90%+ of exports | 2.5+ million bbl/d |
| UAE | 3.0 million bbl/d | 60-70% of exports | 1.5-2.0 million bbl/d |
| Kuwait | 2.7 million bbl/d | 90%+ of exports | 2.0+ million bbl/d |
These concentration levels reveal structural dependencies where individual producer nations lack diversified export corridors. The International Energy Agency emphasises that disruptions to this chokepoint immediately impact global crude availability and pricing mechanisms across all consuming regions, regardless of geographic proximity to Persian Gulf production zones. Furthermore, experts warn that tensions in the Strait of Hormuz could disrupt global oil supplies, affecting energy security worldwide.
Alternative Route Economics
Pipeline bypass infrastructure represents the primary alternative to maritime transit, yet current capacity limitations expose significant gaps in crisis response capabilities. Existing bypass systems include:
- Saudi East-West Pipeline to Yanbu Terminal: 5 million bbl/d capacity
- SUMED Pipeline (Egypt-Red Sea route): 5 million bbl/d capacity
- UAE Pipeline to Fujairah Terminal: 1.5 million bbl/d estimated capacity
- Kirkuk-Ceyhan Pipeline: 0.6-1.2 million bbl/d operational capacity (frequently disrupted)
Combined alternative pipeline infrastructure totals approximately 12-13 million bbl/d of potential rerouting capacity. This creates a structural deficit of 8-9 million bbl/d during complete Strait of Hormuz disruption scenarios, representing the difference between normal transit volumes and bypass alternatives.
Cape of Good Hope maritime rerouting adds approximately 3,000-3,500 nautical miles to tanker journeys, increasing transit time by 14-21 days and raising transportation costs by $1.5-2.5 per barrel. Insurance premiums escalate dramatically during rerouting scenarios, with war risk coverage reaching $1 million+ per tanker based on historical precedents from the 1987-1988 Tanker War period.
When big ASX news breaks, our subscribers know first
How Do Geopolitical Tensions Translate into Energy Price Volatility?
Risk Premium Calculation Models
Energy price formation during geopolitical crises incorporates multiple risk assessment layers beyond mechanical supply disruption calculations. Financial modelling frameworks distinguish between immediate supply loss impacts and anticipatory risk premiums that can exceed fundamental shortage pricing by 100-200%. Moreover, oil price movements during such crises often demonstrate extreme volatility patterns.
Market economists have established that geopolitical disruptions produce immediate price responses of $2-4 per barrel within 24 hours for every 1 million bbl/d of supply loss, with multiplier effects adding 50-100% additional premium within 5-7 trading days.
Risk premium calculations incorporate probability assessments across five critical variables:
- Supply Disruption Likelihood: Market estimates of actual closure probability
- Duration Expectations: Assumed length of disruption (days versus weeks versus months)
- Alternative Supply Availability: Spare capacity from non-OPEC producers and strategic reserves
- Demand Response Elasticity: Consumption reduction assumptions at elevated price levels
- Global Inventory Position: Current days-of-supply in worldwide storage systems
Recent analysis from financial institutions demonstrates that every $1 increase in crude prices raises major importing nations' annual bills by approximately $2 billion, translating to 0.15-0.20% of GDP impact before considering indirect transmission through currency depreciation and supply chain cost escalation.
Scenario-Based Price Impact Projections
Current market assessment frameworks project distinct price impact ranges based on escalation severity levels. Additionally, analysis shows how tariffs impact markets during periods of heightened geopolitical tension.
Price Impact Matrix by Disruption Scenario:
| Scenario Type | Price Premium Range | Market Mechanism |
|---|---|---|
| Limited Retaliation | $5-10/barrel | Risk premium anticipation |
| Infrastructure Damage | $10-12/barrel | Mechanical supply reduction |
| Full Strait Closure | $20-40/barrel | Combination of supply loss and panic premium |
| Regional Conflict Escalation | $100+/barrel | Complete market disruption with emergency protocols |
These projections reflect March 2026 baseline pricing where Brent crude trades at $82.53/barrel and WTI at $75.37/barrel. Historical precedent analysis reveals that geopolitical fear premiums often exceed mechanical supply calculations, as demonstrated during the 2022 Russia-Ukraine conflict when risk premiums reached $30-40/barrel above direct supply impact assessments.
Insurance and Shipping Cost Amplification
Maritime insurance markets respond rapidly to Strait of Hormuz disruption through war risk premium escalation. Lloyd's of London historical data from 1987-1988 Iranian mining incidents shows one-way insurance costs reaching $1 million+ per tanker, effectively removing approximately 10% of daily transit volume through shipping company risk avoidance decisions.
Commercial shipping operators implement decision matrices weighing:
- Insurance premium costs versus alternative routing expenses
- Crew safety protocols and hazardous duty compensation
- Cargo delivery guarantees and force majeure clause activation
- Long-term contract obligations versus spot market opportunities
These commercial calculations create feedback loops where reduced shipping availability amplifies price premiums beyond direct supply disruption impacts. Recent reports indicate that China has called for protection of vessels amid soaring shipping costs through this critical waterway.
Which Energy Markets Face Maximum Exposure During Strait Disruptions?
Asian Import Dependency Analysis
Asian consuming nations demonstrate the highest structural vulnerability to Strait of Hormuz disruption scenarios. India's energy security framework reveals particular exposure with approximately 40% of crude imports transiting through this maritime chokepoint. This dependency translates to immediate economic transmission when supply disruptions occur.
Regional Vulnerability Assessment:
- India: 40% of crude imports via Strait, representing $35-40 billion annual value
- China: 25-30% of crude imports, approximately $60-70 billion annual exposure
- Japan: 85% of crude imports from Middle East, substantial Strait dependency
- South Korea: 70%+ Middle Eastern crude reliance, high transit vulnerability
These dependency levels create immediate currency pressure for importing nations during crisis periods. Reserve Bank of India intervention capabilities can moderate rupee depreciation to 2-4% during sustained oil price increases, yet foreign exchange reserve deployment cannot eliminate underlying balance of payments pressure from elevated import costs.
European Energy Security Implications
European LNG import strategies face significant disruption potential as approximately 20% of global seaborne LNG trade transits the Strait. This exposure compounds existing energy security challenges from reduced Russian pipeline imports, creating dual supply risk scenarios.
European strategic gas storage utilisation protocols activate when LNG supply disruptions persist beyond 7-10 days. However, storage capacity provides limited buffer during extended Strait closures, particularly during winter heating seasons when demand peaks coincide with supply vulnerability. In contrast, the US natural gas outlook remains relatively insulated from Middle Eastern supply disruptions.
North American Market Insulation Factors
United States energy markets demonstrate relative insulation from Strait disruptions through domestic production capacity and strategic reserve capabilities. Current U.S. crude production exceeds 12-13 million bbl/d, providing substantial buffer against international supply disruptions.
Strategic Petroleum Reserve deployment protocols allow for 4.2 million bbl/d release capacity for up to 90 days, offering significant crisis response capability. However, refined product markets remain exposed to global price transmission despite crude oil self-sufficiency.
Canada's energy export capability provides additional North American supply flexibility, with pipeline infrastructure capable of redirecting crude oil flows from international to domestic markets during global supply constraints.
What Are the Immediate Economic Transmission Mechanisms?
Inflation Pathway Analysis
Energy price increases trigger cascading inflationary pressures through multiple transmission channels that compound initial commodity cost impacts. Additionally, the global trade impact of such disruptions extends far beyond immediate energy concerns.
Primary Economic Cascade Effects:
- Transportation fuel cost increases affecting logistics and distribution
- Manufacturing input price rises for energy-intensive industries
- Consumer goods price adjustments throughout retail supply chains
- Central bank policy response triggers addressing inflation expectations
Airlines implement fuel surcharge mechanisms typically within 2-5 weeks of sustained oil price increases, while shipping companies adjust container and freight rates within 1-3 months. Chemical industry feedstock repricing occurs almost immediately, affecting plastics and polymer manufacturing costs within days.
Secondary transmission effects emerge 4-8 weeks after initial energy price spikes, as manufacturing input cost adjustments propagate through supply chains. Tertiary transmission requires 8-16 weeks for complete consumer goods price adjustments, when inflation expectations begin influencing wage negotiations and monetary policy responses.
Currency and Bond Market Reactions
Oil-importing nations experience immediate currency depreciation pressure as elevated import bills accelerate capital outflows. Historical analysis reveals 2-4 day lag periods before sustained oil price increases translate to measurable currency weakness.
Government bond markets respond through yield adjustment mechanisms as inflation expectations shift monetary policy calculations. Rising yields compress equity valuation multiples, creating negative feedback loops for stock market performance across energy-sensitive sectors.
Corporate credit spread widening occurs simultaneously as companies face margin pressure from elevated energy input costs. Investment grade credit spreads typically widen 10-25 basis points within two weeks of sustained $10+/barrel oil price increases.
Equity Market Sector Rotation Dynamics
Energy sector equity performance demonstrates inverse correlation with broader market indices during Strait of Hormuz disruption scenarios. Upstream oil and gas exploration companies capture immediate valuation premiums from higher realised pricing, while downstream refining operations face margin pressure from crude cost increases.
Transportation sector exposure creates immediate negative pressure on airline, shipping, and logistics company valuations. Airlines face dual pressure from increased fuel costs and reduced discretionary travel demand as consumer spending power diminishes.
Consumer discretionary spending impacts emerge within 4-6 weeks as household budgets adjust to elevated transportation and heating costs. Retail sector performance correlates negatively with sustained energy price increases above $85/barrel Brent crude levels.
How Do Strategic Reserves and Alternative Supplies Respond?
International Energy Agency Coordination Protocols
IEA member countries maintain coordinated response capabilities through mandatory strategic petroleum reserve obligations. Current member nation reserves total approximately 1.5 billion barrels, representing roughly 90-120 days of import coverage during complete supply disruptions.
Coordinated release mechanisms activate when supply disruptions exceed 2 million bbl/d for periods greater than 7 days. Historical precedent from 1991 Gulf War and 2005 Hurricane Katrina responses demonstrates 30-60 day lag periods between IEA coordination decisions and meaningful market supply increases.
Emergency Production Capacity by Region:
| Region/Country | Spare Capacity | Ramp-up Timeline | Sustainability |
|---|---|---|---|
| Saudi Arabia | 2-3 million bbl/d | 30-90 days | 12+ months |
| UAE | 0.5-1.0 million bbl/d | 60-90 days | 6-12 months |
| US Shale | 1-2 million bbl/d | 90-180 days | 24+ months |
| Other OPEC | 0.5-1.5 million bbl/d | 60-120 days | 6-18 months |
Alternative Supply Source Activation
OPEC spare capacity utilisation represents the primary rapid response mechanism for Strait of Hormuz disruption scenarios. Saudi Arabia's swing production capability of 2-3 million bbl/d can activate within 30-90 days, providing substantial offset capacity for Iranian or Iraqi supply losses.
U.S. shale production demonstrates longer activation timelines but greater sustainability. Drilling rig reactivation and completion crew deployment require 90-180 days for meaningful production increases, yet technological improvements in horizontal drilling and hydraulic fracturing provide scalable response capabilities.
Non-OPEC producer response capabilities include Canadian oil sands expansion, North Sea field optimisation, and Brazilian offshore development acceleration. These sources require 6-24 month development timelines but offer sustained production increases beyond emergency response periods.
Demand Destruction Threshold Analysis
Price elasticity analysis reveals demand reduction thresholds where consumption patterns shift permanently rather than temporarily. Historical data indicates gasoline demand destruction accelerates when retail prices exceed $4.50-5.00/gallon in U.S. markets, equivalent to $110-120/barrel crude oil pricing.
Industrial fuel switching alternatives activate at different price thresholds across sectors:
- Power generation: Natural gas switching at $90-100/barrel oil equivalent
- Chemical feedstock: Alternative inputs become economic at $85-95/barrel levels
- Transportation fuels: Biofuel blending increases at $80-90/barrel crude pricing
Consumer behaviour modification patterns demonstrate measurable changes in discretionary driving, vacation travel, and vehicle purchasing decisions when gasoline prices sustain increases above 20-25% from baseline levels for periods exceeding 8-12 weeks.
What Long-Term Strategic Adaptations Emerge from Disruption Scenarios?
Infrastructure Diversification Investments
Prolonged Strait of Hormuz tension scenarios accelerate pipeline development projects and LNG terminal expansion initiatives across consuming regions. Historical analysis of 1970s oil shock responses demonstrates 5-10 year infrastructure investment cycles triggered by sustained supply vulnerability concerns.
Pipeline diversification priorities include:
- Trans-Arabian Pipeline expansion for Saudi crude export alternatives
- Iraq-Turkey pipeline rehabilitation reducing Strait dependency
- Iranian pipeline development through Central Asian corridors
- LNG terminal capacity expansion in Asian importing nations
Renewable energy transition pace adjustments emerge as strategic responses to fossil fuel supply vulnerability. Solar and wind deployment acceleration receives additional policy support during extended energy security concerns, though infrastructure timelines require 3-7 years for meaningful supply contributions.
Supply Chain Resilience Building
Strategic partnership restructuring occurs as importing nations diversify supplier relationships beyond Middle Eastern producers. Long-term supply contracts with Canadian, Norwegian, Brazilian, and Guyanese producers increase during periods of Persian Gulf supply uncertainty.
Inventory management protocol updates expand strategic storage requirements across consuming nations. Japan, South Korea, and European Union member states implement enhanced reserve obligations requiring 90-180 day import coverage rather than traditional 60-90 day minimums.
Technology adoption for efficiency gains accelerates during energy cost pressure periods. Industrial energy management systems, transportation fleet optimisation, and building efficiency upgrades receive accelerated investment during sustained high energy price environments.
Policy Framework Evolution
Energy security legislation updates expand government authority for emergency response coordination, strategic reserve management, and supply chain diversification incentives. National security considerations increasingly influence energy infrastructure permitting and international trade policy decisions.
International cooperation agreement modifications strengthen coordination mechanisms between consuming nations for crisis response, reserve sharing, and alternative supply development financing. These frameworks extend beyond traditional IEA member coordination to include major Asian consuming nations.
Emergency response capability enhancements incorporate lessons learned from supply disruption scenarios, improving coordination between government agencies, private sector operators, and international partners during crisis periods.
The next major ASX story will hit our subscribers first
How Should Investors Position for Strait of Hormuz Risk Scenarios?
Energy Sector Investment Implications
Upstream exploration and production companies demonstrate asymmetric upside potential during Strait of Hormuz disruption scenarios through elevated realised pricing. Companies with diversified geographic production portfolios outside Middle Eastern operations capture premium valuations without operational risk exposure.
Refining margin expansion opportunities emerge for facilities with flexible crude input capabilities and strategic storage capacity. Refineries with access to alternative crude sources through pipeline infrastructure rather than maritime transport demonstrate operational advantages during shipping disruptions.
Alternative energy acceleration benefits encompass renewable energy infrastructure developers, energy storage technology providers, and electric vehicle charging network operators. Extended fossil fuel price volatility accelerates adoption timelines and policy support for energy transition investments.
Geographic Diversification Strategies
Non-Middle Eastern producer exposure provides portfolio protection through Canadian oil sands operators, North Sea energy companies, and U.S. shale producers. These investments capture elevated pricing benefits while avoiding operational disruption risks from regional conflicts.
Renewable energy infrastructure investments offer dual benefits of portfolio diversification and exposure to accelerated adoption during fossil fuel supply uncertainty periods. Solar, wind, and battery storage companies demonstrate negative correlation with traditional energy price volatility.
Energy storage technology positioning includes lithium mining companies, battery manufacturers, and grid-scale storage developers. Extended energy price volatility increases investment in storage capacity for supply security and price arbitrage opportunities.
Risk Management Portfolio Adjustments
Professional investment guidance becomes essential during Strait disruption scenarios as energy, currency, and inflation-sensitive assets require comprehensive risk assessment across multiple correlation factors.
Currency hedging strategies address oil-importing nation depreciation exposure through U.S. dollar positioning or commodity currency exposure. Canadian dollar, Norwegian krone, and Brazilian real demonstrate positive correlation with elevated energy prices.
Inflation-protected securities provide portfolio stability during energy-driven inflation periods. Treasury Inflation-Protected Securities (TIPS) and international inflation-linked bonds offer protection against purchasing power erosion from energy cost transmission.
Frequently Asked Questions About Strait of Hormuz Disruptions
How Long Can Global Markets Function During a Complete Closure?
Strategic petroleum reserves and alternative supply activation provide approximately 90-120 days of buffer capacity before permanent demand destruction becomes necessary. However, price premiums of $20-40/barrel emerge within days of closure scenarios, accelerating demand reduction and alternative supply responses.
What Historical Precedents Exist for Similar Disruptions?
The 1987-1988 Tanker War demonstrated sustained shipping disruption impacts, with 540+ merchant vessel attacks reducing transit volumes by 10-15%. The 1990-1991 Gulf War temporarily removed 4-5 million bbl/d from markets, triggering $25/barrel price spikes before strategic reserve deployment and alternative supply activation normalised markets within 6 months.
Which Countries Have the Most Effective Contingency Plans?
Japan maintains 200+ days of strategic oil reserves combined with diversified LNG supplier agreements. Germany has implemented renewable energy transition policies reducing fossil fuel dependency. The United States combines domestic production capacity with strategic petroleum reserves for comprehensive energy security.
How Do Renewable Energy Transitions Affect Strait Dependency?
Renewable energy deployment reduces electricity generation dependency on oil and gas imports, though transportation fuel requirements maintain petroleum import exposure. Complete transition timelines require 10-20 years for meaningful reduction in Strait of Hormuz disruption vulnerability.
Disclaimer: This analysis contains forward-looking projections and scenario assessments that involve significant uncertainty. Energy price forecasting, geopolitical risk evaluation, and investment strategy recommendations should not be considered guaranteed outcomes. Readers should consult qualified financial advisors and conduct independent research before making investment decisions based on information contained in this analysis. Historical precedents may not predict future market behaviour during crisis scenarios.
Looking to Navigate Energy Market Volatility?
When geopolitical tensions threaten critical energy chokepoints like the Strait of Hormuz, staying ahead of market disruptions becomes essential for investment success. Discovery Alert's proprietary Discovery IQ model delivers real-time alerts on significant ASX mineral discoveries, helping investors identify energy and resource opportunities before broader market recognition during volatile periods.