
May 14, 2026
The Arterial Valve of the Global Economy: Understanding the Strait of Hormuz Oil Crisis
Throughout the long history of commodity markets, few structural vulnerabilities have proven as consequential as geographic concentration risk. When a single physical corridor controls the movement of roughly one-fifth of all oil traded across the world, the conditions for catastrophic systemic failure are not theoretical. They are architectural. The Strait of Hormuz shutdown oil crisis unfolding since February 2026 is not a regional dispute that has inconveniently disrupted shipping routes. It is a real-time demonstration of how deeply the global economy remains tethered to a 21-mile-wide passage of water separating the Persian Gulf from the Gulf of Oman.
Understanding why this crisis has escalated to the scale the International Energy Agency now describes as the largest supply disruption in the history of the global oil market requires more than tracking barrel counts. It requires grasping the layered mechanisms through which geography, geopolitics, inventory dynamics, and demand psychology interact to produce outcomes that are both foreseeable in structure and staggering in magnitude.
When big ASX news breaks, our subscribers know first
Why No Other Chokepoint Compares to Hormuz
The world's energy system depends on a surprisingly small number of maritime passages to function. The Suez Canal, the Strait of Malacca, the Bab-el-Mandeb, and the Strait of Hormuz each carry significant volumes of seaborne energy trade. However, Hormuz occupies a categorically different position in this hierarchy.
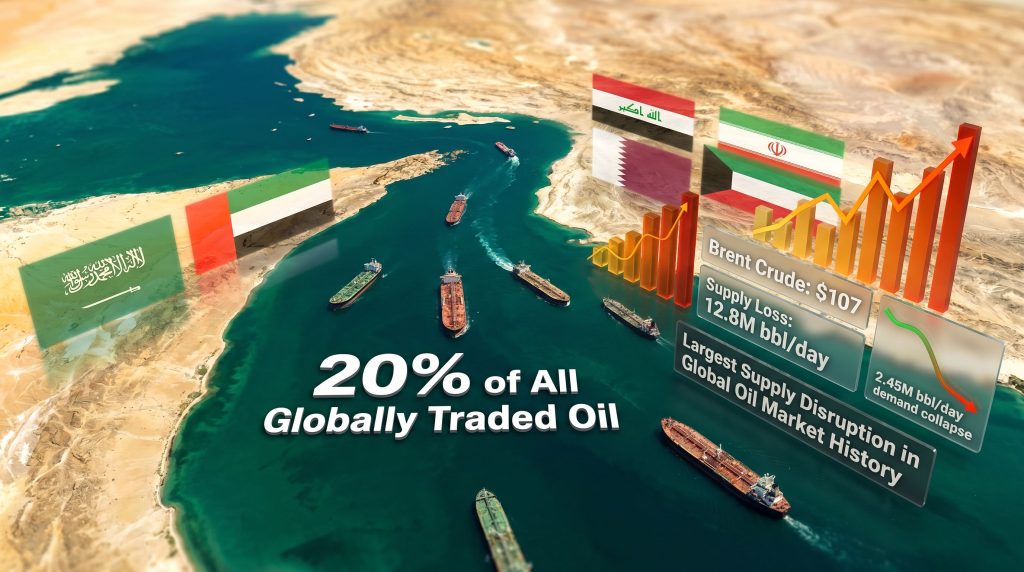
Under normal operating conditions, approximately 20% of all globally traded oil moves through this single corridor, making it the most heavily loaded energy transit point on the planet. The nations whose export infrastructure routes directly through the strait include Iran, Iraq, Saudi Arabia, the United Arab Emirates, Kuwait, and Qatar. Critically, Qatar's liquefied natural gas export network also relies on Hormuz access, meaning that the strait's closure does not merely interrupt crude oil flows. It simultaneously compresses global LNG supply, introducing a secondary shock into gas-dependent power generation markets across Europe and Asia.
What makes Hormuz uniquely dangerous as a single point of failure is the absence of meaningful bypass redundancy. Two pipeline alternatives exist. Saudi Arabia operates the East-West Petroline, which can route crude overland to Red Sea terminals at Yanbu. The UAE's Habshan-Fujairah pipeline provides a secondary diversion path to Gulf of Oman ports. Both systems offer genuine, if partial, relief. Neither comes close to replacing the full volume that transits Hormuz at peak capacity. The arithmetic is unforgiving: combined pipeline throughput represents a fraction of the roughly 12.8 million barrels per day in cumulative supply losses recorded since February 2026, according to the IEA's May 2026 monthly oil market report.
The Scale and Velocity of Supply Collapse
Supply disruption events are typically measured in their peak daily impact. What distinguishes the current Hormuz crisis is that both the magnitude and duration of losses are operating simultaneously at historic levels.
The IEA's data, reported via Bloomberg on May 14, 2026, provides the clearest picture of what has occurred since the Iran war effectively shuttered the strait:
| Metric | Figure |
|---|---|
| Total supply losses recorded since February 2026 | 12.8 million barrels per day |
| Additional supply loss recorded in the most recent month | 1.8 million barrels per day |
| Global observed inventory decline rate (March-April) | ~4 million barrels per day |
| Projected demand decline in current quarter | 2.45 million barrels per day |
| IEA market status assessment | Severely undersupplied until at least October 2026 |
The velocity dimension matters enormously here. A drawdown rate of 4 million barrels per day across observed global inventories is not simply a large number. It represents a pace of stock depletion that, if sustained, compresses the buffer that oil-importing economies rely upon to absorb price shocks. The IEA has been explicit: even in a scenario where the conflict concludes next month, markets will remain severely undersupplied through October 2026 at minimum.
For historical context, previous major supply disruptions — including the 1973 Arab oil embargo, the 1979 Iranian Revolution, and the 1990 Gulf War — each removed between 4 and 6 million barrels per day from global markets at their peaks. The 2026 Hormuz crisis, with its cumulative loss rate now surpassing 12.8 million barrels per day, represents a disruption of fundamentally different scale, which is precisely why the IEA has classified it as the largest in global oil market history.
Brent Crude Above $107: How Oil Markets Are Pricing Structural Risk
Commodity markets typically price known risks in advance and known resolutions quickly. The Strait of Hormuz shutdown oil crisis has complicated this dynamic considerably, with crude oil volatility becoming a defining feature of the current trading environment.
Brent crude surged approximately 8% across three consecutive trading sessions, breaching $107 per barrel as of May 14, 2026. What is analytically significant is not merely the price level itself, but the market's reluctance to price in any durable resolution. When the IEA released its May 2026 monthly report, Brent pared earlier intraday losses and stabilised above $107, indicating that the report's assessment of prolonged undersupply was sufficient to prevent any sustained bear pressure.
Toril Bosoni, Head of the Oil Markets and Industry Division at the IEA, framed the recovery timeline in terms that markets are struggling to price efficiently. She noted that even with a conflict resolution, restoring flows through the Strait of Hormuz to normalcy would take weeks to months, and that as long as disruptions persist and inventories continue declining, upward price pressure will intensify. This assessment establishes a critical asymmetry: price relief requires not just a political resolution, but the physical restoration of tanker routing, insurance market re-engagement, port infrastructure normalisation, and crew risk recalibration — all of which operate on timelines measured in weeks rather than days.
Why Reopening the Strait Does Not Immediately Lower Prices
This temporal asymmetry between political resolution and supply normalisation is one of the most underappreciated dynamics in the current crisis:
- War risk insurance premiums for Persian Gulf transit do not reset overnight after a ceasefire. Underwriters require demonstrated stability over a sustained period before rates normalise.
- Tanker repositioning logistics involve vessels that have been diverted to alternative routes, requiring time to return and reload.
- Port infrastructure in the region may require inspection and, where damaged, repair before full throughput can resume.
- Global inventory rebuild following a drawdown of this magnitude requires sustained oversupply for an extended period, not simply a return to baseline production.
Goldman Sachs analysts, cited in the same Bloomberg/Economic Times reporting, noted tentative evidence that the inventory drawdown rate may have modestly decelerated in recent days. Crucially, they attributed this not to any supply improvement, but to weakening demand from China. This distinction carries significant analytical weight: a demand-driven slowdown in inventory depletion is not a supply-side resolution. It means that high prices are beginning to suppress consumption, particularly in the world's largest oil-importing nation, which introduces a different set of risks around long-term demand recovery.
Demand Destruction at COVID-Scale: The Self-Limiting Mechanism in Action
One of the more counterintuitive features of major oil price shocks is that they carry within them the seeds of their own partial correction. As prices surge, demand contracts, which in turn moderates the pace of inventory depletion. Furthermore, the Hormuz crisis is demonstrating this mechanism in real time, though the scale of demand destruction is itself alarming.
The IEA projects that global oil consumption will decline by 2.45 million barrels per day in the current quarter. To understand how severe this is, consider the benchmark the IEA itself uses: the 2020 COVID-19 pandemic, which triggered the sharpest demand collapse in the modern oil market era. The current quarter's projected demand destruction is described as the steepest drop since that event.
The agency has revised its demand projections downward for three consecutive months since the conflict began, indicating that each monthly assessment is revealing a deeper deterioration than the previous model anticipated.
| Demand Context | Figure |
|---|---|
| Projected consumption decline (current quarter) | 2.45 million barrels per day |
| Consecutive monthly downward revisions by IEA | 3 months |
| Comparable historical demand event | 2020 COVID-19 pandemic collapse |
The mechanisms driving this demand destruction operate across multiple sectors simultaneously:
- Aviation: Elevated jet fuel costs are compressing airline margins, leading to route suspensions and capacity reductions, reducing jet fuel offtake.
- Transport and logistics: Higher diesel costs flow directly into freight rates, which in turn reduce physical goods movement and, therefore, fuel consumption.
- Industrial sectors: Energy-intensive manufacturing in price-sensitive economies is being curtailed or idled as input costs make operations uneconomic.
- Emerging market consumers: Price-sensitive populations in large oil-importing economies such as India, South Korea, and Turkey are demonstrating sharper demand elasticity at current price levels.
The Recession Transmission Mechanism: From Barrels to GDP
Energy economists and sovereign risk analysts are increasingly focused on a sequence of consequences that extends well beyond the oil market itself. The transmission mechanism from a Strait of Hormuz shutdown oil crisis to broader economic contraction follows a reasonably well-established pathway, and the risk of oil market disruption cascading into recession is no longer a fringe concern:
- Supply disruption generates a crude oil price spike that spreads across all refined product markets.
- Fuel, energy, and freight cost increases flow through to virtually every sector of the global economy.
- Consumer price inflation accelerates, eroding real household purchasing power and squeezing corporate margins simultaneously.
- Central banks face a difficult policy position, caught between inflation that argues for tighter monetary conditions and growth deterioration that argues for accommodation.
- Higher energy costs combined with constrained monetary policy reduce consumer spending and business investment.
- GDP contraction risk materialises in oil-importing economies, particularly those already carrying elevated post-pandemic debt burdens.
Historical precedent validates this transmission sequence. The 1973 oil embargo contributed directly to recessions across Western economies. The 1979 supply shock repeated the pattern. What makes the 2026 scenario potentially more severe is that many major economies are entering this shock with reduced fiscal buffers, having deployed substantial stimulus capacity during the 2020–2022 period and the subsequent inflationary cycle.
Recession Exposure by Economy Type
| Economy Type | Exposure Level | Key Vulnerability |
|---|---|---|
| Large oil-importing emerging markets (India, South Korea, Turkey) | Very High | High energy import dependency, limited reserve buffers |
| European economies | High | Limited domestic production, high Hormuz-linked import exposure |
| Japan | High | Near-total dependence on Middle East crude imports |
| United States | Moderate | Domestic production provides partial insulation; inflation transmission remains a risk |
| Major oil exporters (Saudi Arabia, UAE) | Low to Moderate | Revenue benefit from elevated prices; regional instability exposure |
The next major ASX story will hit our subscribers first
Emergency Response Mechanisms and Their Limitations
The IEA's coordinated response has involved releasing emergency strategic petroleum reserves across member economies, with the United States, Japan, and Germany among the major participants. Strategic reserve releases function by temporarily injecting pre-stored crude back into physical markets, providing a supply bridge while the underlying disruption persists.
The critical limitation of this mechanism is temporal. Strategic reserves are finite, and their release provides market stabilisation rather than structural supply restoration. They cannot sustain indefinite drawdown to compensate for 12.8 million barrels per day in cumulative losses. They are designed to buffer markets through short to medium-term disruptions, not to serve as primary supply sources across multi-month crises.
The bypass pipeline alternatives provide supplementary but insufficient relief:
- Saudi Arabia's East-West Petroline, running from Eastern Province fields to Yanbu on the Red Sea, offers meaningful throughput but cannot approach full Hormuz-equivalent capacity.
- The UAE's Habshan-Fujairah pipeline provides an additional diversion path, routing crude to Gulf of Oman ports outside the strait's closure zone.
- Combined, these alternatives represent genuine but structurally inadequate substitutes for the volume that normally transits Hormuz.
In addition, OPEC's market influence has been severely constrained by the fact that several of its most significant member producers are among those most directly affected by the closure, limiting the cartel's ability to engineer a compensatory supply response.
What the Hormuz Crisis Reveals About Structural Energy Vulnerability
Beyond the immediate market dynamics, the Strait of Hormuz shutdown oil crisis is exposing a concentration risk that energy security analysts have identified for decades but that policymakers and markets have persistently underpriced. The scale of this disruption far exceeds even the most severe oil price shock scenarios that were being modelled as recently as 2025.
"Decades of global economic growth were built on an implicit assumption that the Strait of Hormuz would remain functionally open. That assumption has now been tested at scale, and the results are revealing how inadequately the global energy system was designed for its absence."
The crisis is simultaneously strengthening the long-term argument for reducing dependence on fossil fuel supply chains and demonstrating the hard reality that such transitions require timelines measured in decades rather than quarters. No renewable energy scaling programme accelerates fast enough to provide relief within the October 2026 timeframe the IEA describes as the minimum period of severe undersupply.
What the crisis is likely to change permanently includes insurance market pricing models for Persian Gulf shipping, the strategic reserve expansion strategies of major oil-importing nations, and the urgency with which sovereign energy security frameworks are being rewritten across Asia and Europe. As Asia faces mounting energy pressure from the disruption to both oil and gas flows, long-term bilateral supply agreements, diversification of import source geographies, and accelerated investment in energy infrastructure redundancy are all likely to emerge as durable policy responses once the immediate crisis stabilises.
Disclaimer: This article is for informational purposes only and does not constitute financial or investment advice. Oil price projections, demand forecasts, and recession risk assessments are forward-looking in nature and subject to material uncertainty. Market conditions can change rapidly, and readers should conduct their own research and consult qualified advisors before making any investment or commercial decisions based on the information presented here. All statistics and IEA assessments cited reflect reporting published on May 14, 2026, via Bloomberg and Economic Times Energy World.
Want to Stay Ahead of Commodity Market Shifts Driven by Major Global Events?
Discovery Alert's proprietary Discovery IQ model scans ASX announcements in real time, instantly identifying significant mineral discoveries across more than 30 commodities — cutting through market noise to deliver actionable opportunities precisely when they matter most. Explore how major discoveries have historically generated exceptional returns on Discovery Alert's dedicated discoveries page, and begin your 14-day free trial today to position yourself ahead of the broader market.