July 11, 2026
The Energy Chokepoint That Prices Every Barrel on Earth
Every commodity extracted from the ground, every tonne of nickel processed through high-pressure acid leach, every copper anode shipped across the Pacific carries an invisible embedded cost tied to a 33-kilometre-wide passage between Oman and Iran. The Strait of Hormuz does not merely influence global energy pricing. It sets the floor beneath it.
When that passage becomes contested, the consequences ripple outward far beyond the oil tanker markets. Refinery throughput tightens. Distillate crack spreads widen. Diesel costs at mine sites climb before a single official disruption figure reaches a government database. Understanding the mechanics of how a Strait of Hormuz oil disruption translates into a Brent rally, and where that rally starts compressing mining margins, is no longer optional analysis for energy-intensive operators. It is essential risk management.
When big ASX news breaks, our subscribers know first
Why the Strait of Hormuz Remains Irreplaceable in Global Energy Architecture
The Scale of Dependency Is Structural, Not Situational
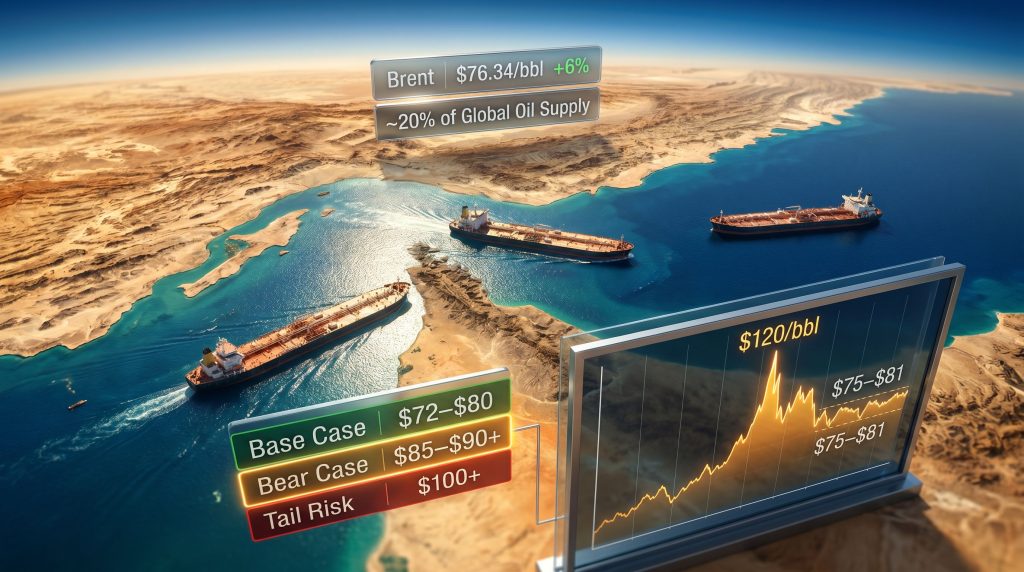
Approximately 20% of global oil supply transits the Strait of Hormuz daily, representing somewhere between 17 and 21 million barrels of crude and petroleum products at pre-conflict volumes. That figure has been quoted so frequently that it risks becoming abstract. The practical reality is more confronting: no pipeline network exists at sufficient scale to compensate for even a partial closure of this corridor.
The main pipeline alternatives, including the Petroline across Saudi Arabia with a capacity of approximately 5 million barrels per day, cover only a fraction of what moves by sea through the strait each day. Beyond crude oil, a significant share of global LNG exports also transits this waterway, meaning disruptions extend their reach into gas-powered industrial and smelting operations throughout Asia. The crude oil price trends emanating from this region, furthermore, have historically set the tone for energy costs across the entire mining sector.
Rerouting Is Not a Solution: The Cape of Good Hope Problem
The instinctive response to any Persian Gulf disruption is to reroute shipping around the Cape of Good Hope. This alternative adds approximately 10 to 15 days of transit time to any voyage and substantially increases bunker fuel consumption, both of which translate directly into higher landed costs for crude importers.
There is a less-discussed structural barrier that makes rerouting even more difficult: Asian refineries are specifically configured to process Gulf crude grades. The molecular composition of Arabian Light, Murban, and Basra Heavy crude has shaped refinery coker units, hydrocracker configurations, and fluid catalytic cracker feedstock requirements across Japan, South Korea, China, and India over decades of capital investment.
Switching feedstock grades is not a matter of preference; it requires operational adjustments, yield changes, and in some cases, physical modification of processing equipment. This grade-specificity acts as an invisible multiplier on supply disruption severity.
War-risk insurance premiums represent a third constraint that analysts frequently underweight. During the 2019 tanker attack incidents near the strait, war-risk premiums spiked by factors of five to ten within days, effectively pricing commercial operators out of the lane before any formal blockade was declared. Insurance markets can shut down commercial shipping through risk pricing alone.
The 2026 Escalation: Anatomy of a Market-Moving Event
How the Ceasefire Collapsed and What Followed
After a three-week ceasefire paused hostilities in the fifth month of the conflict, Iranian forces struck US military infrastructure across Gulf states following US strikes on Iranian coastal and eastern provinces. The event that directly triggered the most recent shipping slowdown was Iran's strike on a Qatari LNG carrier exiting the Strait of Hormuz near Oman.
Vessel owners responded immediately. Strait of Hormuz ship traffic fell by approximately 15% as operators suspended transits pending security reassessment. Oil market disruption risks of this nature extend well beyond crude, however, as the LNG carrier targeting reached into the gas supply chains that power Asian smelting and processing infrastructure. This dimension is consistently underweighted in headline price analysis, which tends to focus narrowly on crude oil volumes.
The March 2026 Peak and What the Data Showed
The initial Hormuz disruption earlier in 2026 removed an estimated 10.1 million barrels per day from global supply at its most acute phase, producing what analysts described as the largest monthly supply disruption in the recorded history of global oil markets. According to reporting from Al Jazeera, Brent crude rose by approximately 65% in a single month, reaching above $120 per barrel at its peak.
| Market Event | Data Point |
|---|---|
| Peak Brent price (March 2026) | Above $120/bbl |
| Monthly price increase | |
| Global supply removed | ~10.1 mb/d |
| US crude inventory draw | 11.5 million barrels in one reporting period |
| US gasoline price increase | More than $0.65/gallon |
| Downstream fuel shortages | Thailand, Pakistan, Bangladesh |
Where Prices Settled After the Ceasefire
The temporary truce allowed Brent to retreat to a $75 to $81 per barrel trading range as of early July 2026. The most recent weekly move, a 6% gain to $76.34 per barrel, does not reflect a return to peak-conflict pricing. It reflects renewed escalation risk following the ceasefire collapse, a materially different condition from confirmed physical supply removal. WTI rose approximately 5% to $72.15 per barrel over the same period.
Inventory Fragility: Why the Market Has No Cushion Left
Reading the EIA Data for What It Actually Signals
Before the Hormuz standstill intensified, EIA data for the week ending July 3, 2026 showed the following:
- US commercial crude inventories: 411.4 million barrels (up 3.0 million barrels week-on-week)
- Position vs. five-year seasonal average: 6% below
- US distillate fuel inventories: 103.6 million barrels
- Position vs. five-year seasonal average: 12% below
- US refinery utilization: 95.8% of capacity
The 3.0 million barrel crude build looks superficially reassuring until it is placed alongside the 5.0 million barrel distillate decline in the same reporting period. Distillates, encompassing diesel, heating oil, and jet fuel, are the primary energy input for mining haul trucks, processing plant generators, and long-haul logistics. A distillate stock running 12% below its five-year average while refineries operate at near-maximum utilisation leaves almost no capacity to absorb an import disruption.
Why Distillate Matters More Than Crude for Miners: Mining operations consume relatively little crude oil directly. Their primary exposure is diesel and industrial distillate fuels. When distillate inventories tighten, crack spreads widen, and the retail diesel price miners pay can surge even if crude prices remain stable. The current distillate deficit creates a vulnerability that crude inventory figures alone do not capture.
The 200 Million Barrel Buffer and Its Exhaustion
The prior US-Iran memorandum of understanding allowed approximately 200 million barrels from previously trapped vessels to exit the Strait of Hormuz. That volume is roughly equivalent to two days of global oil demand. According to energy analyst Ellen Wald, the vast majority of this released inventory has already been consumed by the market.
The practical implication is significant: a second diplomatic agreement, even if reached promptly, would deliver materially less immediate price relief than the first. The inventory buffer created by the initial MOU has been drawn down. Markets cannot be relieved by the same mechanism twice at the same magnitude.
Three Price Scenarios for the Second Half of 2026
Scenario Framework: The Variables That Determine the Outcome
| Scenario | Key Conditions | Brent Range | Mining Cost Impact |
|---|---|---|---|
| Base Case | No formal blockade; Iranian exports continue; diplomacy limits escalation | $72-$80/bbl | Near-current levels; manageable |
| Bear Case | US reimposed blockade removes 1.5-2.0 mb/d; sustained physical tightness | $85-$90/bbl+ | Margin compression at energy-intensive operations |
| Tail Risk | Iranian strikes on Gulf producer infrastructure; multi-producer disruption | Toward $100/bbl+ | Severe cost pressure; budgets invalidated |
The Blockade Variable: Why 1.5 to 2.0 mb/d Changes Everything
Energy policy analyst David Goldwyn has assessed that a reimposed US blockade targeting Iranian crude would remove an estimated 1.5 to 2.0 million barrels per day from global supply. At current inventory levels, that volume would not merely inflate the geopolitical risk premium; it would translate into confirmed physical tightness within weeks.
Iranian exports have continued flowing to risk-tolerant buyers despite the MOU collapse, providing a partial offset. Most Hormuz transit volumes originate from Iran or countries with private commercial arrangements with Tehran, which allows those flows to persist independently of formal diplomatic frameworks. The critical variable, as Goldwyn notes, is therefore not Iran's willingness to export but whether the US decides to enforce a formal blockade.
ClearView Energy analysts have further warned that Iranian retaliatory strikes on Gulf producer infrastructure could compound the disruption beyond what a blockade alone would achieve, potentially delaying or halting production recovery across multiple Gulf nations simultaneously. Consequently, commodity volatility hedging strategies have become increasingly relevant for mining operators exposed to these price swings.
What a Ceasefire Would and Would Not Fix
A formal ceasefire or new transit agreement would reduce the geopolitical risk premium embedded in current prices. However, analysts consistently caution that market normalisation would take months rather than days, even following a full reopening. As reported by the Caspian Post, the friction costs that persist beyond formal hostilities include:
- Restarting idle production fields shut down during the conflict period
- Repairing damaged port and terminal infrastructure
- Clearing naval mines deployed across transit lanes
- Rebuilding seafarer confidence in the security of Gulf transits
- Allowing war-risk insurance premiums to normalise through underwriter reassessment cycles
Energy market analyst Vandana Hari noted that confidence in renewed US-Iran diplomacy has so far limited further crude price gains, even as Hormuz shipping remains near a standstill. Separately, energy analyst Daniel Hynes observed that markets drew some reassurance from the Trump administration's decision not to target Iranian energy infrastructure directly despite broader military escalation.
The $85 to $90 Per Barrel Threshold: Where Mining Economics Change
Energy Cost Exposure Across Mining Commodity Types
Not all mining operations face equal exposure to an oil price surge. The hierarchy of vulnerability is driven by energy's share of total cash costs:
- Nickel HPAL (High-Pressure Acid Leach) facilities rank among the most energy-exposed operations in the mining sector, consuming substantial quantities of steam, electricity, and fuel across the pressure oxidation and neutralisation stages
- Copper smelters carry high energy cost burdens through concentrate drying, reverberatory furnace operation, and converter stages
- Long-haul open pit operations with large diesel-powered truck fleets face direct diesel cost exposure proportional to haulage distance and gradient
- Gold producers with lower energy intensity may experience a more ambiguous impact: higher fuel costs on the cost side, offset by safe-haven demand strengthening the gold price on the revenue side
The $85-90/bbl Threshold: Industry analysis identifies this Brent price range as the level at which quarterly fuel cost benchmarks begin materially compressing margins at the most energy-intensive operations. Above this threshold, the cost increase is no longer absorbable within normal quarterly budget variance tolerances.
Crack Spreads as an Early Warning Mechanism
Diesel and distillate crack spreads (the price differential between refined distillate products and the crude oil feedstock) widen before confirmed physical disruptions appear in inventory reporting data. For mining financial teams, monitoring crack spread movements can provide one to two weeks of advance warning before fuel cost increases flow through to operational budgets.
With distillate stocks already running 12% below their five-year average and refineries at 95.8% capacity utilisation, crack spreads are already under structural upward pressure before any additional Hormuz supply loss reaches refinery intake levels. In addition, commodity prices and mining margins are already being scrutinised closely by operators planning their second-half budgets.
The 2026 Consensus Brent Forecast and Its Budget Implications
| Year | Brent Consensus Forecast | Mining Budget Implication |
|---|---|---|
| 2026 | ~$86/bbl average | Above margin compression threshold for high-energy operations |
| 2027 | ~$70/bbl (supply normalization) | Potential relief if normalization proceeds on schedule |
The 2026 consensus forecast of approximately $86 per barrel sits directly at the margin compression threshold. Any sustained escalation pushes above it; any diplomatic progress pulls below it. The range between these two outcomes defines the operating cost uncertainty that energy-intensive mining operators currently face.
The next major ASX story will hit our subscribers first
Key Indicators: A Monitoring Framework for the Next Price Move
The July 15 EIA Report as the First Real Signal
The EIA Weekly Petroleum Status Report covering the week ending July 10, 2026, due for release on July 15, will be the first dataset to capture the physical supply impact of the intensified Hormuz standstill. The prior report, covering the week ending July 3, predates the escalation.
Two consecutive weeks of crude inventory draws, combined with continued distillate stock declines, would confirm that geopolitical risk is translating into actual physical market tightness rather than sentiment-driven pricing. Brent sustaining above $80 per barrel on confirmed physical draws would represent a credible directional signal toward the $85 to $90 per barrel range.
Weekly Indicators to Track
- EIA crude and distillate inventory levels versus five-year seasonal averages
- Strait of Hormuz vessel transit counts from AIS shipping data providers
- War-risk insurance premium movements for Gulf shipping lanes
- Diesel and distillate crack spread direction and magnitude
- US refinery utilisation rates (currently at 95.8%, near the practical ceiling)
- Any formal US policy announcement on blockade reimposition or new diplomatic engagement with Tehran
The Asymmetric Risk That Mining Operators Cannot Ignore
The downside scenario, Brent stabilising in the $72 to $80 per barrel range as diplomacy constrains further escalation, is manageable for most operators within existing quarterly fuel budgets. The upside risk scenario, Brent breaking above $85 to $90 per barrel on confirmed physical draws and sustained Strait of Hormuz oil disruption, creates a qualitatively different operating environment.
Three structural factors converge to make that upside risk scenario more consequential than historical analogies might suggest:
- Inventory fragility: US crude stocks are 6% below their five-year average and distillate stocks are 12% below average, providing minimal buffer capacity
- Diplomatic buffer exhaustion: The approximately 200 million barrel release from the prior US-Iran MOU has been largely consumed, limiting the price relief a second agreement could deliver
- Sanctions policy uncertainty: Whether the US reimposed a formal blockade removing 1.5 to 2.0 mb/d remains the single most consequential undetermined policy variable for oil prices in the second half of 2026
Energy analyst Ellen Wald has argued that, given these structural conditions, Brent should already be trading above $80 per barrel. That view, if validated by the July 15 EIA data, would suggest current prices are not yet fully reflecting the physical supply risk embedded in the Hormuz disruption. Furthermore, the broader mining commodity outlook for copper and uranium remains inextricably linked to how this energy cost environment evolves through the remainder of the year.
For energy-intensive mining operators, the July 15 EIA report is not just another weekly data release. It is the first empirical test of whether the Strait of Hormuz oil disruption and the Brent rally it has generated represent a transient risk premium or the early stages of a sustained supply shock that will rewrite quarterly cost assumptions across the sector.
Disclaimer: This article contains forward-looking analysis, scenario projections, and references to third-party analyst commentary. It does not constitute financial or investment advice. Commodity prices and geopolitical conditions are inherently unpredictable. Readers should conduct independent due diligence before making investment or operational decisions based on the information presented.
Want to Stay Ahead of the Next Major ASX Mineral Discovery?
While geopolitical disruptions reshape energy costs and mining margins, Discovery Alert's proprietary Discovery IQ model cuts through the complexity — delivering real-time alerts on significant ASX mineral discoveries and turning critical market data into actionable investment insights. Explore Discovery Alert's discoveries page to understand how historic mineral discoveries have generated substantial returns, and begin your 14-day free trial today to position yourself ahead of the broader market.